. 2014 Jun 26;5(6):e58.
doi: 10.1038/ctg.2014.9.

Noncontaminated dietary oats may hamper normalization of the intestinal immune status in childhood celiac disease

Affiliations

Noncontaminated dietary oats may hamper normalization of the intestinal immune status in childhood celiac disease

Veronika Sjöberg et al. Clin Transl Gastroenterol. .

Abstract

Objectives: Life-long, strict gluten-free diet (GFD) is the only treatment for celiac disease (CD). Because there is still uncertainty regarding the safety of oats for CD patients, the aim was to investigate whether dietary oats influence the immune status of their intestinal mucosa.

Methods: Paired small intestinal biopsies, before and after >11 months on a GFD, were collected from children with CD who were enrolled in a randomized, double-blind intervention trial to either of two diets: standard GFD (GFD-std; n=13) and noncontaminated oat-containing GFD (GFD-oats; n=15). Expression levels of mRNAs for 22 different immune effector molecules and tight junction proteins were determined by quantitative reverse transcriptase (RT)-PCR.

Results: The number of mRNAs that remained elevated was higher in the GFD-oats group (P=0.05). In particular, mRNAs for the regulatory T cell (Treg) signature molecules interleukin-10 (IL-10) and transforming growth factor-β1 (TGF-β1), the cytotoxicity-activating natural killer (NK) receptors KLRC2/NKG2C and KLRC3/NKG2E, and the tight junction protein claudin-4 remained elevated. Between the two groups, most significant differences were seen for claudin-4 (P=0.003) and KLRC3/NKG2E (P=0.04).

Conclusions: A substantial fraction of pediatric CD patients seem to not tolerate oats. In these patients, dietary oats influence the immune status of the intestinal mucosa with an mRNA profile suggesting presence of activated cytotoxic lymphocytes and Tregs and a stressed epithelium with affected tight junctions. Assessment of changes in levels of mRNA for claudin-4 and KLC3/NKG2E from onset to after a year on oats containing GFD shows promise to identify these CD patients.


Figures

Figure 1
Figure 1
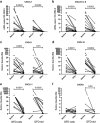
Cytokines and an inflammatory effector molecule. Expression levels of mRNAs for (a) interleukin (IL)-17A (n=10 and 9 for the GFD-oats and GFD-std groups, respectively), (b) interferon-γ (IFN-γ n=10 and 9), (c) IL-10 (n=15 and 13), (d) transforming growth factor-β1 (TGF-β1; n=15 and 12), (e) tumor necrosis factor-α (TNF-α n=11 and 6), and (f) inducible nitric oxide synthase (iNOS; n=15 and 13) in small intestinal biopsies of celiac disease (CD) patients before (Before) and after (After) gluten-free diet (GFD) with oats (GFD-oats) or standard GFD without oats (GFD-std). Amounts of IL-17A, IFN-γ, IL-10, TGF-β1, and TNF-α mRNAs were determined by quantitative reverse transcriptase-PCR (qRT-PCR) with an RNA copy standard and normalized to the 18S rRNA content in the sample (mRNA copies/18S rRNA arbitrary unit (U)). Amounts of iNOS mRNA were determined by qRT-PCR with no copy standard and normalized to 18S rRNA in the sample by calculating the ΔCT value between the mRNA and the 18S rRNA. The relative quantity (RQ) of iNOS mRNA was calculated as 2(−ΔΔCT) where ΔΔCT is the ΔCT value for the sample minus the median ΔCT-value in biopsies of 13 clinical controls. Each point represents a single patient before and after GFD. Lines connect the mRNA levels in biopsies of single CD patients before and after GFD. Statistically significant differences in mRNA levels before and after GFD are indicated. Statistical comparisons were performed by using two-sided Wilcoxon matched paired t-test.
Figure 2
Figure 2
Chemokines and a chemokine receptor. Expression levels of mRNAs for (a) CX3CL1 (n=15 and 13 for the gluten-free diet (GFD)-oats and GFD-std groups, respectively), (b) CXCL8/interleukin-8 (IL-8) (n=15 and 13), (c) CXCL9 (n=15 and 13), (d) CXCL10 (n=14 and 13), (e) CXCL11 (n=14 and 13), and (f) CXCR3 (n=10 and 6) in small intestinal biopsies of celiac disease (CD) patients before (Before) and after (After) a GFD with oats (GFD-oats) or standard GFD without oats (GFD-std). Amounts of CX3CL1 and CXCL8/IL-8 mRNAs are given as mRNA copies/18S rRNA arbitrary unit (U). Amounts of CXCL9, CXCL10, CXCL11, and CXCR3 are given as relative quantity (RQ) compared with the median ΔCT-value of 13 clinical controls. For further details, see legend for Figure 1.
Figure 3
Figure 3
Natural killer (NK) receptors and a NK receptor ligand. Expression levels of mRNAs for (a) KLRC2/NKG2C (n=11 and 10 for the GFD-oats and GFD-std groups, respectively), (b) KLRC3/NKG2E (n=15 and 13), (c) KLRD1/CD94 (n=15 and 13), and (d) HLA-E (n=15 and 13) in small intestinal biopsies of celiac disease (CD) patients before (Before) and after (After) a gluten-free diet (GFD) with oats (GFD-oats) or standard GFD without oats (GFD-std). mRNA levels are given as relative quantity (RQ) compared with the median ΔCT-value of 13 clinical controls. For further details, see legend for Figure 1.
Figure 4
Figure 4
Epithelial tight junction components. Expression levels of mRNAs for (a) claudin-4 (CLDN-4; n=15 and 13 for the GFD-oats and GFD-std groups, respectively) and (b) occludin (OCLN; n=15 and 13) in small intestinal biopsies of celiac disease (CD) patients before (Before) and after (After) a gluten-free diet (GFD) with oats (GFD-oats) or standard GFD without oats (GFD-std). Amounts of mRNAs are given as relative quantity (RQ) compared with the median ΔCT-value of 13 clinical controls. For further details, see legend for Figure 1.
Figure 5
Figure 5
Influence of gluten-free diet (GFD) on the cytokine profile of each individual celiac disease (CD) patient, indicated by their patient code (H-number), in the two study-groups receiving either GFD with oats (GFD-oats) or GFD without oats (GFD-std). The 17 mRNA species that changed after the GFD intervention are shown. An arrow pointing down in a green box indicates a decreased mRNA level after intervention with GFD, i.e., the expression level in the second biopsy<90% of the expression level in the first biopsy. An arrow pointing upward in a red box indicates an unchanged or increased mRNA level after intervention with GFD, i.e., the expression level in the second biopsy ≥90% of that in the first biopsy. UD (undetected) written in a yellow box indicates that the mRNA species was not detected in either one of the two biopsies, i.e., neither before nor after GFD. Normalized: <2 mRNA species unchanged or increased after GFD.

References

    1. Sollid LM. Coeliac disease: dissecting a complex inflammatory disorder. Nat Rev Immunol. 2002;2:647–655. - PubMed
    1. Di Sabatino A, Corazza GR. Coeliac disease. Lancet. 2009;373:1480–1493. - PubMed
    1. Green PH, Cellier C. Celiac disease. N Engl J Med. 2007;357:1731–1743. - PubMed
    1. Kneepkens CM, von Blomberg BM. Clinical practice: coeliac disease. Eur J Pediatr. 2012;171:1011–1021. - PMC - PubMed
    1. Castellanos-Rubio A, Santin I, Irastorza I, et al. TH17 (and TH1) signatures of intestinal biopsies of CD patients in response to gliadin. Autoimmunity. 2009;42:69–73. - PubMed