. 2014 Jun 25;3(3):e000854.
doi: 10.1161/JAHA.114.000854.

Increasing muscle mass improves vascular function in obese (db/db) mice

Affiliations

Increasing muscle mass improves vascular function in obese (db/db) mice

Shuiqing Qiu et al. J Am Heart Assoc. .

Abstract

Background: A sedentary lifestyle is an independent risk factor for cardiovascular disease and exercise has been shown to ameliorate this risk. Inactivity is associated with a loss of muscle mass, which is also reversed with isometric exercise training. The relationship between muscle mass and vascular function is poorly defined. The aims of the current study were to determine whether increasing muscle mass by genetic deletion of myostatin, a negative regulator of muscle growth, can influence vascular function in mesenteric arteries from obese db/db mice.

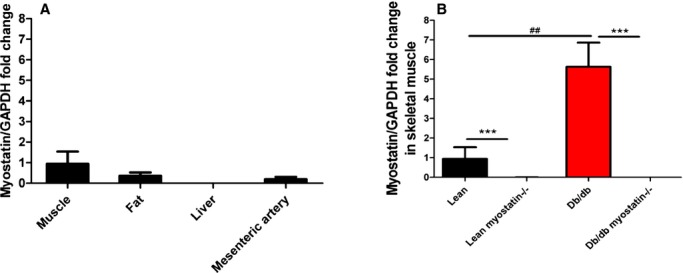
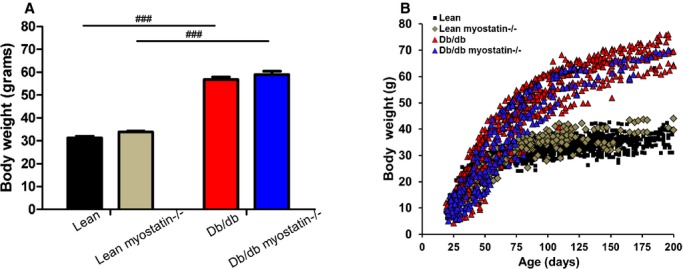
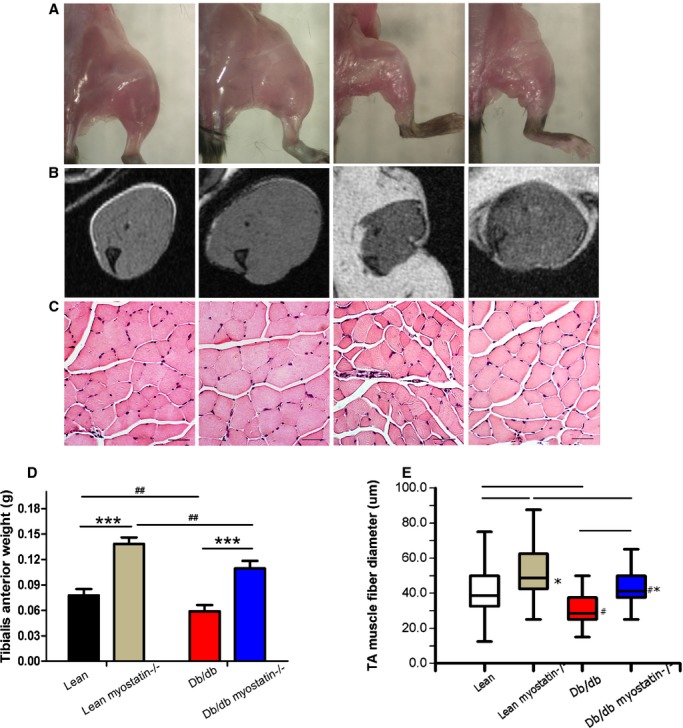
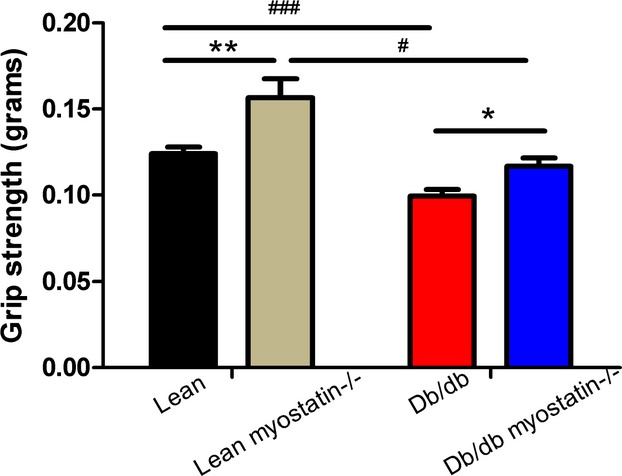
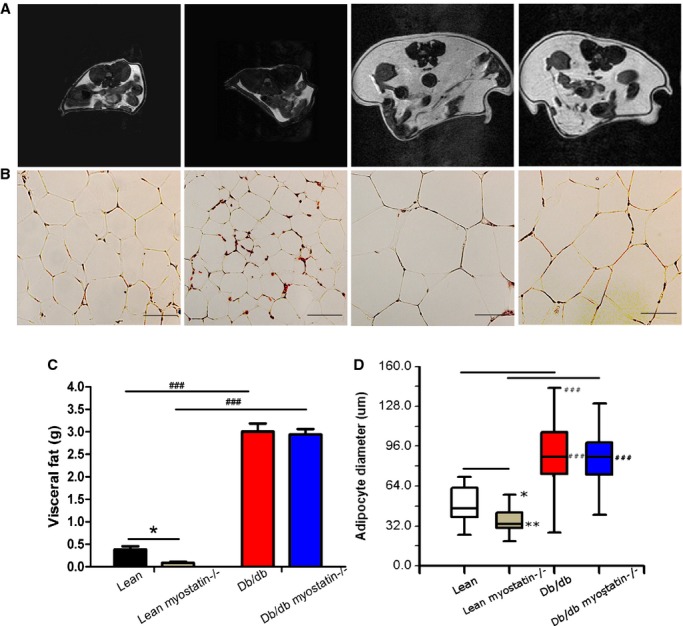
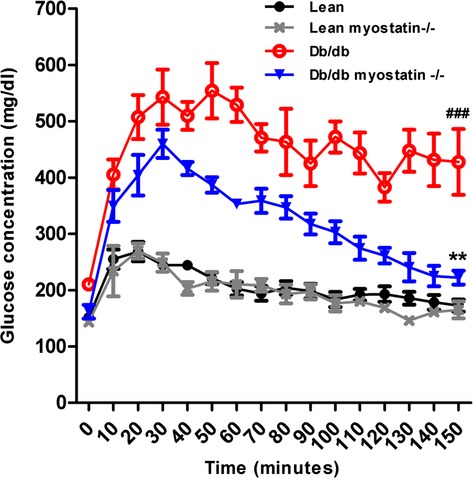
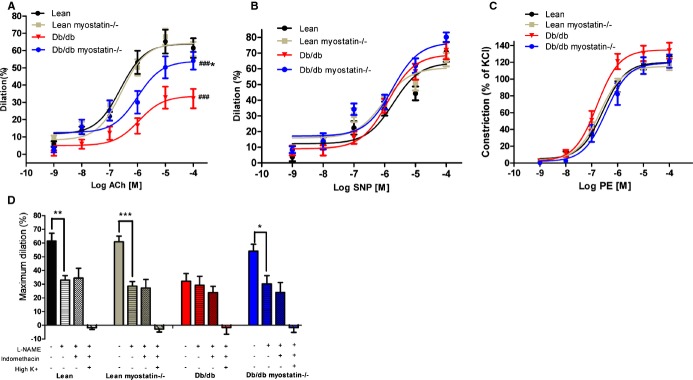
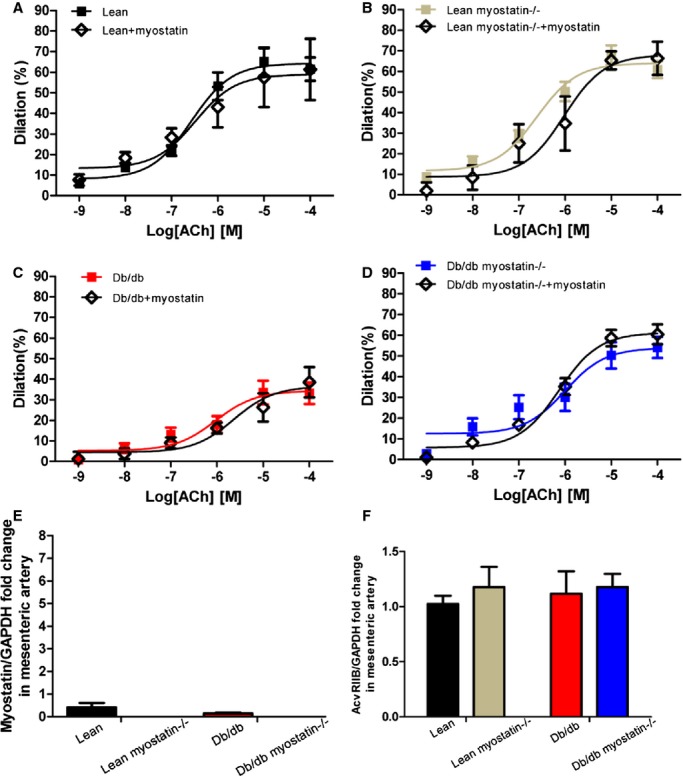
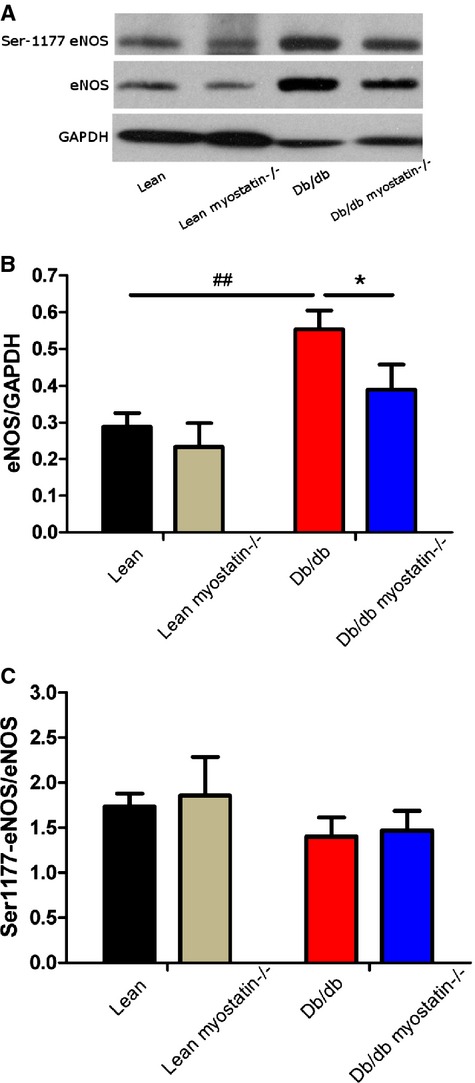
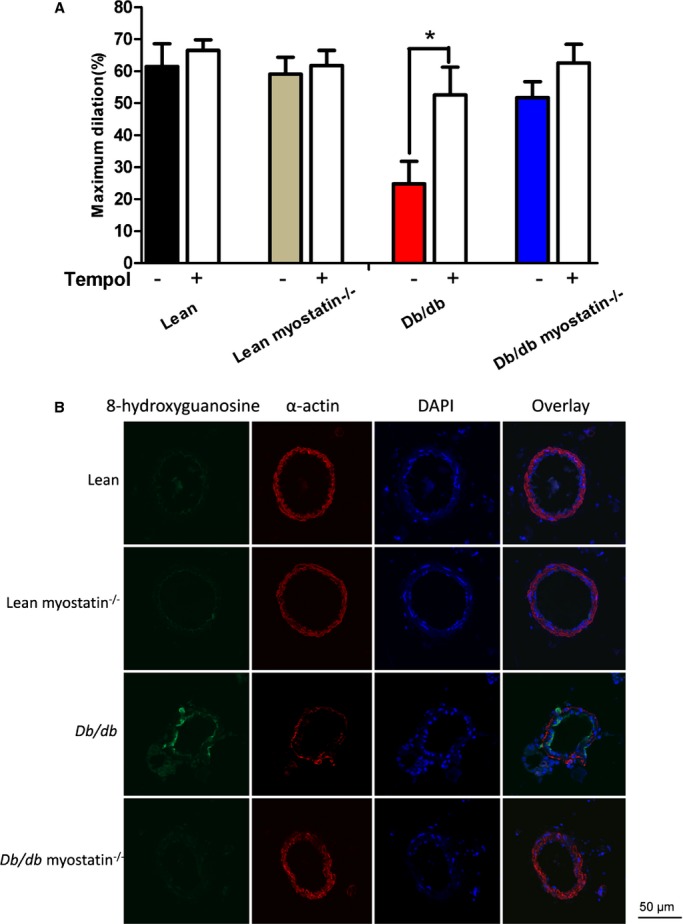
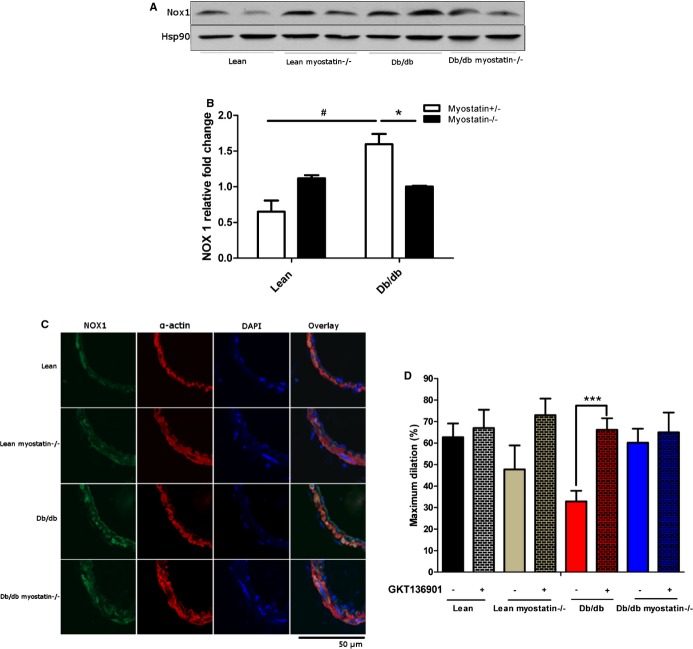
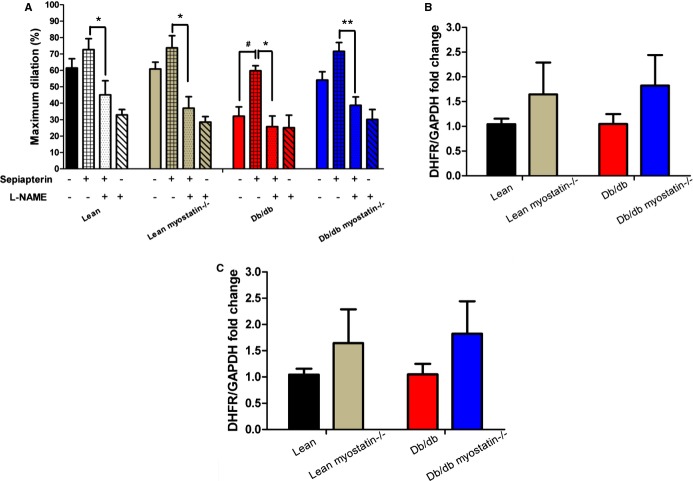
Methods and results: Myostatin expression was elevated in skeletal muscle of obese mice and associated with reduced muscle mass (30% to 50%). Myostatin deletion increased muscle mass in lean (40% to 60%) and obese (80% to 115%) mice through increased muscle fiber size (P<0.05). Myostatin deletion decreased adipose tissue in lean mice, but not obese mice. Markers of insulin resistance and glucose tolerance were improved in obese myostatin knockout mice. Obese mice demonstrated an impaired endothelial vasodilation, compared to lean mice. This impairment was improved by superoxide dismutase mimic Tempol. Deletion of myostatin improved endothelial vasodilation in mesenteric arteries in obese, but not in lean, mice. This improvement was blunted by nitric oxide (NO) synthase inhibitor l-NG-nitroarginine methyl ester (l-NAME). Prostacyclin (PGI2)- and endothelium-derived hyperpolarizing factor (EDHF)-mediated vasodilation were preserved in obese mice and unaffected by myostatin deletion. Reactive oxygen species) was elevated in the mesenteric endothelium of obese mice and down-regulated by deletion of myostatin in obese mice. Impaired vasodilation in obese mice was improved by NADPH oxidase inhibitor (GKT136901). Treatment with sepiapterin, which increases levels of tetrahydrobiopterin, improved vasodilation in obese mice, an improvement blocked by l-NAME.

Conclusions: Increasing muscle mass by genetic deletion of myostatin improves NO-, but not PGI2- or EDHF-mediated vasodilation in obese mice; this vasodilation improvement is mediated by down-regulation of superoxide.

Keywords: NOX1; muscle mass; myostatin; oxidant stress; tetrahydrobiopterin; vasodilation.


Figures

Figure 1.
Figure 1.
Myostatin expression was assessed by real‐time PCR. A, Myostsatin mRNA expression in different tissues of lean mice (n=6). B, Myostsatin mRNA expression in skeletal muclse of lean, lean myostatin−/−, db/db, and db/db myostatin−/− mice (n=8). A and B, Relative gene expression levels were quantified using the 2‐ΔΔCt approximation method. Gene expression was normalized twice to a control sample that was additionally normalized to GAPDH. Data are shown as mean±SEM. ***P<0.001, lean myostatin−/− versus lean or db/db myostatin−/− versus db/db. ##P<0.01, db/db versus lean or db/db myostatin−/− versus lean myostatin−/−. db/db myostatin−/− indicates mice lacking both myostatin and leptin receptor; db/db, obese leptin receptor‐deficient mice heterozygous for myostastin; lean myostatin−/−, myostatin‐null mice heterozygous for leptin receptors; lean, lean dual heterozygotes; PCR, polymerase chain reaction.
Figure 2.
Figure 2.
Body weight was not changed by myoststin deletion. A, Body weight of all 4 groups of genotype at the time of experiment. Twenty‐week‐old male mice were used for measurement. B, Growth curve of all the genotypes. Deletion of myostatin did not have an effect on body weight or weight gain in either lean or obese db/db mice. A and B, Data are shown as mean±SEM (n=8). ###P<0.001, db/db versus lean or db/db myostatin−/− versus lean myostatin−/−. db/db myostatin−/− indicates mice lacking both myostatin and leptin receptor; db/db, obese leptin receptor‐deficient mice heterozygous for myostastin; lean myostatin−/−, myostatin null mice heterozygous for leptin receptors; lean, lean dual heterozygotes.
Figure 3.
Figure 3.
The myostatin gene significantly increased muscle mass in both lean and obese (db/db) mice. A, Increased skeletal muscle mass by deletion of myostatin in both lean and obese (db/db) mice. B, Axial leg MRI scans. Muscle is shown in gray; adipose tissue is shown in white. C, Sections of distal hindlimbs (TA muscle) stained with hematoxylin and eosin (×200); bars represent 50 μm. A through C, left to right: lean, lean myostatin−/−, db/db, and db/db myostatin−/−. D, Tibialis anterior muscle weight of all groups of mice. E, Tibialis anterior myofiber diameter. Data reported here as representative hematoxylin and eosin–stained cryosections, and as box and whisker plots comprising minimum, median, and maximum value for myofiber diameter. Data are shown as mean±SEM (A through E: n=8). *P<0.05; ***P<0.001, lean myostatin−/− versus lean or db/db myostatin−/− versus db/db. #P<0.05; ##P<0.01, db/db versus lean or db/db myostatin−/− versus lean myostatin−/−. db/db myostatin−/− indicates mice lacking both myostatin and leptin receptor; db/db, obese leptin receptor‐deficient mice heterozygous for myostastin; lean myostatin−/−, myostatin‐null mice heterozygous for leptin receptors; lean, lean dual heterozygotes; MRI, magnetic resonance imaging; TA, tibialis anterior.
Figure 4.
Figure 4.
Forelimb grip strength of all groups of mice (n=5 to 10). *P<0.05; **P<0.01, lean myostatin−/− versus lean or db/db myostatin−/− versus db/db; #P<0.05; ###P<0.001, db/db versus lean or db/db myostatin−/− versus lean myostatin−/−. Data are shown as mean±SEM. db/db myostatin−/− indicates mice lacking both myostatin and leptin receptor; db/db, obese leptin receptor‐deficient mice heterozygous for myostastin; lean myostatin−/−, myostatin‐null mice heterozygous for leptin receptors; lean, lean dual heterozygotes.
Figure 5.
Figure 5.
Deletion of myostatin reduces fat mass in lean, but not obese, mice. A, Abdominal axial T1‐weighted cross‐section of MRI scan; adipose tissue is shown in white (n=3). B, Hematoxylin and eosin (H&E) staining for visceral fat (×200); bars represent 50 μm. A and B, From left to right: lean, lean myostatin−/−, db/db, and db/db myostatin−/− (n≥8). C, Visceral fat weight of all the genotypes (n≥8). D, Quantification of representative H&E‐stained cryosections, presenting as box‐and‐whisker plots comprising minimum, median, and maximum value for adipocytes diameter (n≥8). *P<0.05; **P<0.01, lean myostatin−/− versus lean or db/db myostatin−/− versus db/db; ###P<0.001; db/db versus lean or db/db myostatin−/− versus lean myostatin−/−. Data are shown as mean±SEM. db/db myostatin−/− indicates mice lacking both myostatin and leptin receptor; db/db, obese leptin receptor‐deficient mice heterozygous for myostastin; lean myostatin−/−, myostatin‐null mice heterozygous for leptin receptors; lean, lean dual heterozygotes; MRI, magnetic resonance imaging.
Figure 6.
Figure 6.
Glucose tolerance test of all groups of male mice. Symbols represent the results from repeated measures by using NCSS software (NCSS, LLC, Kaysville, UT). **P<0.01, lean myostatin−/− versus lean or db/db myostatin−/− versus db/db; ###P<0.001, db/db versus lean or db/db myostatin−/− versus lean myostatin−/−. Data are shown as mean±SEM (n=4). db/db myostatin−/− indicates mice lacking both myostatin and leptin receptor; db/db, obese leptin receptor‐deficient mice heterozygous for myostastin; lean myostatin−/−, myostatin‐null mice heterozygous for leptin receptors; lean, lean dual heterozygotes.
Figure 7.
Figure 7.
Endothelium‐dependent vasodilation was improved by deletion of myostatin in obese mice. A, Obese mice demonstrated a significant drop in acetylcholine‐induced dilation, which was improved by deletion of myostatin. B, Endothelium‐independent vasodilation response to SNP (B) and vasoconstriction to PE (C) were similar among all 4 groups of mice. D, Deletion of myostatin in obese mice improved nitric oxide–mediated dilation, which is blocked by l‐NAME. PGI2‐ and EDHF‐mediated dilation were measured in the presence of l‐NAME+indomethacin and l‐NAME+indomethacin+high K+. *P<0.05; **P<0.01; ***P<0.001, lean myostatin−/− versus lean or db/db myostatin−/− versus db/db; #P<0.05, ##P<0.01; ###P<0.001, db/db versus lean or db/db myostatin−/− versus lean myostatin−/−. A through D, n>6. Symbols represent the results from repeated measures by using NCSS software (NCSS, LLC, Kaysville, UT). The data are given as the mean±SEM. db/db myostatin−/− indicates mice lacking both myostatin and leptin receptor; db/db, obese leptin receptor‐deficient mice heterozygous for myostastin; EDHF, endothelium‐derived hyperpolarizing factor; lean myostatin−/−, myostatin‐null mice heterozygous for leptin receptors; lean, lean dual heterozygotes; l‐NAME, Nω‐nitro‐l‐arginine methyl ester; PE, phenylephrine; PGI2, prostacyclin; SNP, sodium nitroprusside.
Figure 8.
Figure 8.
Myostatin has no direct effect on vasculature. A through D, Myostatin incubation has no effect on vasodilation in mesenteric arteries of all genotypes. Concentration‐response curves to acetylcholine were performed in mesenteric arteries from lean, lean myostatin−/−, db/db, and db/db myostatin−/− mice in the absence (■) or in the presence (◊) of myostatin (20 ng/mL for 30 minutes). E, Myostatin mRNA expression in mesenteric artery of all 4 genotypes. F, AcvRIIB mRNA expression in mesenteric artery of all 4 genotypes. Data are shown as mean±SEM (A through D: n=3 to 8; E and F: n=6). db/db myostatin−/− indicates mice lacking both myostatin and leptin receptor; db/db, obese leptin receptor‐deficient mice heterozygous for myostastin; lean myostatin−/−, myostatin‐null mice heterozygous for leptin receptors; lean, lean dual heterozygotes.
Figure 9.
Figure 9.
eNOS expression in db/db mice was not decreased, compared to lean mice. A, Representative blot of phosphorylation of eNOS at Ser1177 and eNOS expression in mesenteric arteries. B and C, Quantification of eNOS (normalized to GAPDH) and phosphorylation of eNOS (normalized to total NOS) protein expression. Results are presented as mean±SEM. A through C, n>6; *P<0.05, db/db versus db/db myostatin−/−; ##P<0.01, lean versus db/db. db/db myostatin−/− indicates mice lacking both myostatin and leptin receptor; db/db, obese leptin receptor‐deficient mice heterozygous for myostastin; eNOS, endothelial nitric oxide synthase; lean myostatin−/−, myostatin‐null mice heterozygous for leptin receptors; lean, lean dual heterozygotes.
Figure 10.
Figure 10.
Elevated oxidant load in the endothelium of obese db/db mice is reduced with increases in muscle mass. A, Superoxide scavenging by Tempol produced an improvement of acetylcholine‐induced dilation in obese mice. *P<0.05, in the absence of Tempol (−) versus in the presence of Tempol (+). B, Oxidized DNA marker 8‐OHG is elevated in the endothelium of obese db/db mice and reduced by deletion of myostatin. The data are given as the mean±SEM (A and B: n=6 to 8). 8‐OHG indicates 8‐hydroxyguanosine; DAPI, 4’,6‐diamidino‐2‐phenylindole; db/db myostatin−/−, mice lacking both myostatin and leptin receptor; db/db, obese leptin receptor‐deficient mice heterozygous for myostastin; lean myostatin−/−, myostatin‐null mice heterozygous for leptin receptors; lean, lean dual heterozygotes.
Figure 11.
Figure 11.
NADPH oxidase 1 expression and NADPH oxidase 1 inhibition improved vasodilation in obese mice. A, Representative blot of expression of NOX 1 in mesenteric arteries determined by Western blot with Hsp90 was used as a loading control. B, Quantification of NOX1 protein expression by 1‐way ANOVA. C, Confocal microscopy assessed localization of NOX1 in mesenteric arteries. D, Inhibition of NOX by GKT136901 restored impaired vasodilation in db/db mice. B, *P<0.05, lean versus lean myostatin−/− or db/db versus db/db myostatin−/−; #P<0.05, lean versus db/db or lean myostatin−/− versus db/db myostatin−/−. D, ***P<0.001, Vessels incubated with GKT 136901 versus vessels incubated without GKT136901. The data are given as the mean±SEM (A through D: n=6 to 8). ANOVA indicates analysis of variance; db/db myostatin−/−, mice lacking both myostatin and leptin receptor; db/db, obese leptin receptor‐deficient mice heterozygous for myostastin; lean myostatin−/−, myostatin‐null mice heterozygous for leptin receptors; lean, lean dual heterozygotes; NADPH, nicotinamide adenine dinucleotide phosphate; NOX, NADPH oxidase 1.
Figure 12.
Figure 12.
BH4 supplementation or superoxide scavenging improved vasodilation in obese mice. A, BH4 precursor sepiapterin preincubation improved acetylcholine‐induced dilation in obese mice. This improvement was blocked by l‐NAME. B, DHFR mRNA expression in mesenteric artery. C, GCH1 mRNA expression in mesenteric artery. Relative gene expression levels were quantified using the 2‐ΔΔCt approximation method. Gene expression was normalized twice to a control sample that was additionally normalized to GAPDH. The data are given as the mean±SEM. A through C, n≥6. #P<0.05, vessels incubated with versus without sepiapterin; *P<0.05; **P<0.01, vessels incubated with sepiapterin versus vessels incubated sepiapterin and l‐NAME. BH4 indicates tetrahydrobiopterin; db/db myostatin−/−, mice lacking both myostatin and leptin receptor; db/db, obese leptin receptor‐deficient mice heterozygous for myostastin; DHFR, dihydrofolate reductase; GCH1, GTP cyclohydrolase I; lean myostatin−/−, myostatin‐null mice heterozygous for leptin receptors; lean, lean dual heterozygotes; l‐NAME, Nω‐nitro‐l‐arginine methyl ester.
Figure 13.
Figure 13.
Passive mechanical data of all 4 groups of mice. Circumferential wall stress and circumferential wall strain were similar in all genotypes. Data are shown as mean±SEM (n>8). db/db myostatin−/− indicates mice lacking both myostatin and leptin receptor; db/db, obese leptin receptor‐deficient mice heterozygous for myostastin; lean myostatin−/−, myostatin‐null mice heterozygous for leptin receptors; lean, lean dual heterozygotes.

References

    1. Odegaard JI, Chawla A. Pleiotropic actions of insulin resistance and inflammation in metabolic homeostasis. Science. 2013; 339:172-177. - PMC - PubMed
    1. Romeo GR, Lee J, Shoelson SE. Metabolic syndrome, insulin resistance, and roles of inflammation–mechanisms and therapeutic targets. Arterioscler Thromb Vasc Biol. 2012; 32:1771-1776. - PMC - PubMed
    1. Odegaard JI, Chawla A. Mechanisms of macrophage activation in obesity‐induced insulin resistance. Nat Clin Pract Endocrinol Metab. 2008; 4:619-626. - PMC - PubMed
    1. Kolka CM, Bergman RN. The endothelium in diabetes: its role in insulin access and diabetic complications. Rev Endocr Metab Disord. 2013; 14:13-19. - PMC - PubMed
    1. Virdis A, Neves MF, Duranti E, Bernini G, Taddei S. Microvascular endothelial dysfunction in obesity and hypertension. Curr Pharm Des. 2013; 19:2382-2389. - PubMed

Publication types

MeSH terms