

Patient dose management solution directly integrated in the RIS: "Gray Detector" software
- PMID: 24965275
- PMCID: PMC4391074
- DOI: 10.1007/s10278-014-9715-y
Patient dose management solution directly integrated in the RIS: "Gray Detector" software
Abstract
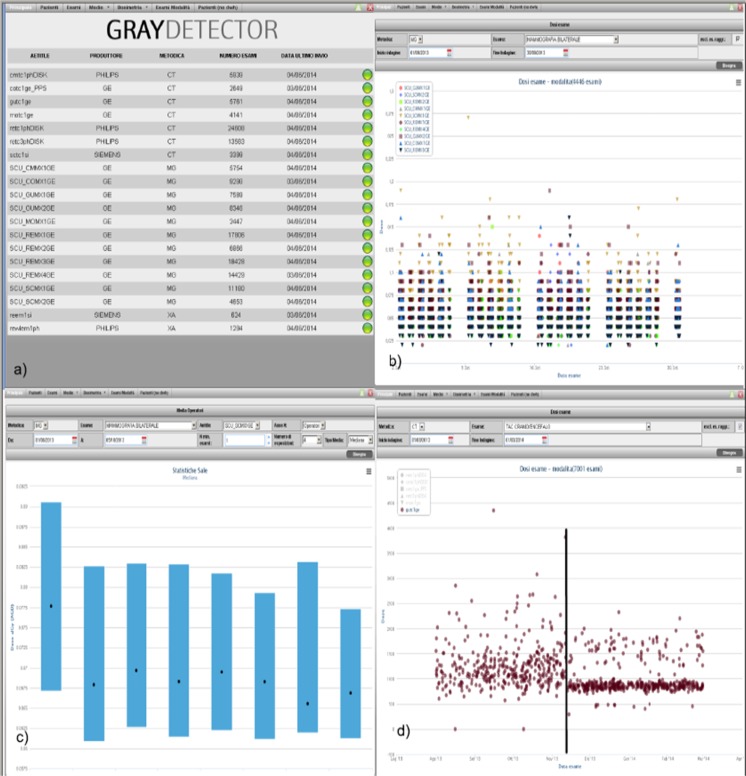
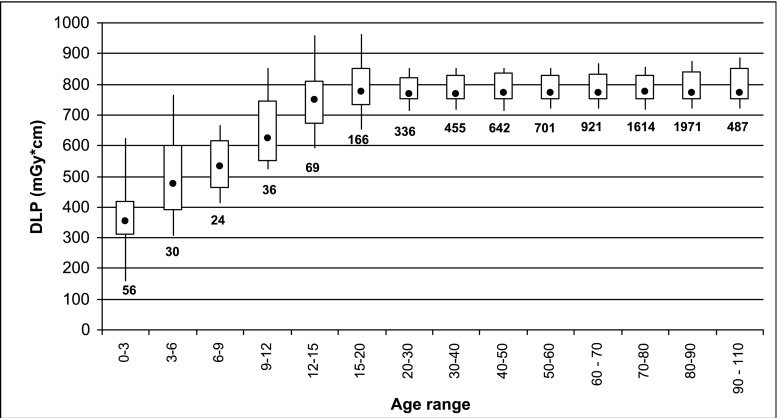
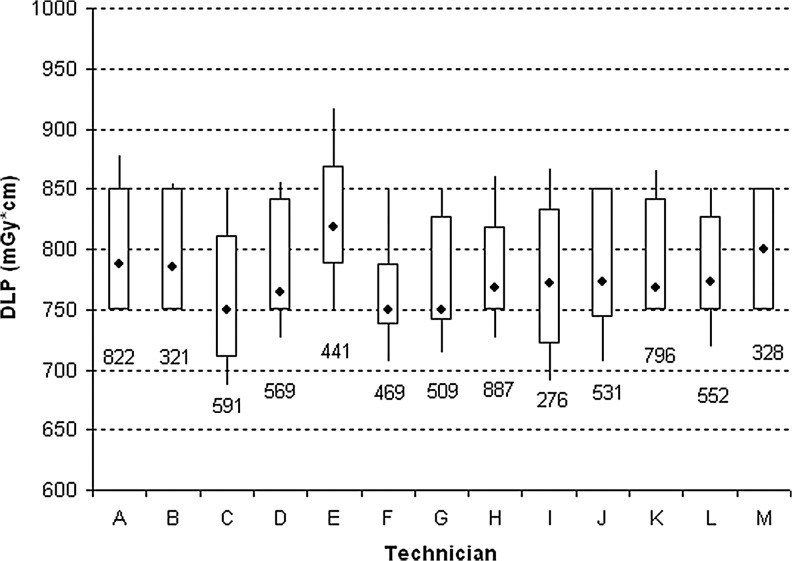
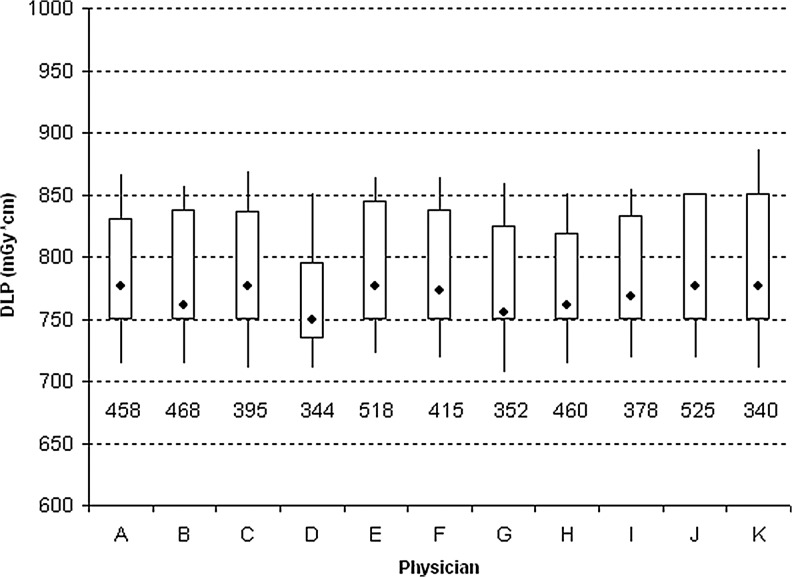
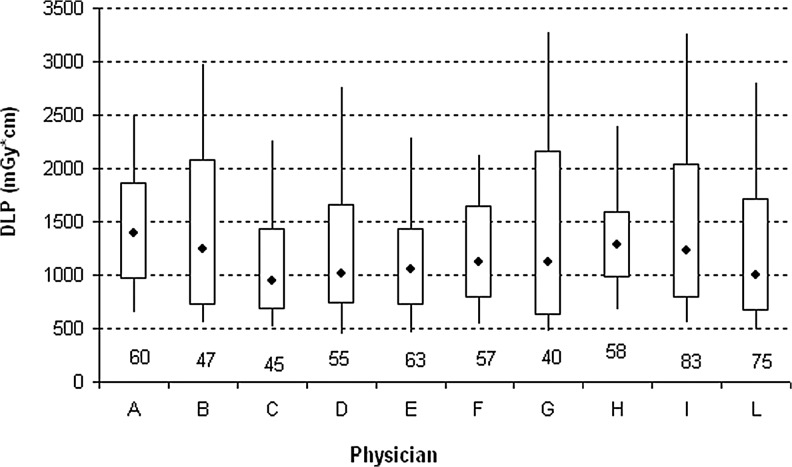
On X-ray modalities, the information concerning the dose delivered to the patient is usually available in image headers or in structured reports stored in the picture archiving and communication system (PACS). Sometimes this information is sent in the Modality Performed Procedure Step message. By saving the information inside the Radiological Information System, it can be linked to the patient and to his/her episode/request. A software, "Gray Detector," implementing different and complementary extraction methods was developed. Query/retrieve on images header, Modality Performed Procedure Step message analysis, or the combination of the two methods were used. In order to avoid erroneous dose-protocol association, every accession number is linked to its unique report code, allowing multiple-protocols exam recognition. The adoption of different methods to extract dosimetric information makes it possible to integrate any kind of modality in a vendor/version neutral way. Linking the dosimetric information received from a modality to the patient and to the unique report code solves, for example, common problems in computed tomography exams, where the dosimetric value related to multiple segments/studies on the modality can be associated by the technician who performs the exam only to one accession number corresponding to a single study/segment. Analyses of dosimetric indexes' dependence on modality type, patient age, technician, and radiologist were performed. Linking dosimetric information to radiological information system data allows a contextualization of the former and helps to optimize the image-quality/dose ratio, thereby making it possible to take a clinical decision that is "patient-centered."
Figures
Similar articles
-
A generic digital imaging and communications in medicine solution for a bidirectional interface between the modality and the radiology information system.J Digit Imaging. 1999 May;12(2 Suppl 1):93-5. doi: 10.1007/BF03168767. J Digit Imaging. 1999. PMID: 10342178 Free PMC article.
-
HIS/RIS/PACS integration: getting to the gold standard.Radiol Manage. 2004 May-Jun;26(3):16-24; quiz 25-7. Radiol Manage. 2004. PMID: 15259683
-
Interfacing the radiology information system to the modality: an integrated approach.J Digit Imaging. 1999 May;12(2 Suppl 1):91-2. doi: 10.1007/BF03168766. J Digit Imaging. 1999. PMID: 10342177 Free PMC article.
-
Integrating HIS-RIS-PACS: the Freiburg experience.Eur Radiol. 1998;8(9):1707-18. doi: 10.1007/s003300050617. Eur Radiol. 1998. PMID: 9866792 Review.
-
Picture archiving and communication system--Part one: Filmless radiology and distance radiology.JBR-BTR. 2004 Sep-Oct;87(5):234-41. JBR-BTR. 2004. PMID: 15587562 Review.
Cited by
-
Evaluation of the Patient Effective Dose in Whole Spine Scanography Based on the Automatic Image Pasting Method for Digital Radiography.Iran J Radiol. 2016 Jan 23;13(1):e22514. doi: 10.5812/iranjradiol.22514. eCollection 2016 Jan. Iran J Radiol. 2016. PMID: 27110338 Free PMC article.
-
Application of Radiomics for Personalized Treatment of Cancer Patients.Cancer Manag Res. 2019 Dec 30;11:10851-10858. doi: 10.2147/CMAR.S232473. eCollection 2019. Cancer Manag Res. 2019. PMID: 31920394 Free PMC article. Review.
-
Detection of unwarranted CT radiation exposure from patient and imaging protocol meta-data using regularized regression.Eur J Radiol Open. 2019 Jun 5;6:206-211. doi: 10.1016/j.ejro.2019.04.007. eCollection 2019. Eur J Radiol Open. 2019. PMID: 31194104 Free PMC article.
-
Estimates of Patient Radiation Doses in Digital Radiography Using DICOM Information at a Large Teaching Hospital in Oman.J Digit Imaging. 2020 Feb;33(1):64-70. doi: 10.1007/s10278-019-00199-y. J Digit Imaging. 2020. PMID: 30891650 Free PMC article.
References
-
- David G, Redden AE. Retrospective analysis of computed radiography exposure reporting. Radiol Technol. 2011;83(1):29–35. - PubMed
MeSH terms
LinkOut - more resources
Full Text Sources
Other Literature Sources
