. 2014 Jul 15;111(28):E2875-84.
doi: 10.1073/pnas.1409644111. Epub 2014 Jun 25.

Oligotyping analysis of the human oral microbiome

Affiliations

Oligotyping analysis of the human oral microbiome

A Murat Eren et al. Proc Natl Acad Sci U S A. .

Abstract

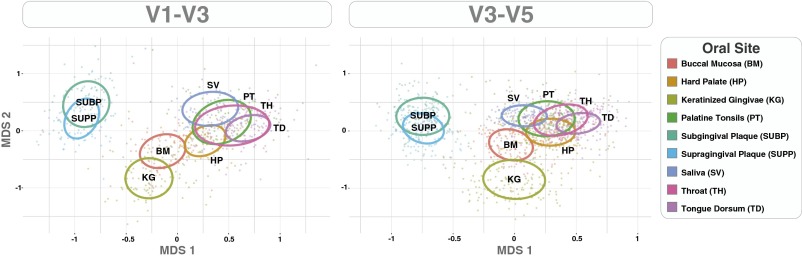
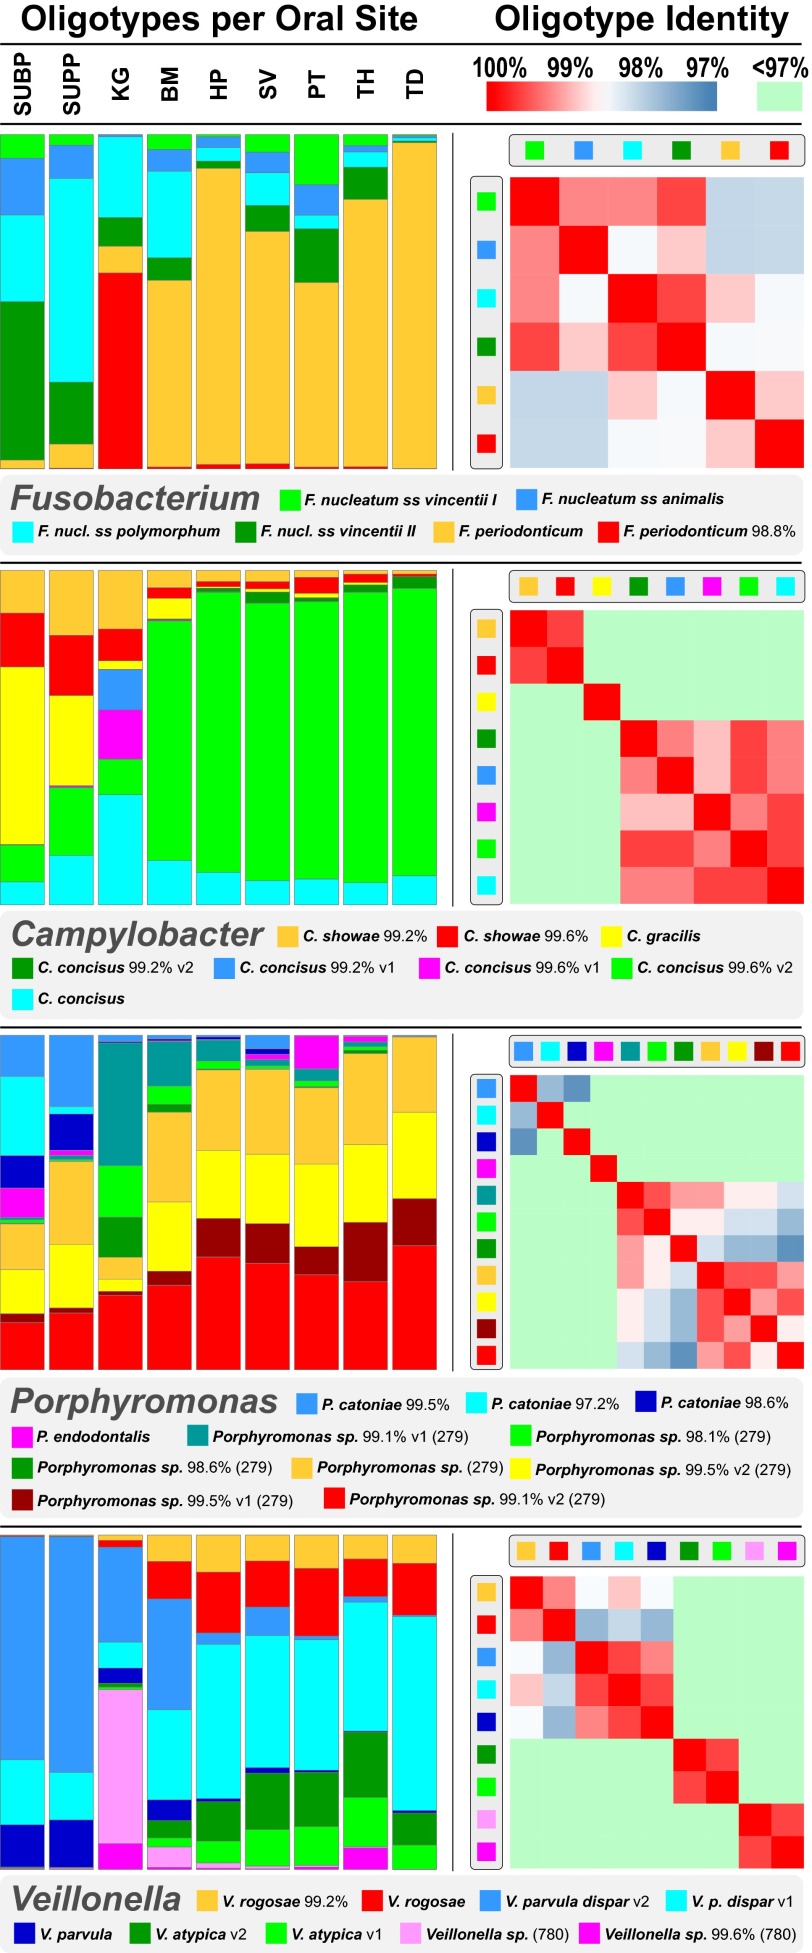
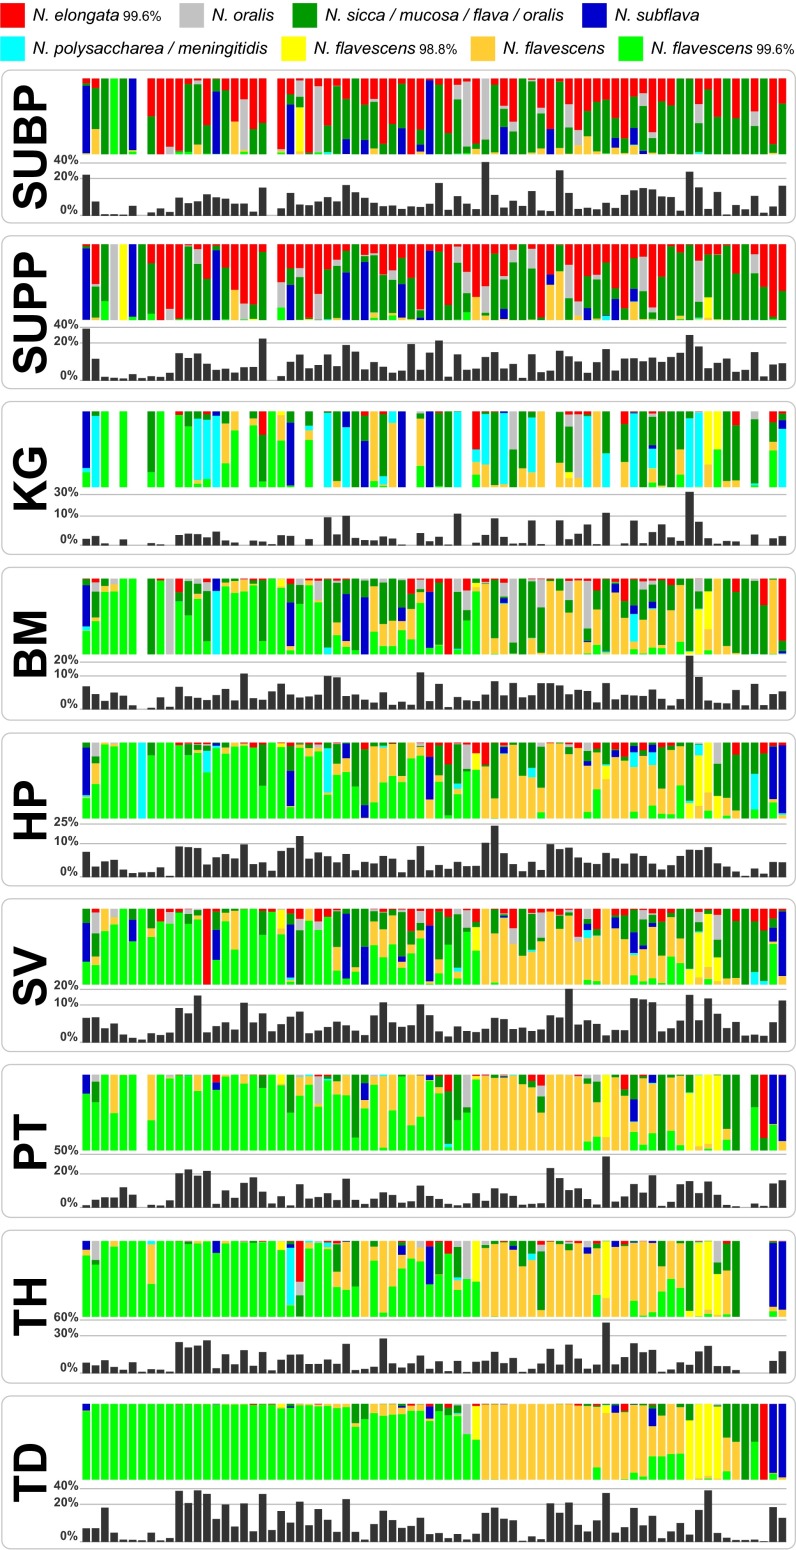
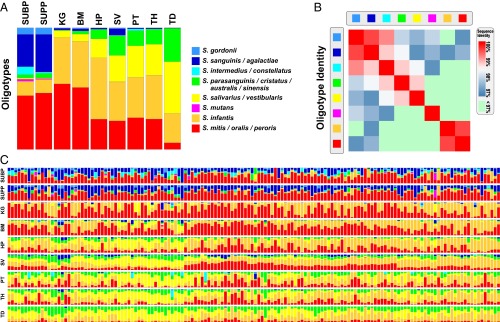
The Human Microbiome Project provided a census of bacterial populations in healthy individuals, but an understanding of the biomedical significance of this census has been hindered by limited taxonomic resolution. A high-resolution method termed oligotyping overcomes this limitation by evaluating individual nucleotide positions using Shannon entropy to identify the most information-rich nucleotide positions, which then define oligotypes. We have applied this method to comprehensively analyze the oral microbiome. Using Human Microbiome Project 16S rRNA gene sequence data for the nine sites in the oral cavity, we identified 493 oligotypes from the V1-V3 data and 360 oligotypes from the V3-V5 data. We associated these oligotypes with species-level taxon names by comparison with the Human Oral Microbiome Database. We discovered closely related oligotypes, differing sometimes by as little as a single nucleotide, that showed dramatically different distributions among oral sites and among individuals. We also detected potentially pathogenic taxa in high abundance in individual samples. Numerous oligotypes were preferentially located in plaque, others in keratinized gingiva or buccal mucosa, and some oligotypes were characteristic of habitat groupings such as throat, tonsils, tongue dorsum, hard palate, and saliva. The differing habitat distributions of closely related oligotypes suggest a level of ecological and functional biodiversity not previously recognized. We conclude that the Shannon entropy approach of oligotyping has the capacity to analyze entire microbiomes, discriminate between closely related but distinct taxa and, in combination with habitat analysis, provide deep insight into the microbial communities in health and disease.

Keywords: biogeography; microbiota; mouth.


Conflict of interest statement

The authors declare no conflict of interest.

Figures

Fig. 1.
Fig. 1.
MDS plots showing the distribution of oral samples based on oligotype relative abundance in each sample. Each dot represents an oral sample colored by sampling site. The centroid of each ellipse represents the group mean, and the shape is defined by the covariance within each group (Materials and Methods).
Fig. 2.
Fig. 2.
Abundant oligotypes of the genus Neisseria. Colored bars (Left) show the relative abundance of Neisseria oligotypes averaged across all individuals at each body site in V3-V5 (A) and V1-V3 (B). Heat map representation (Right) shows the percent nucleotide identity between each pair of oligotypes. For simplicity, only oligotypes with at least 0.5% mean abundance in at least one oral site are shown. The species names shown for oligotypes are the names of the identical sequence(s) in HOMD, or, for oligotypes not identical to any HOMD sequence, the names of the closest match sequence(s) followed by the percent identity to that match.
Fig. 3.
Fig. 3.
Abundant oligotypes of four oral genera showing habitat differentiation. Colored bars (Left) show the relative abundance of oligotypes of four oral genera in the V1-V3 data, averaged across individuals and shown for each sampling site. For simplicity, only oligotypes with a mean abundance of at least 0.5% (Fusobacterium, Veillonella), 0.2% (Porphyromonas), or 0.1% (Campylobacter) in at least one oral site are shown. Species names shown for oligotypes are the names of the identical sequence(s) in HOMD, or, for oligotypes not identical to any HOMD sequence, the names of the closest match sequence(s) followed by the percent identity to that match. Unnamed taxa with only a HOT designation are listed only when no named taxon is an exact or closest match; the HOT number is shown in parentheses. Heat maps (Right) show the percent nucleotide identity between each pair of oligotypes within a genus. Some oligotypes share the same name, followed by v1 or v2, because of the presence in HOMD of more than one reference sequence for these species.
Fig. 4.
Fig. 4.
Distribution of Neisseria oligotypes in individual samples. Proportions of eight abundant Neisseria oligotypes are shown for all individuals in whom at least one of these oligotypes was detected in the V1-V3 TD sample. Colored bars show the relative proportions of each of the eight oligotypes in an individual. Black bars underneath the colored bars show the total abundance of the eight oligotypes relative to the total sample from that individual at that site (e.g., Neisseria ranged from <1–40% of the TD community in these individuals). All of the samples from a given volunteer are arranged in the same column, so that samples can be compared across sampling sites within an individual. The order of columns is defined by the clustering of TD samples with the Morisita-Horn dissimilarity index.
Fig. 5.
Fig. 5.
Distribution of Streptococcus oligotypes in individual samples. (A) Relative abundance of eight Streptococcus oligotypes in V3-V5 at each sampling site, averaged across all volunteers. For simplicity, only oligotypes that exactly matched an HOMD Streptococcus reference sequence and had at least 0.2% mean abundance in at least one oral site are shown. Species names shown for oligotypes are the names of the identical named sequence(s) in HOMD; some of these oligotypes are also identical to additional unnamed taxa with only a HOT designation (listed in Dataset S2). (B) Heat map representation showing the percent nucleotide identity between each pair of oligotypes. (C) Volunteers each represented as a column showing the relative contribution of each oligotype to the Streptococcus community at each of the 9 oral sites in each volunteer. The order of columns is defined by the clustering of SV samples with the Morisita-Horn dissimilarity index.
Fig. 6.
Fig. 6.
Correlation of oligotype abundance in SUBP and PT. (Left) Correlation between the mean relative abundance in SUBP and in PT for oligotypes detected preferentially in SUBP [44 oligotypes that are plaque-associated (P < 0.01) and threefold more abundant in SUBP than in SUPP]; (Right) correlation between the mean relative abundance in SUPP and PT for oligotypes detected preferentially in SUPP [37 oligotypes that are plaque-associated (P < 0.01) and 1.5-fold more abundant in SUPP than in SUBP]. Linear regression shows a significant correlation between the mean relative abundance in SUBP of SUBP-preferred oligotypes and their mean relative abundance in PT (P < 0.0001), which suggests a strong co-occurrence pattern between the two sites. The mean relative abundances in SUPP and PT for SUPP-preferred oligotypes were less strongly correlated. The SUBP oligotypes correspond to primarily anaerobic and potentially pathogenic taxa. SUBP and SUPP-preferred oligotypes are listed in Dataset S5.

References

    1. Dewhirst FE, et al. The human oral microbiome. J Bacteriol. 2010;192(19):5002–5017. - PMC - PubMed
    1. Aas JA, Paster BJ, Stokes LN, Olsen I, Dewhirst FE. Defining the normal bacterial flora of the oral cavity. Journal of Clinical Microbiology. 2005;43(11):5721–5732. - PMC - PubMed
    1. Bik EM, et al. Bacterial diversity in the oral cavity of 10 healthy individuals. ISME J. 2010;4(8):962–974. - PMC - PubMed
    1. Keijser BJF, et al. Pyrosequencing analysis of the oral microflora of healthy adults. J Dent Res. 2008;87(11):1016–1020. - PubMed
    1. Zaura E, Keijser BJF, Huse SM, Crielaard W. Defining the healthy “core microbiome” of oral microbial communities. BMC Microbiol. 2009;9:259. - PMC - PubMed

Publication types