. 2014 Jul 8;111(27):9768-73.
doi: 10.1073/pnas.1404753111. Epub 2014 Jun 25.

Gene-targeted microfluidic cultivation validated by isolation of a gut bacterium listed in Human Microbiome Project's Most Wanted taxa

Affiliations

Gene-targeted microfluidic cultivation validated by isolation of a gut bacterium listed in Human Microbiome Project's Most Wanted taxa

Liang Ma et al. Proc Natl Acad Sci U S A. .

Abstract

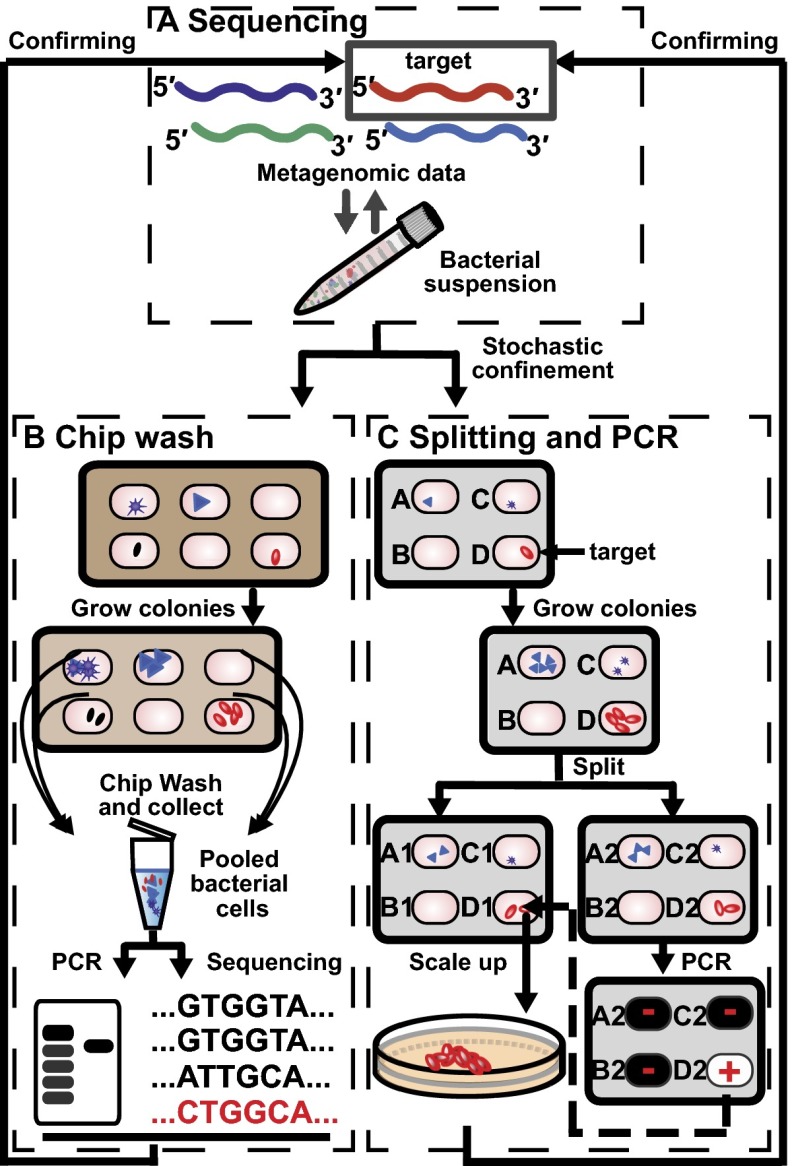
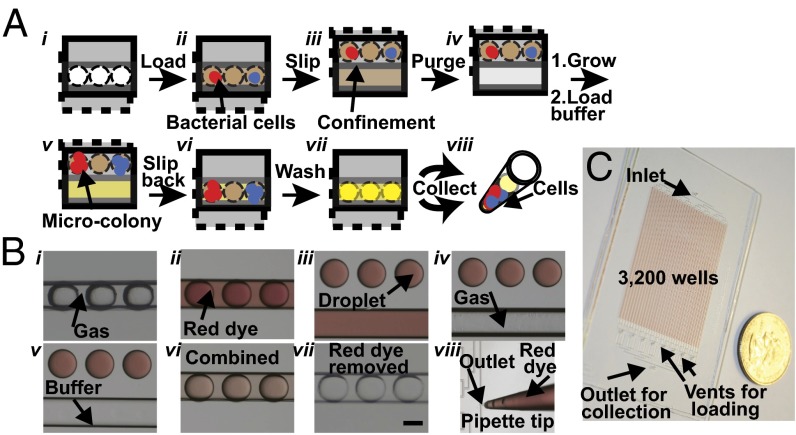
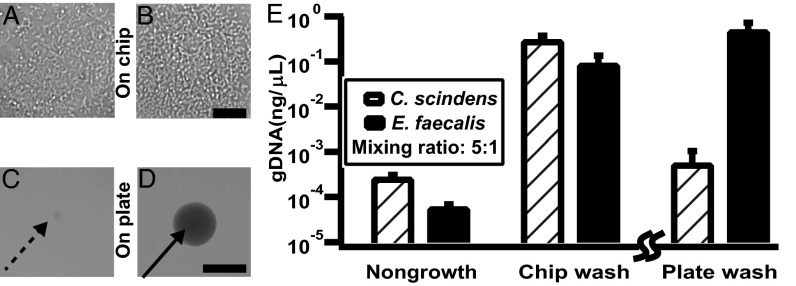
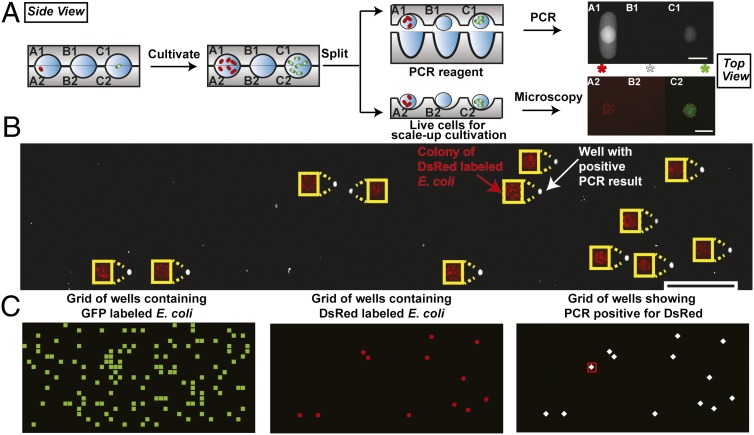
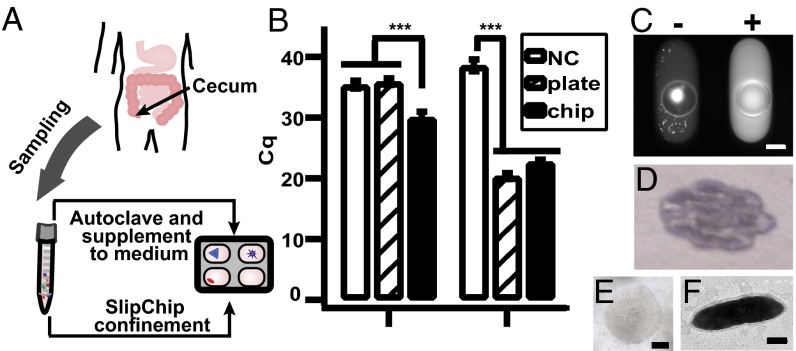
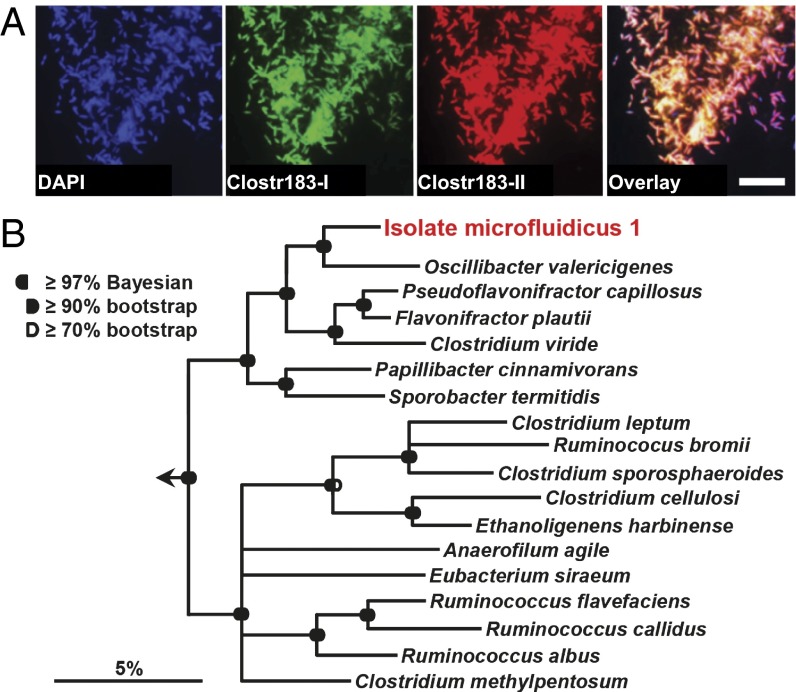
This paper describes a microfluidics-based workflow for genetically targeted isolation and cultivation of microorganisms from complex clinical samples. Data sets from high-throughput sequencing suggest the existence of previously unidentified bacterial taxa and functional genes with high biomedical importance. Obtaining isolates of these targets, preferably in pure cultures, is crucial for advancing understanding of microbial genetics and physiology and enabling physical access to microbes for further applications. However, the majority of microbes have not been cultured, due in part to the difficulties of both identifying proper growth conditions and characterizing and isolating each species. We describe a method that enables genetically targeted cultivation of microorganisms through a combination of microfluidics and on- and off-chip assays. This method involves (i) identification of cultivation conditions for microbes using growth substrates available only in small quantities as well as the correction of sampling bias using a "chip wash" technique; and (ii) performing on-chip genetic assays while also preserving live bacterial cells for subsequent scale-up cultivation of desired microbes, by applying recently developed technology to create arrays of individually addressable replica microbial cultures. We validated this targeted approach by cultivating a bacterium, here referred to as isolate microfluidicus 1, from a human cecal biopsy. Isolate microfluidicus 1 is, to our knowledge, the first successful example of targeted cultivation of a microorganism from the high-priority group of the Human Microbiome Project's "Most Wanted" list, and, to our knowledge, the first cultured representative of a previously unidentified genus of the Ruminococcaceae family.

Keywords: aerobe; anaerobe; cultivate; metagenome; microscale.


Conflict of interest statement

Conflict of interest statement: R.F.I. has a financial interest in SlipChip Corporation.

Figures

Fig. 1.
Fig. 1.
Illustration representing the workflow for targeted cultivation and isolation of microbial organisms. (A) Microbial targets carrying genes of interest are identified by high-throughput sequencing of clinical samples. A representative sequence of the target is shown in red. To cultivate the target, the inoculum is suspended in cultivation medium and loaded onto a microfluidic device, enabling stochastic confinement of single cells and cultivation of individual species (represented by different shapes). (B) A chip wash method is used to monitor bacterial growth under different cultivation conditions. Cells are pooled en masse into a tube and DNA is extracted for genetic analysis such as sequencing and PCR. (C) The target can be isolated by growing the sample under the growth condition identified from the chip wash. The two halves of the device are separated, resulting in two copies of each colony. On one half of the chip, target colonies are identified using PCR. Then, the target colony on the other half of the chip is retrieved for a scale-up culture, after which sequencing is used to validate that the correct target has been isolated.
Fig. 2.
Fig. 2.
Design and operation of the chip wash device. (A) Schematic drawings of the chip wash method illustrating device design for handling microbial cells. (B) Representative photographs showing device operation as visualized with red dye. See text for details. Scale bar in ivii, 200 µm. (C) Photograph of 3,200 droplets generated and stored on the chip for chip wash, shown next to a US quarter.
Fig. 3.
Fig. 3.
Validation of the chip wash method with a model community of C. scindens and E. faecalis. Samples were collected on day 1. (A and B) Representative optical microscopy of C. scindens (A) and E. faecalis (B) grown on SlipChip. (C and D) Representative photographs of C. scindens (C) and E. faecalis (D) grown on an agar plate. (E) Graph showing genomic DNA of C. scindens and E. faecalis recovered from nongrowth negative control, chip wash, and plate wash solutions. The nongrowth control and the chip wash experiments were performed using an identical procedure and can be directly compared. Because the plate wash experiment requires a different protocol, only the relative values can be compared (emphasized by the break in the axis). Error bars indicate SD (n = 3). Scale bar, 30 μm for A and B and 1 mm for C and D.
Fig. 4.
Fig. 4.
Cultivating pure microcolonies from a mixture and using PCR to identify specific microcolonies. Schematics show side views, whereas photographs show top views. (A) Schematic illustrating the cultivation of single cells from a mixture of E. coli expressing GFP and DsRed genes, as well as a method for splitting individual colonies. PCR was used to identify the E. coli expressing DsRed gene on one half of the split chip. The PCR reagents wells have an ellipsoidal cross-section from top view. An increase in fluorescence intensity indicated a positive result for PCR, and thus, the presence of the DsRed gene. Fluorescence microscopy identified wells that contained microbes expressing red and green fluorescent proteins, matching corresponding results in PCR. (B) To test the accuracy of the PCR assay, results from microscopy imaging (red), indicating E. coli colonies expressing DsRed gene, and PCR assay (white) were montaged with an offset to allow visualization without overlap. (C) Plot of a 20 × 50-well grid was used to represent the position of each well on the same device. Elements corresponding to wells were colored to highlight the presence of E. coli GFP colonies (green squares), E. coli DsRed colonies (red dots), and PCR positive results for DsRed (white diamonds). A red square in the third plot denotes a false positive result from PCR. The different shapes of markers used in C do not represent the shapes of wells. Scale bar, 200 µm for A, 2 mm for B. A 200-µm-wide yellow rectangle was used as scale bar for images showing DsRed expressing E. coli colonies in B. Note: schematics are not to scale; dimensions are provided in SI Appendix.
Fig. 5.
Fig. 5.
Targeted isolation of isolate microfluidicus 1 from SlipChip. (A) Illustration showing that mucosal biopsies obtained from the human cecum were used for stochastic confinement as well as supplemented into the medium to stimulate growth of microbes. (B) Identifying the cultivation condition of the microbial target OTU158 using qPCR. (Left) Graph showing that the use of target-specific primers revealed that the target was found in the chip wash solution (M2LC) but not in the blank negative control (NC) or the plate wash solution (M2GSC). (Right) Graph showing that the use of universal primers of 16S rRNA gene showed that both chip wash and plate wash solutions contained bacterial genomic DNA. A lower Cq value indicates higher concentration of DNA. Error bars indicate SD (n = 3). (C) Fluorescence microscopy photograph of on-chip colony PCR after the chip was split, showing a positive well (Right) for OTU158. A PCR negative well is shown on the left, as indicated by the low fluorescence intensity of the solution. The bright spot was presumably from cell material stained with SYBR Green. (D) Photograph of the first round of scaled-up culture of OTU158. (E) Microphotograph of a single colony of isolate microfluidicus 1. (F) Transmission electron microscopy image of a single OTU158 cell. Scale bar, 200 µm for C and E, and 0.5 µm for F.
Fig. 6.
Fig. 6.
Phylogenetic affiliation of isolate microfluidicus 1 and validation of the purity of the culture by FISH. (A) Fluorescence images showing that both 16S rRNA types obtained from the culture are expressed within the same cells, demonstrating the presence of a single Ruminococcaceae species within the culture. Clostr183-I and Clostr183-II indicate FISH probes, each specific to a different sequence type. (Scale bar, 10 µm.) (B) 16S rRNA-based consensus tree demonstrating the positioning of isolate microfluidicus 1 within the Ruminococcaceae (Clostridia cluster IV). Please see SI Appendix for details.

References

    1. Schloss PD, Handelsman J. Metagenomics for studying unculturable microorganisms: Cutting the Gordian knot. Genome Biol. 2005;6(8):229. - PMC - PubMed
    1. Fodor AA, et al. The “most wanted” taxa from the human microbiome for whole genome sequencing. PLoS ONE. 2012;7(7):e41294. - PMC - PubMed
    1. Kennedy J, et al. Functional metagenomic strategies for the discovery of novel enzymes and biosurfactants with biotechnological applications from marine ecosystems. J Appl Microbiol. 2011;111(4):787–799. - PubMed
    1. Rooks DJ, McDonald JE, McCarthy AJ. Metagenomic approaches to the discovery of cellulases. Methods Enzymol. 2012;510:375–394. - PubMed
    1. Reddy BVB, et al. Natural product biosynthetic gene diversity in geographically distinct soil microbiomes. Appl Environ Microbiol. 2012;78(10):3744–3752. - PMC - PubMed

Publication types

Associated data

LinkOut - more resources