. 2014 Sep 1;88(17):10134-45.
doi: 10.1128/JVI.00647-14. Epub 2014 Jun 25.

Predicting the impact of CD8+ T cell polyfunctionality on HIV disease progression

Affiliations

Predicting the impact of CD8+ T cell polyfunctionality on HIV disease progression

Frederik Graw et al. J Virol. .

Abstract

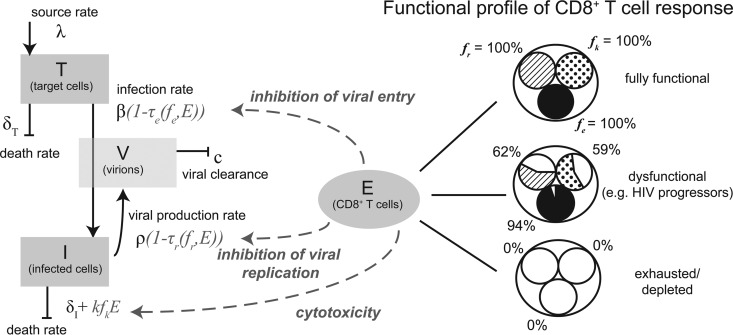
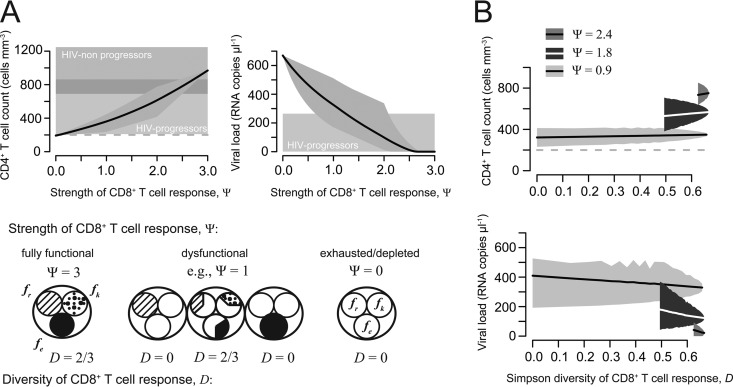
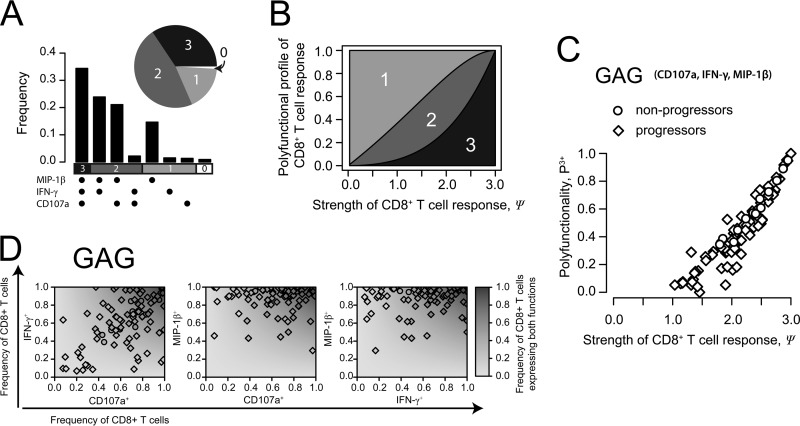
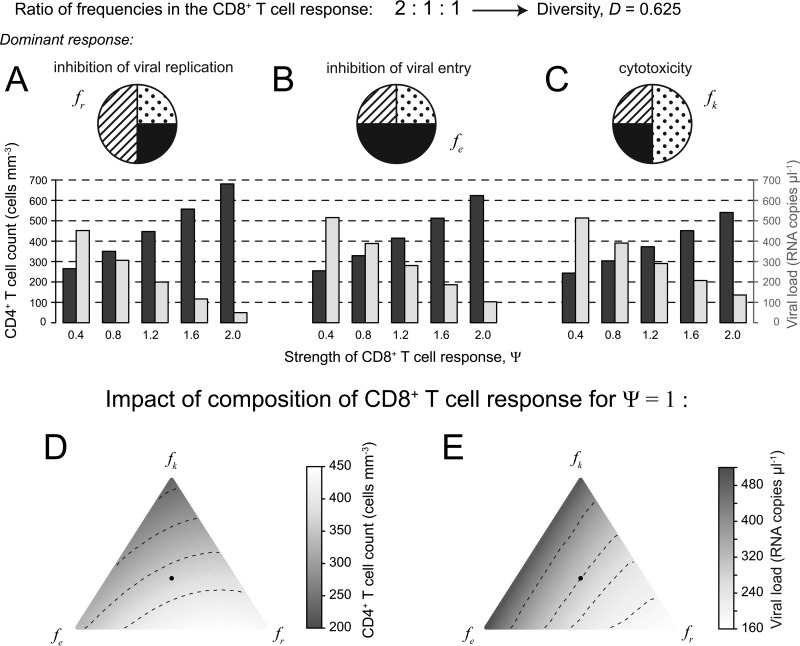
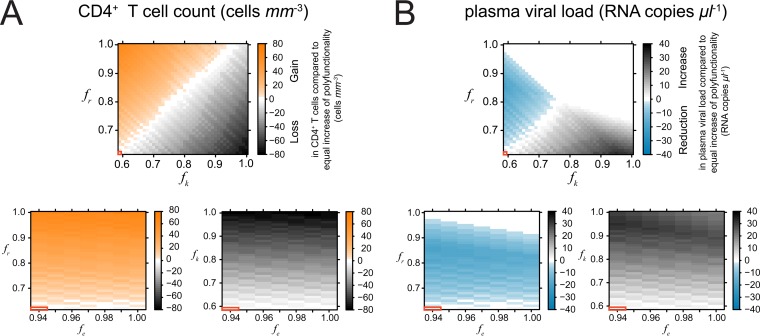
During the chronic phase of HIV-1 infection, polyfunctional CD8+ T cell responses, which are characterized by a high frequency of cells able to secrete multiple cytokines simultaneously, are associated with lower virus loads and slower disease progression. This relationship may arise for different reasons. Polyfunctional responses may simply be stronger. Alternatively, it could be that the increased functional diversity in polyfunctional responses leads to lower virus loads and slower disease progression. Lastly, polyfunctional responses could contain more CD8+ T cells that mediate a specific key function that is primarily responsible for viral control. Disentangling the influences of overall strength, functional diversity, and specific function on viral control and disease progression is very relevant for the rational design of vaccines and immunotherapy using cellular immune responses. We developed a mathematical model to study how polyfunctional CD8+ T cell responses mediating lytic and nonlytic effector functions affect the CD4+ T cell count and plasma viral load. We based our model on in vitro data on the efficacy of gamma interferon (IFN-γ) and macrophage inflammatory protein 1β (MIP-1β)/RANTES against HIV. We find that the strength of the response is a good predictor of disease progression, while functional diversity has only a minor influence. In addition, our model predicts for realistic levels of cytotoxicity that immune responses dominated by nonlytic effector functions most positively influence disease outcome.

Importance: It is an open question in HIV research why polyfunctional CD8+ T cell responses are associated with better viral control, while individual functional correlates of protection have not been identified so far. Identifying the role of CD8+ T cells in HIV-1 infection has important implications for the potential development of effective T cell-based vaccines. Our analysis provides new ways to think about a causative role of CD8+ T cells by studying different hypotheses regarding why polyfunctional CD8+ T cells might be more advantageous. We identify measurements that have to be obtained in order to evaluate the role of CD8+ T cells in HIV-1 infection. In addition, our method shows how individual cell functionality data can be used in population-based virus dynamics models.


Figures

FIG 1
FIG 1
Model of viral and immune dynamics considering target cells (T), infected cells (I), virions (V), and CD8+ T cells (E). The functional profile of the CD8+ T cell response is denoted by the frequencies of CD8+ T cells capable of (i) inhibiting viral entry (fe), (ii) impairing viral replication (fr), and killing infected cells (fk). In a fully functional CD8+ T cell response, all CD8+ T cells would express all different effector functions considered. With a dysfunctional profile, not all effector functions are expressed by all CD8+ T cells. The functional profile of the CD8+ T cell response influences the infection rate (β), the viral production rate (ρ), or the death rate of infected cells by the additional killing term kfkE, respectively, as schematically indicated. A detailed description of the model and the individual parameters is given in Materials and Methods.
FIG 2
FIG 2
Strength and diversity of the CD8+ T cell response. (A) CD4+ T cell count and plasma viral load dependent on the strength of the CD8+ T cell response. The gray-shaded areas indicate the minimum and maximum of all calculated values with the corresponding strength (Ψ); the solid line denotes the mean. The horizontally shaded areas indicate the CD4+ T cell count and plasma viral load, as measured for HIV progressors (light gray) and nonprogressors (dark gray) (Table 2). (B) Relationship between the functional diversity of the CD8+ T cell response measured by the Simpson index (D) for the CD4+ T cell count and plasma viral load. All possible combinations of three different Ψ values, 0.9, 1.8, and 2.4, were analyzed separately. Lines denote the mean CD4+ T cell count and plasma viral load, while shaded areas indicate the minimum and maximum of all calculated values with the corresponding diversity index, D.
FIG 3
FIG 3
Strength and polyfunctionality of the CD8+ T cell response. (A) Estimated functionality profile of the CD8+ T cell response for HIV progressors in terms of multifunctionality of single cells based on the measured frequency of individual effector functions, with an fe value of 0.94, an fk value of 0.59, and an fr value of 0.62. (B) Relationship between the strength of the CD8+ T cell response and the multifunctional profile assuming maximal diversity of the response; i.e., fe = fk = fr. (C) Relationship of the strength and the polyfunctionality of the CD8+ T cell response for each patient described previously (12) shown exemplarily for the gag epitope considering three (CD107a, IFN-γ, and MIP-1β) of the five measured effector functions. (D) For each patient described previously (12), the frequency of CD8+ T cells expressing two of the three functions indicated by CD107a, IFN-γ, and MIP-1β (fab) is plotted against the total frequencies of CD8+ T cells expressing the corresponding specific function, i.e., fa and fb. The gray shaded background indicates the profile of the expected frequency of combined expression under the assumption that the particular effector functions are expressed independently (E[fab] = fa × fb). Observations are shown exemplarily for the gag epitope.
FIG 4
FIG 4
Influence of particular effector functions on CD4+ T cell count and plasma viral load. For the example of a CD8+ T cell response with a frequency ratio of 2:1:1 between the three different effector functions, and corrected for different strengths of the CD8+ T cell response, we show the influence of particular effector functions on the CD4+ T cell count and plasma viral load. (A to C) CD8+ T cell responses with a dominant nonlytic response (A and B) show better maintenance of CD4+ T cell count and better viral control than those responses with a dominant cytotoxic response (C) irrespective of the Ψ value. Inhibition of viral replication suppresses the viral load more efficiently than inhibition of viral entry. (D and E) This hierarchy of effector functions can also be seen when looking at the simplex plots showing the CD4+ T cell count (D) and the plasma viral load (E) dependent on the composition of a CD8+ T cell response with a Ψ value of 1. Lighter colors indicate better disease control. The black dot indicates an immune response where each effector function is equally present; hence, fe = fk = fr = 1/3.
FIG 5
FIG 5
(A) Additional gain (orange) or loss (gray scaling) in the CD4+ T cell count by increasing the frequencies of particular effector functions compared to a situation where the same increase in the strength of the response is equally distributed among all three different effector functions. Positive values indicate that concentrating on this particular effector function would be more beneficial than increasing the polyfunctionality for each effector function equally. White areas indicate no difference. The red framed box indicates the functionality of the CD8+ T cell response observed for HIV progressors (Table 3) with an fe value of 0.94, an fr value of 0.62, and an fk value of 0.59. (B) Corresponding plots for the effect on plasma viral load, with blue indicating a more substantial reduction of the viral load by focusing on the frequency of this particular effector function when increasing the strength of the CD8+ T cell response.

References

    1. Borrow P, Lewicki H, Hahn BH, Shaw GM, Oldstone MB. 1994. Virus-specific CD8+ cytotoxic T-lymphocyte activity associated with control of viremia in primary human immunodeficiency virus type 1 infection. J. Virol. 68:6103–6110 - PMC - PubMed
    1. Koup RA, Safrit JT, Cao Y, Andrews CA, McLeod G, Borkowsky W, Farthing C, Ho DD. 1994. Temporal association of cellular immune responses with the initial control of viremia in primary human immunodeficiency virus type 1 syndrome. J. Virol. 68:4650–4655 - PMC - PubMed
    1. Guidotti LG, Borrow P, Brown A, McClary H, Koch R, Chisari FV. 1999. Noncytopathic clearance of lymphocytic choriomeningitis virus from the hepatocyte. J. Exp. Med. 189:1555–1564. 10.1084/jem.189.10.1555 - DOI - PMC - PubMed
    1. Wherry EJ, Blattman JN, Murali-Krishna K, van der Most R, Ahmed R. 2003. Viral persistence alters CD8 T-cell immunodominance and tissue distribution and results in distinct stages of functional impairment. J. Virol. 77:4911–4927. 10.1128/JVI.77.8.4911-4927.2003 - DOI - PMC - PubMed
    1. Jin X, Bauer DE, Tuttleton SE, Lewin S, Gettie A, Blanchard J, Irwin CE, Safrit JT, Mittler J, Weinberger L, Kostrikis LG, Zhang L, Perelson AS, Ho DD. 1999. Dramatic rise in plasma viremia after CD8+ T cell depletion in simian immunodeficiency virus-infected macaques. J. Exp. Med. 189:991–998. 10.1084/jem.189.6.991 - DOI - PMC - PubMed

Publication types