

Taiwan Y-chromosomal DNA variation and its relationship with Island Southeast Asia
- PMID: 24965575
- PMCID: PMC4083334
- DOI: 10.1186/1471-2156-15-77
Taiwan Y-chromosomal DNA variation and its relationship with Island Southeast Asia
Abstract
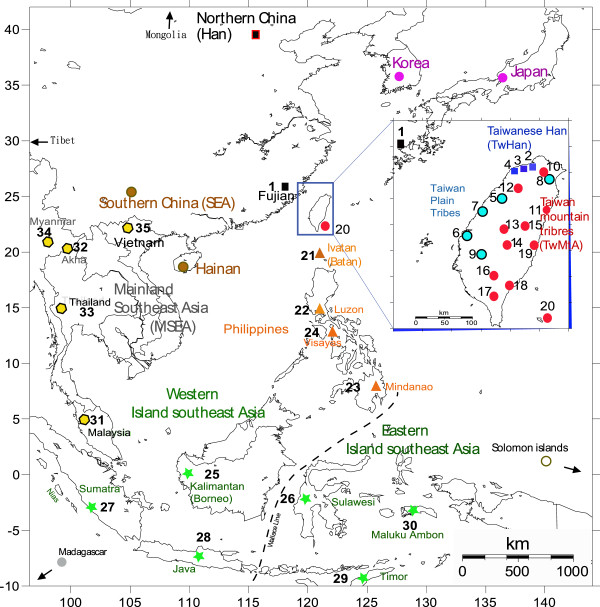
Background: Much of the data resolution of the haploid non-recombining Y chromosome (NRY) haplogroup O in East Asia are still rudimentary and could be an explanatory factor for current debates on the settlement history of Island Southeast Asia (ISEA). Here, 81 slowly evolving markers (mostly SNPs) and 17 Y-chromosomal short tandem repeats were used to achieve higher level molecular resolution. Our aim is to investigate if the distribution of NRY DNA variation in Taiwan and ISEA is consistent with a single pre-Neolithic expansion scenario from Southeast China to all ISEA, or if it better fits an expansion model from Taiwan (the OOT model), or whether a more complex history of settlement and dispersals throughout ISEA should be envisioned.
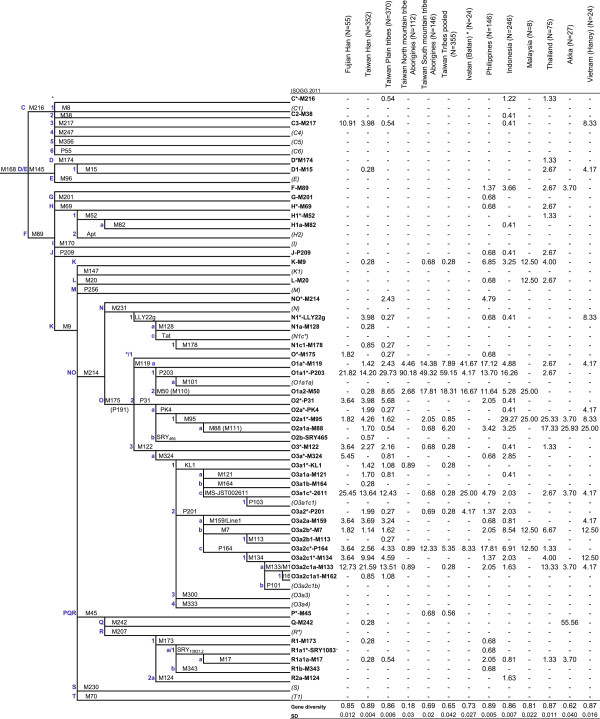
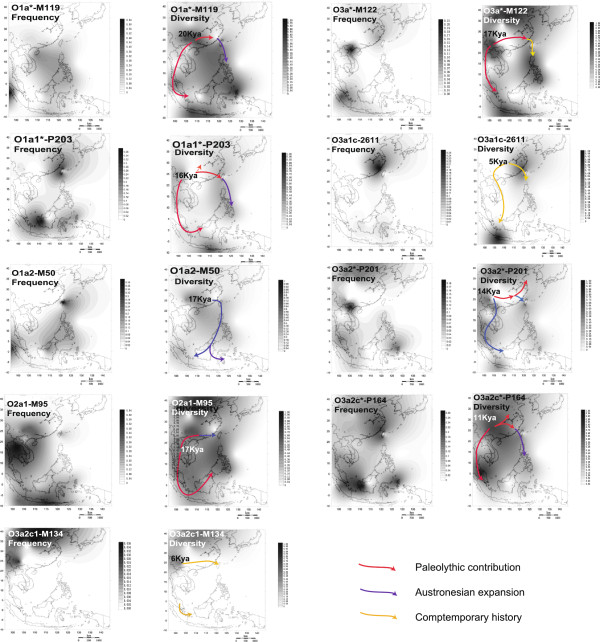
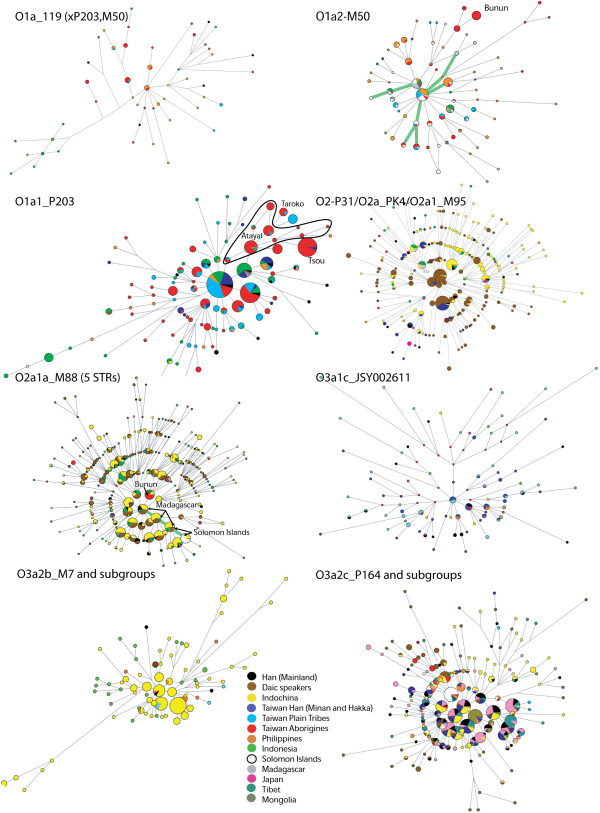
Results: We examined DNA samples from 1658 individuals from Vietnam, Thailand, Fujian, Taiwan (Han, plain tribes and 14 indigenous groups), the Philippines and Indonesia. While haplogroups O1a*-M119, O1a1*-P203, O1a2-M50 and O3a2-P201 follow a decreasing cline from Taiwan towards Western Indonesia, O2a1-M95/M88, O3a*-M324, O3a1c-IMS-JST002611 and O3a2c1a-M133 decline northward from Western Indonesia towards Taiwan. Compared to the Taiwan plain tribe minority groups the Taiwanese Austronesian speaking groups show little genetic paternal contribution from Han. They are also characterized by low Y-chromosome diversity, thus testifying for fast drift in these populations. However, in contrast to data provided from other regions of the genome, Y-chromosome gene diversity in Taiwan mountain tribes significantly increases from North to South.
Conclusion: The geographic distribution and the diversity accumulated in the O1a*-M119, O1a1*-P203, O1a2-M50 and O3a2-P201 haplogroups on one hand, and in the O2a1-M95/M88, O3a*-M324, O3a1c-IMS-JST002611 and O3a2c1a-M133 haplogroups on the other, support a pincer model of dispersals and gene flow from the mainland to the islands which likely started during the late upper Paleolithic, 18,000 to 15,000 years ago. The branches of the pincer contributed separately to the paternal gene pool of the Philippines and conjointly to the gene pools of Madagascar and the Solomon Islands. The North to South increase in diversity found for Taiwanese Austronesian speaking groups contrasts with observations based on mitochondrial DNA, thus hinting to a differentiated demographic history of men and women in these populations.
Figures
Similar articles
-
Major east-west division underlies Y chromosome stratification across Indonesia.Mol Biol Evol. 2010 Aug;27(8):1833-44. doi: 10.1093/molbev/msq063. Epub 2010 Mar 5. Mol Biol Evol. 2010. PMID: 20207712
-
Balinese Y-chromosome perspective on the peopling of Indonesia: genetic contributions from pre-neolithic hunter-gatherers, Austronesian farmers, and Indian traders.Hum Biol. 2005 Feb;77(1):93-114. doi: 10.1353/hub.2005.0030. Hum Biol. 2005. PMID: 16114819
-
Ancient migration routes of Austronesian-speaking populations in oceanic Southeast Asia and Melanesia might mimic the spread of nasopharyngeal carcinoma.Chin J Cancer. 2011 Feb;30(2):96-105. doi: 10.5732/cjc.010.10589. Chin J Cancer. 2011. PMID: 21272441 Free PMC article. Review.
-
Increased Y-chromosome resolution of haplogroup O suggests genetic ties between the Ami aborigines of Taiwan and the Polynesian Islands of Samoa and Tonga.Gene. 2012 Jan 25;492(2):339-48. doi: 10.1016/j.gene.2011.10.042. Epub 2011 Nov 3. Gene. 2012. PMID: 22079672
-
Genetic insights into the origin, admixture, and migration of the early Austronesian peoples.J Hum Genet. 2025 Aug 7. doi: 10.1038/s10038-025-01380-8. Online ahead of print. J Hum Genet. 2025. PMID: 40775104 Review.
Cited by
-
Sex-Biased Population Admixture Mediated Subsistence Strategy Transition of Heishuiguo People in Han Dynasty Hexi Corridor.Front Genet. 2022 Mar 10;13:827277. doi: 10.3389/fgene.2022.827277. eCollection 2022. Front Genet. 2022. PMID: 35356424 Free PMC article.
-
The impact of MTHFR 677 C/T genotypes on folate status markers: a meta-analysis of folic acid intervention studies.Eur J Nutr. 2017 Feb;56(1):247-260. doi: 10.1007/s00394-015-1076-x. Epub 2015 Oct 23. Eur J Nutr. 2017. PMID: 26497154
-
Phylogeography of Y-chromosome haplogroup O3a2b2-N6 reveals patrilineal traces of Austronesian populations on the eastern coastal regions of Asia.PLoS One. 2017 Apr 5;12(4):e0175080. doi: 10.1371/journal.pone.0175080. eCollection 2017. PLoS One. 2017. PMID: 28380021 Free PMC article.
-
Genetic Variation of 25 Y-Chromosomal and 15 Autosomal STR Loci in the Han Chinese Population of Liaoning Province, Northeast China.PLoS One. 2016 Aug 2;11(8):e0160415. doi: 10.1371/journal.pone.0160415. eCollection 2016. PLoS One. 2016. PMID: 27483472 Free PMC article.
-
Investigating the origins of eastern Polynesians using genome-wide data from the Leeward Society Isles.Sci Rep. 2018 Jan 29;8(1):1823. doi: 10.1038/s41598-018-20026-8. Sci Rep. 2018. PMID: 29379068 Free PMC article.
References
-
- Chiung WVT. Language attitudes toward written Taiwanese. J Multiling Multicult Devel. 2001;22:502–523.
-
- Murdock GP. Genetic classification of the austronesian languages: a key to oceanic culture history. Ethnology. 1964;3:117–126.
-
- Blust R. The prehistory of the Austronesian-speaking peoples: the view from language. J World Prehistory. 1995;9:453–510.
-
- Bellwood P. Prehistory of the Indo-Malaysian Archipelago. Honolulu: HI: University of Hawaii Press; 1997.
-
- Diamond J, Bellwood P. Farmers and their languages: the first expansions. Science. 2003;300:597–603. - PubMed
Publication types
MeSH terms
LinkOut - more resources
Full Text Sources
Other Literature Sources
