. 2014 Nov 1;307(9):C791-813.
doi: 10.1152/ajpcell.00051.2014. Epub 2014 Jun 25.

Evidence from simultaneous intracellular- and surface-pH transients that carbonic anhydrase II enhances CO2 fluxes across Xenopus oocyte plasma membranes

Affiliations

Evidence from simultaneous intracellular- and surface-pH transients that carbonic anhydrase II enhances CO2 fluxes across Xenopus oocyte plasma membranes

Raif Musa-Aziz et al. Am J Physiol Cell Physiol. .

Abstract

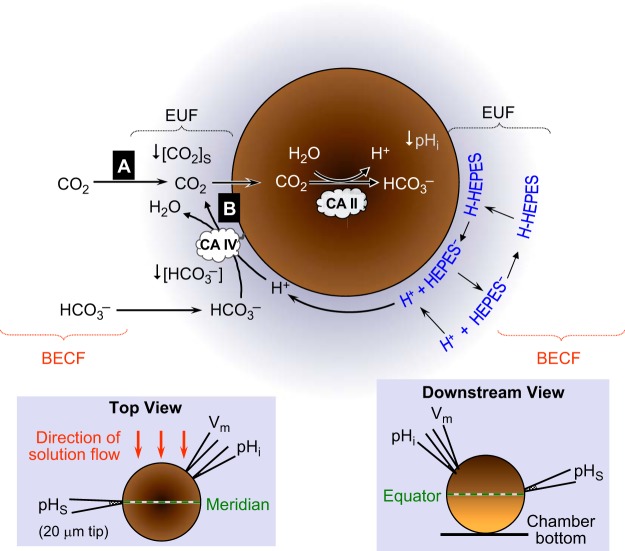
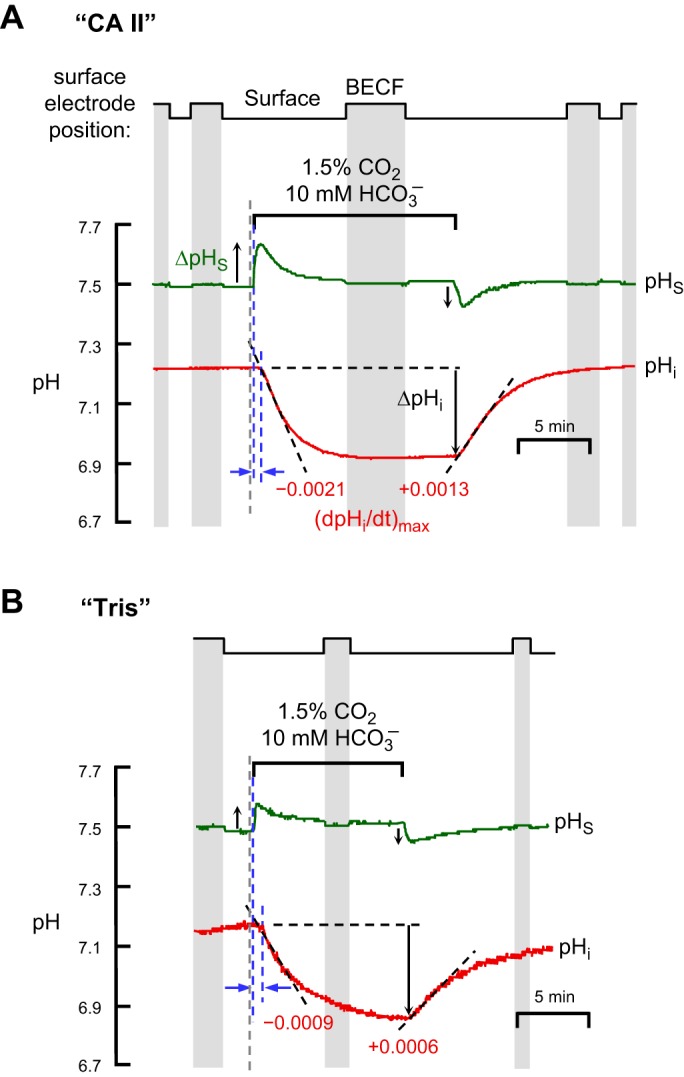
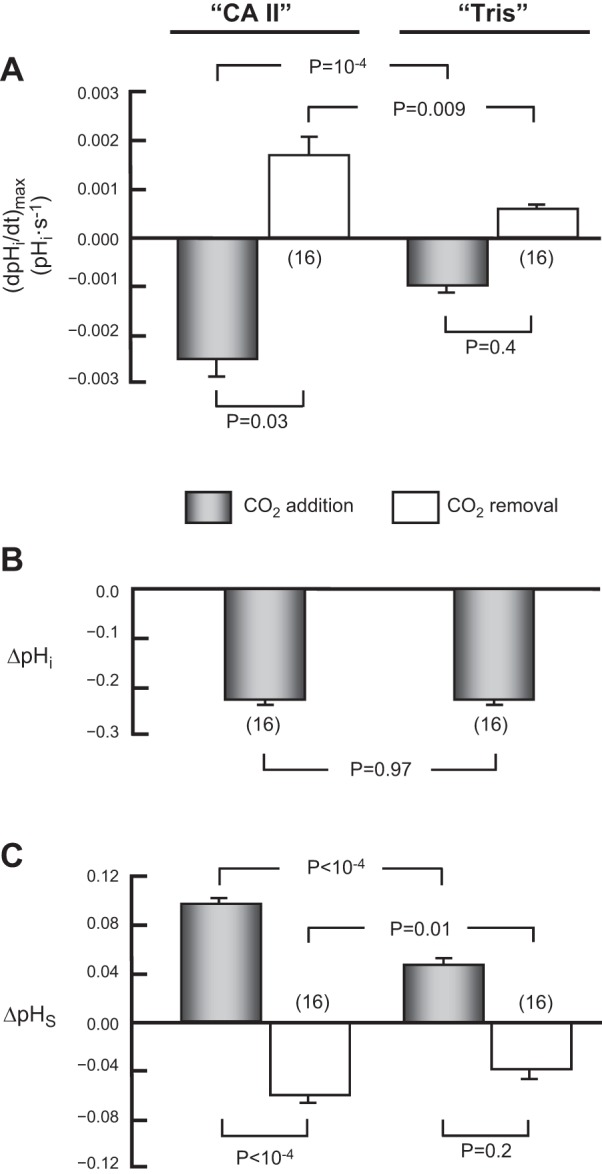
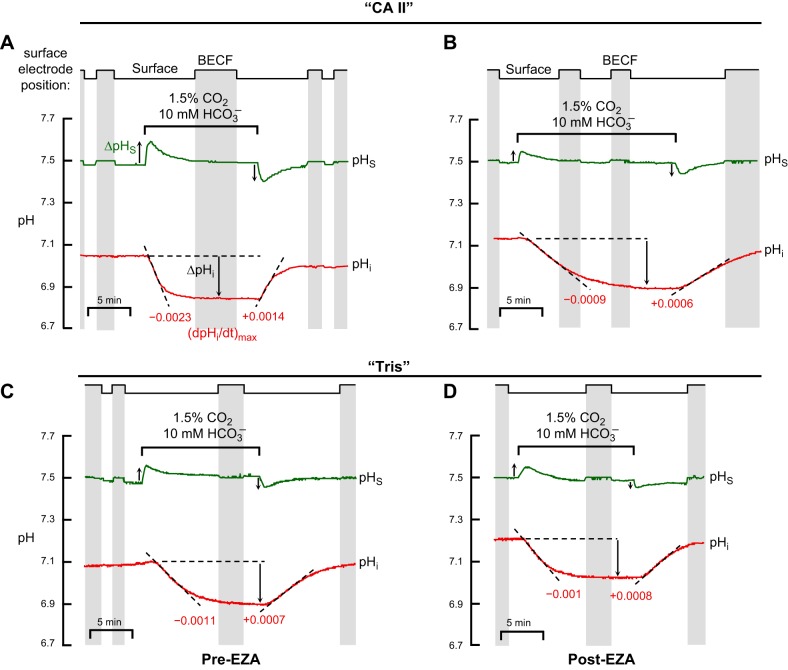
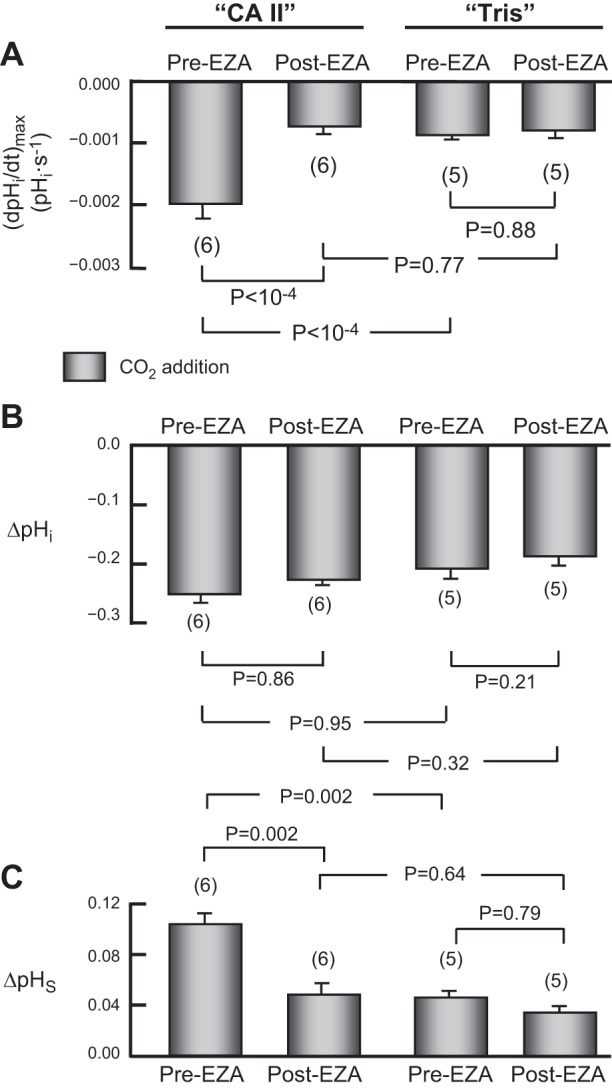
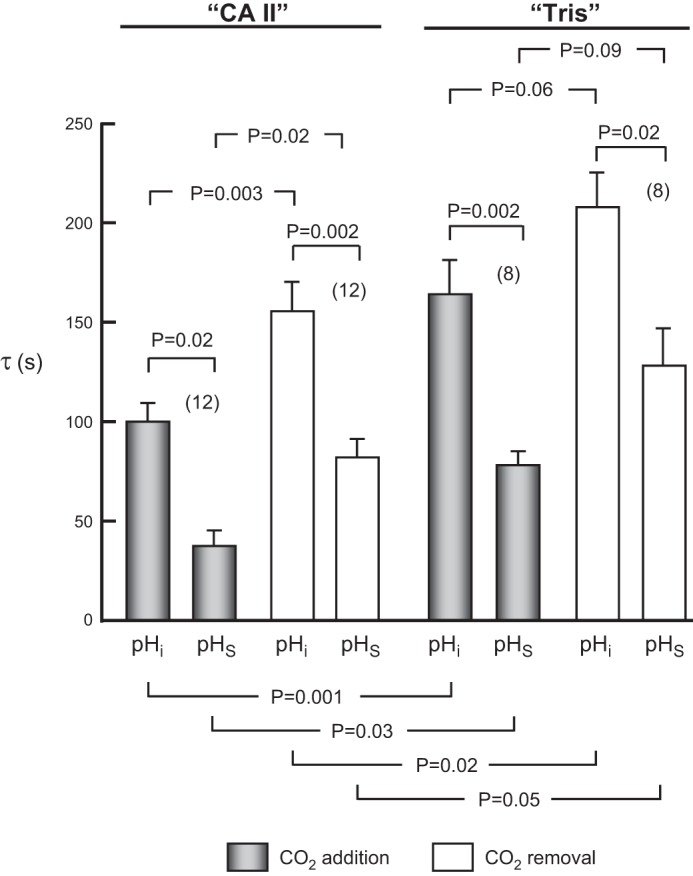
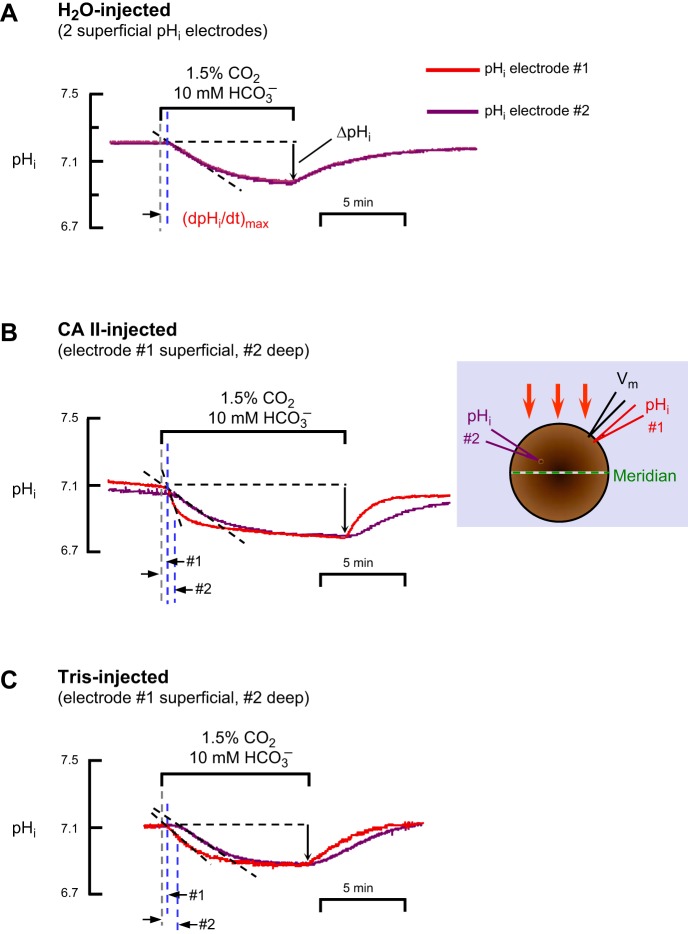
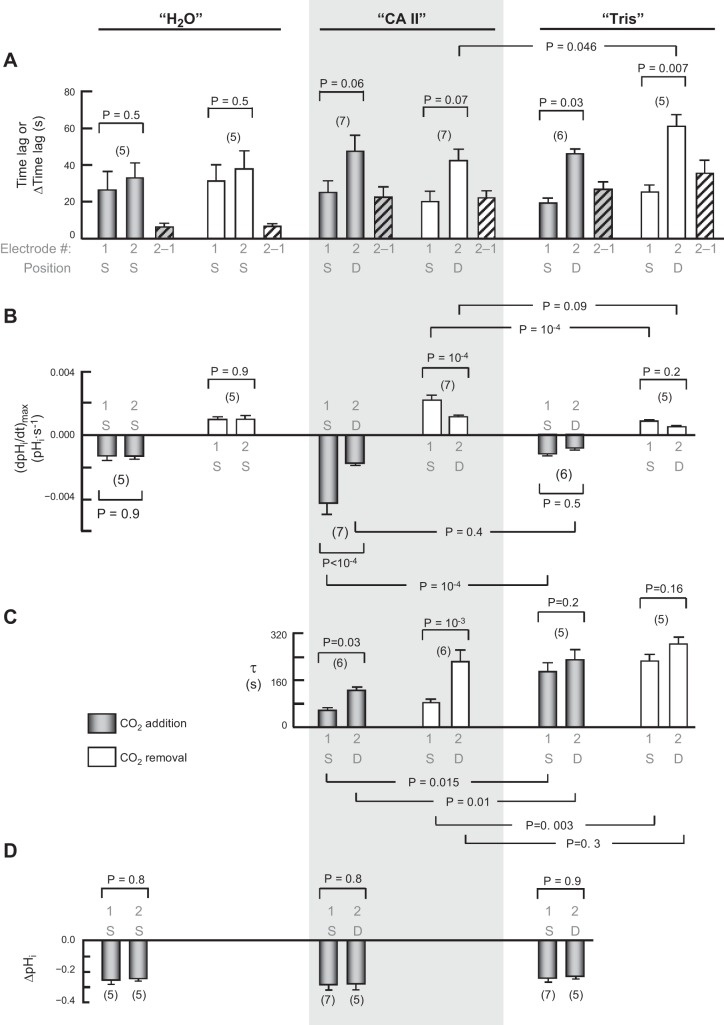
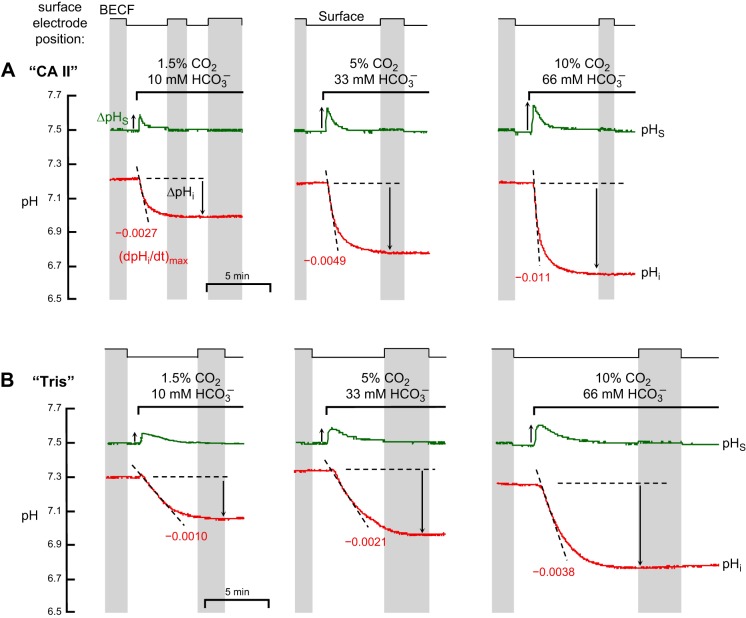
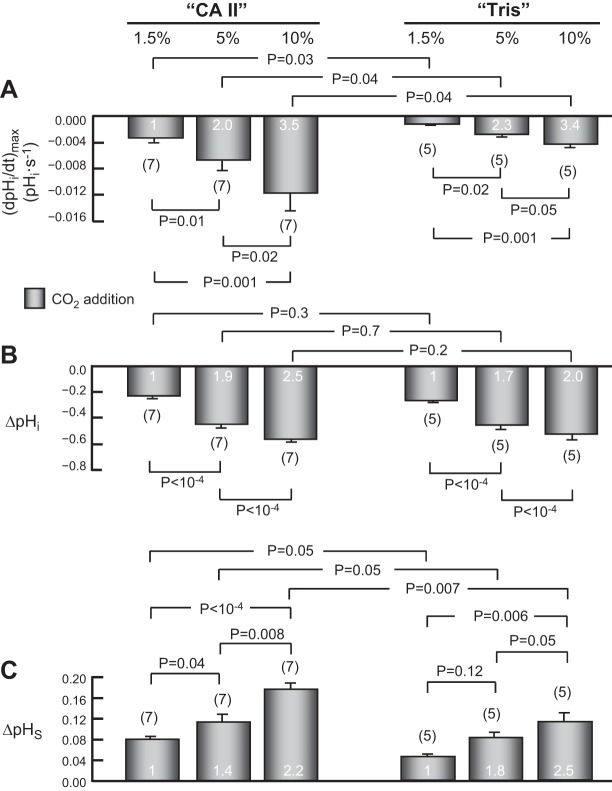
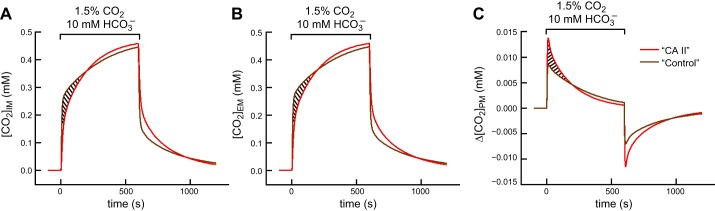
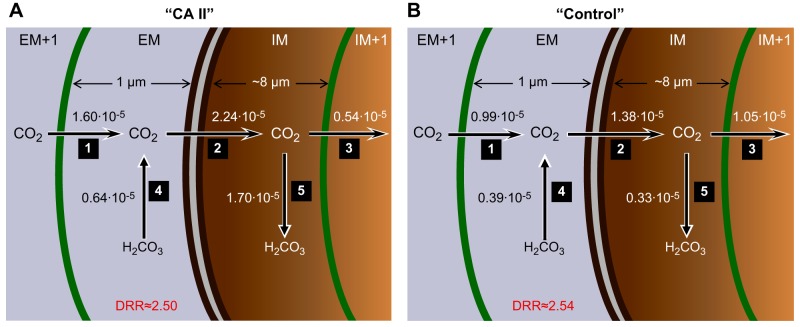
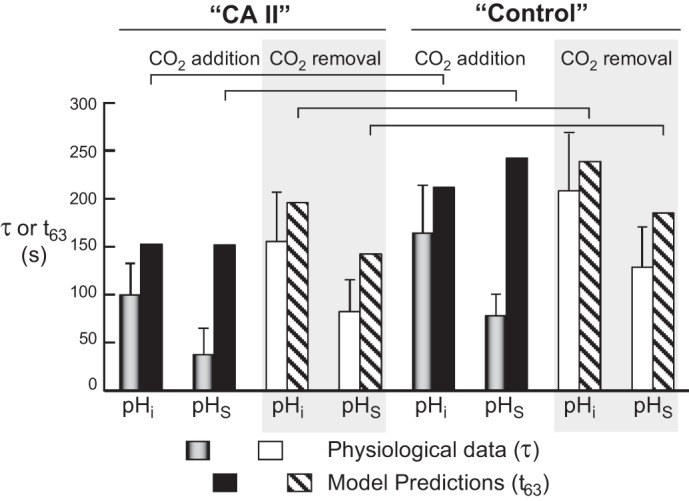
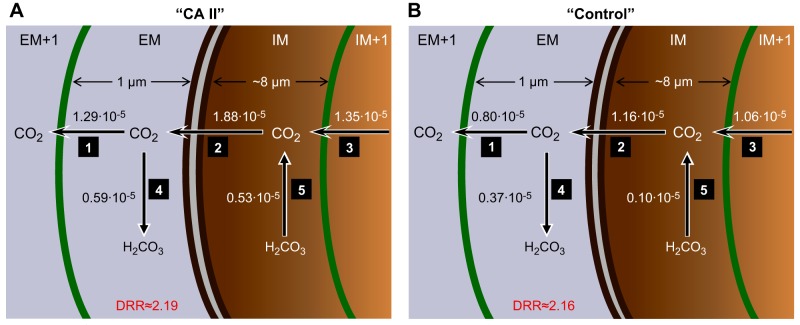
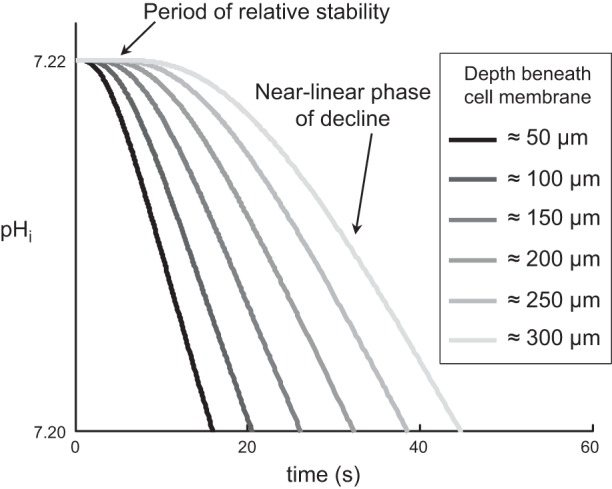
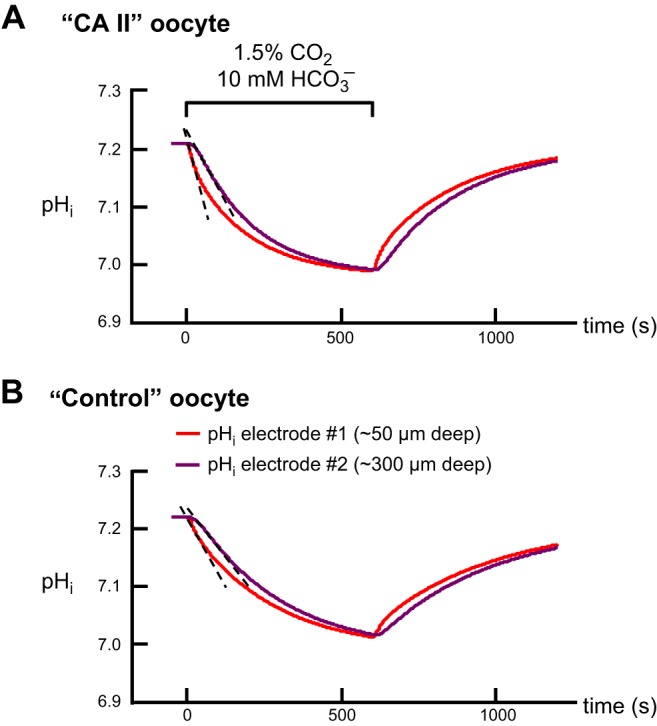
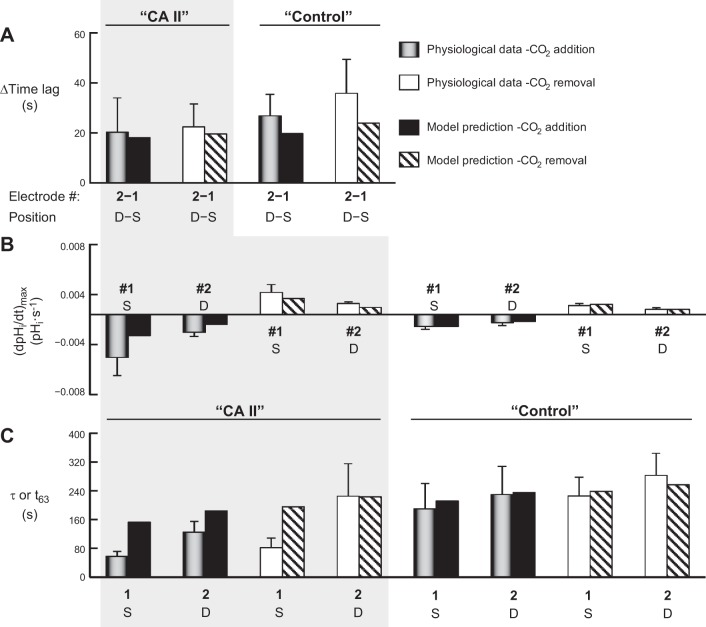
The α-carbonic anhydrases (CAs) are zinc-containing enzymes that catalyze the interconversion of CO2 and HCO3 (-). Here, we focus on human CA II (CA II), a ubiquitous cytoplasmic enzyme. In the second paper in this series, we examine CA IV at the extracellular surface. After microinjecting recombinant CA II in a Tris solution (or just Tris) into oocytes, we expose oocytes to 1.5% CO2/10 mM HCO3 (-)/pH 7.50 while using microelectrodes to monitor intracellular pH (pHi) and surface pH (pHS). CO2 influx causes the familiar sustained pHi fall as well as a transient pHS rise; CO2 efflux does the opposite. Both during CO2 addition and removal, CA II increases the magnitudes of the maximal rate of pHi change, (dpHi/dt)max, and the maximal change in pHS, ΔpHS. Preincubating oocytes with the inhibitor ethoxzolamide eliminates the effects of CA II. Compared with pHS, pHi begins to change only after a delay of ~9 s and its relaxation has a larger (i.e., slower) time constant (τpHi > τpHS ). Simultaneous measurements with two pHi electrodes, one superficial and one deep, suggest that impalement depth contributes to pHi delay and higher τpHi . Using higher CO2/HCO3 (-) levels, i.e., 5%/33 mM HCO3 (-) or 10%/66 mM HCO3 (-), increases (dpHi/dt)max and ΔpHS, though not in proportion to the increase in [CO2]. A reaction-diffusion mathematical model (described in the third paper in this series) accounts for the above general features and supports the conclusion that cytosolic CA-consuming entering CO2 or replenishing exiting CO2-increases CO2 fluxes across the cell membrane.

Keywords: electrode depth; electrophysiology; ethoxzolamide; ion-sensitive microelectrodes; mathematical modeling.


Figures

Fig. 1.
Fig. 1.
Model of an oocyte exposed to CO2/HCO3. The main part of the figure illustrates the diffusion and reaction events as CO2 enters an oocyte. The black arrows with sharp heads indicate solute diffusion in the extracellular unconvected fluid (EUF) and intracellular fluid. The black arrows with dull heads indicate reactions. The left inset is a schematic top view of the oocyte in the chamber, as seen through the microscope. The orange arrows indicate the direction of convective flow of the bulk extracellular fluid (BECF). The right inset is a schematic view of the oocyte along the axis of convective flow, looking downstream. The darker half of the oocyte, oriented upward, is the animal pole. CA II, carbonic anhydrase II; pHi, intracellular pH; pHS, surface pH.
Fig. 2.
Fig. 2.
Representative experiments showing effects of CA II on pHi and pHS changes evoked by application and removal of CO2/HCO3. A: oocytes injected with recombinant human CA II dissolved in Tris buffer. B: oocytes injected only with Tris buffer. Both in “CA II” or “Tris” oocytes, the pHi trace is represented by the red lower record, and pHS, by the green upper record. At the indicated times, we switched the extracellular solution from ND96 to 1.5% CO2/10 mM HCO3/pH 7.50 (Table 1) and then back again. In this example, the extracellular solution flowed at 2 ml/min and the sampling rate was 1 per 1,000 ms. The vertical gray bands represent periods during which the pHS electrode was withdrawn to the BECF for calibration. At other times the pHS electrode was dimpling ∼40 μm into the oocyte surface. The gray, dashed vertical lines represent the times that the computer switched the valves to initiate a change of solutions. The left and right blue, dashed vertical lines (see results) represent the initiation of the pHS and pHi transients, respectively. The dashed black lines through the initial portions of the pHi records for CO2 application and removal represent best linear fits for maximal rates of pHi change (negative or positive direction). The downward vertical arrows near the pHi records represent the CO2-induced changes in steady-state pHi. The upward and downward arrows near the pHS records represent maximal changes in pHS (positive or negative direction).
Fig. 3.
Fig. 3.
Summary of effects of CA II on pHi and pHS. This figure summarizes results from a larger number of experiments, such as those in Fig. 2, on oocytes injected with CA II in Tris buffer, or only Tris buffer. In each case, we switched the extracellular solution from ND96 to 1.5% CO2/10 mM HCO3 (gray bars) and vice versa (white bars). A: maximal rates of pHi change (negative or positive direction) produced by the extracellular solution switch. B: changes in steady-state pHi, induced by the addition of CO2/HCO3. C: maximal changes in pHS (positive or negative direction) caused by the extracellular solution switch. This summary includes all oocytes injected with CA II (and exposed to 1.5% CO2 in 5 mM HEPES) in the present study, as well as their day-matched Tris-injected controls. Values are means ± SE, with nos. of oocytes in parentheses. We performed a one-way ANOVA (overall P values: P < 10−4 in A, and P < 10−4 in C), followed by a Student-Newman-Keuls (SNK) analysis (P shown for individual comparisons). We performed a paired t-test in B. The mean initial pHi for “CA II” oocytes in the CO2/HCO3-free ND96 solution was 7.21 ± 0.05 (n = 16). This mean is not significantly different from that for “Tris” oocytes, 7.22 ± 0.03 (n = 16; P = 0.93).
Fig. 4.
Fig. 4.
Representative experiments showing effects of ethoxzolamide (EZA) EZA on pHi and pHS. A: oocyte injected with recombinant human CA II dissolved in Tris buffer, assayed before treatment with EZA (Pre-EZA). B: “CA II” oocyte, assayed after a 3-h treatment with EZA (Post-EZA). C: oocyte injected only with Tris buffer, assayed before treatment with EZA. D: “Tris” oocyte, assayed after a 3-h treatment with EZA. For both CA II and Tris experiments, the Pre-EZA and Post-EZA pHi and pHS records were obtained from the same oocytes. Between the two CO2/HCO3 exposures, the oocytes were exposed for 3 h to the ND96 solution (Table 1) supplemented with 400 μM EZA, followed by 3 washes in ND96, and incubation in ND96 (30 min to 3 h). We noticed no effect of the variable duration of the post-EZA incubation. The extracellular solutions were ND96 and, during the indicated time, 1.5% CO2/10 mM HCO3/pH 7.50. In both experiments, the solution flowed at 2 ml/min and the sampling rate was 1 per 1,000 ms. The vertical gray bands represent periods during which the pHS electrode was withdrawn to the BECF for calibration. The dashed black lines through the initial portions of the pHi records for CO2 application and removal represent best linear fits for maximal rates of pHi change (negative or positive direction). The downward vertical arrows represent CO2-induced change in steady-state pHi. The upward and downward vertical arrows near the pHS records represent the maximal CO2-induced changes in pHS (positive or negative direction).
Fig. 5.
Fig. 5.
Summary of the effects of EZA on pHi and pHS. This figure summarizes data relating to CO2 addition from a larger number of experiments, such as those in Fig. 4, on oocytes injected with CA II in Tris buffer, or only Tris buffer. After an assay during which we switched the extracellular solution from ND96 to 1.5% CO2/10 mM HCO3, in the absence of EZA (Pre-EZA), we exposed the same oocyte to 400 μM EZA for 3 h, and then repeated the assay (Post-EZA). A: maximal rates of pHi change (negative direction) produced by the extracellular solution switch. B: changes in steady-state pHi produced by the switch to CO2/HCO3. C: maximal changes in pHS (positive direction) produced by the extracellular solution switch. Values are means ± SE, with nos. of oocytes in parentheses. We performed a one-way ANOVA (overall P values: P < 10−4 in A, P = 0.38 in B, and P = 0.0012 in C), followed by a Student-Newman- Keuls (SNK) analysis (P shown for individual comparisons). The mean initial pHi for “CA II” oocytes in the CO2/HCO3-free ND96 solution was 7.13 ± 0.11 (n = 6), which is not significantly different from the mean value for “Tris” oocytes, 7.05 ± 0.07 (n = 5; P = 0.93). For both “CA II” and “Tris” oocytes, EZA had no effect on the initial pHi.
Fig. 6.
Fig. 6.
Summary of time constants (τ) for pHi and pHS changes for a larger number of experiments, such as those in Fig. 2, on oocytes injected with CA II in Tris buffer, or only Tris. Values are means ± SE, with nos. of oocytes in parentheses. We performed a one-way ANOVA followed by a Student-Newman-Keuls (SNK) analysis (P shown for individual comparisons).
Fig. 7.
Fig. 7.
Representative experiments with dual pHi-electrode impalements of Xenopus oocytes. A: oocyte injected with H2O on day 0. B: oocyte injected with recombinant human CA II dissolved in Tris buffer on day 3. The inset is a schematic top view of the oocyte, showing the arrangement of microelectrodes; the orange arrows show the direction of convective flow. C: oocyte injected only with Tris buffer on day 3. The extracellular solutions were ND96 (Table 1) and, during the indicated time, 1.5% CO2/10 mM HCO3/pH 7.50. For all three oocytes, the solution flowed at 3 ml/min and the sampling rate was 1 per 500 ms. The pHi record from electrode no. 1 (superficial) is in red, and the pHi record from electrode no. 2 (deep) is in purple. The gray, dashed vertical lines represent the times that the computer switched the valves to initiate a change of solutions. The left and right blue, dashed vertical lines represent the initiation of the transients for pHi electrodes no. 1 and no. 2, respectively. The dashed black lines through the initial portions of the pHi records for CO2 application represent best linear fits for maximal rates of pHi change (negative direction). The downward vertical arrows represent the CO2-induced change in steady-state pHi.
Fig. 8.
Fig. 8.
Summary of dual pHi-electrode impalements. This figure summarizes results from a larger number of experiments, such as those in Fig. 7. We injected all oocytes with H2O on day 0. Those for which this was the only injection are labeled “H2O.” We impaled these oocytes superficially (S) with two pHi microelectrodes, electrode no. 1 positioned by a manual manipulator (the one that held pHi electrodes in other protocols), and electrode no. 2 positioned by a motorized manipulator (the one that held pHS electrodes in other protocols). For other oocytes, we followed the injection of water on day 0 with the injection on day 3 with either “CA II” in Tris buffer, or only “Tris.” We impaled these oocytes superficially with pHi microelectrode no. 1, and deep (D) with electrode no. 2. A: time lags between initiation of the transients for pHi electrodes no. 1 and no. 2. The hatched bars represent the oocyte-by-oocyte difference between electrodes no. 2 and no. 1. An ANOVA for the six differences in time lags between electrode no. 2 and electrode no. 1 (six hatched bars) had an overall P value of 0.0003. The two “H2O” values were significantly different from the others. B: maximal rates of pHi change (negative or positive direction) produced by the extracellular solution switch. C: time constants (τ) for pHi changes. D: changes in steady-state pHi induced by the addition of CO2/HCO3. Values are means ± SE, with nos. of oocytes in parentheses. We performed a one-way ANOVA, followed by a Student-Newman-Keuls (SNK) analysis (P shown for individual comparisons). The initial pHi values for “H2O”, “CA II”, and “Tris” oocytes in the ND96 (i.e., CO2/HCO3-free) solution were not significantly different from one another, both for electrode no. 1 and electrode no. 2 (overall ANOVA, P = 0.81).
Fig. 9.
Fig. 9.
Representative experiments showing the effect of graded increases in extracellular CO2/HCO3 levels on pHi and pHS. A: oocyte injected with recombinant human CA II in Tris buffer. B: oocyte injected only with Tris buffer. A and B each represent an experiment on single oocytes. The pHi trace is represented by the red lower record, and pHS, by the green upper record. At the indicated times, we switched the extracellular solution (Table 1) from 1) ND96 to 1.5% CO2/10 mM HCO3 (left), or 2) ND96 to 5% CO2/33 mM HCO3 (center), or 3) ND96 to 10% CO2/66 mM HCO3 (right). After the first two CO2/HCO3 exposures, we restored the ND96 solution (not shown). For both oocytes, the solution flowed at 3 ml/min and the sampling rate was 1 per 500 ms. The vertical gray bands represent periods during which the pHS electrodes were withdrawn to the BECF for calibration. The dashed black lines through the initial portions of the pHi records for CO2 application represent best linear fits for maximal rates of pHi change (negative direction). The downward vertical arrows represent CO2-induced changes in steady-state pHi. The upward vertical arrows represent the maximal excursion of pHS (positive direction).
Fig. 10.
Fig. 10.
Summary of effects of graded increases of extracellular CO2/HCO3 levels on pHi and pHS. This figure summarizes results from a larger number of experiments, such as those in Fig. 9, on oocytes injected with CA II in Tris buffer, or only Tris buffer. A: maximal rates of pHi change (negative direction) produced by the introduction of extracellular CO2/HCO3. B: changes in steady-state pHi induced by the addition of CO2/HCO3. C: maximal changes in pHS (positive direction) caused by the addition of CO2/HCO3. Values are means ± SE, with nos. of oocytes in parentheses. The white numerals are the ratios of mean values, relative to the value at 1.5% CO2. We performed a one-way ANOVA followed by a Student-Newman-Keuls (SNK) analysis (P shown for individual comparisons). The initial pHi values for “CA II” or “Tris” oocytes in the ND96 (i.e., CO2/HCO3-free) solution were not significantly different (overall ANOVA, P = 0.84).
Fig. 11.
Fig. 11.
Predictions of the mathematical model for concentration-time profiles of CO2 for a “CA II” oocyte (red curves) and a “Control” or “Tris” oocyte (brown curves). A: [CO2] at the intracellular surface of the plasma membrane (IM). B: [CO2] at the extracellular surface of the plasma membrane (EM). C: gradient of CO2 across the plasma membrane (PM), the result of subtracting values in B from corresponding values in A. The hatched areas in A and B identify the initial phase of CO2 influx, during which the model predicts that cytosolic CA decreases [CO2] at the inner and outer surfaces of the plasma membrane. However, the dominant effect is at the inner membrane, so that CA provides a larger gradient for CO2 influx, as indicated by the hatched area in C. Details of the mathematical model are presented in the third paper in this series (49).
Fig. 12.
Fig. 12.
Predictions of the mathematical model for maximal CO2 diffusion and reaction fluxes near the plasma membrane during addition of 1.5% CO2/10 mM HCO3. A: “CA II” oocyte. B: “Control” or “Tris” oocyte. The parallel dark brown curves identify the plasma membrane (PM). The green curves to the left and right of the PM represent the spatial discretizations for the numerical solutions. The numbers near the arrows 1 through 5 indicate the maximal diffusive fluxes (sharp arrowheads) and reaction fluxes (dull arrowheads) in units of μmol/s. These maximal fluxes occur within ∼1 s of each other. The diffusion/reaction ratio (DRR) is the quotient of flux no. 1/flux no. 4. Details of the mathematical model are presented in the third paper in this series (49).
Fig. 13.
Fig. 13.
Comparison of physiological τ data with t63 data predicted by the mathematical model. The physiological data are taken from Fig. 6; note that here we report the means ± standard deviation (and not SE, as in Fig. 6). An apparent inconsistency arises when we compare pHS data from physiological experiments (time constant, τ) and simulations (time to 63% of completion, t63) for CO2 addition, under both CA II and control conditions. The inconsistency probably arises, in part, because of the multiexponential decay of the simulated pH trajectory, the special nature of the pHS trajectory beneath the pHS electrode, and the asymmetry of pHS over the oocyte surface. Details of the mathematical model are presented in the third paper in this series (49).
Fig. 14.
Fig. 14.
Predictions of the mathematical model for maximal CO2 diffusion and reaction fluxes near the plasma membrane during removal of 1.5% CO2/10 mM HCO3. A: “CA II” oocyte. B: “Control” or “Tris” oocyte. The parallel dark brown curves identify the plasma membrane (PM). The green curves to the left and right of the PM represent the spatial discretizations for the numerical solutions. The numbers near the arrows 1 through 5 indicate the maximal diffusive fluxes (sharp arrowheads) and reaction fluxes (dull arrowheads) in units of μmol/s. These maximal fluxes occur within ∼1 s of each other. The diffusion/reaction ratio (DRR) is the quotient of flux no. 1/flux no. 4. Details of the mathematical model are presented in the third paper in this series (49).
Fig. 15.
Fig. 15.
Predictions of the mathematical model for different depths of impalement, during the application of 1.5% CO2/10 mM HCO3 to a “Control” or “Tris” oocyte. We report pHi trajectories for the first 60 s for six depths (∼50, 100, 150, 200, 250, and 300 μm) for a hypothetical oocyte having a radius of 650 μm. At progressively greater depths, pHi remains relatively stable for progressively longer time periods before beginning the transition to a near-linear phase of decline. Details of the mathematical model are presented in the third paper in this series (49).
Fig. 16.
Fig. 16.
Predictions of the mathematical model for pHi trajectories at depths of ∼50 μm and ∼300 μm. A: simulations for a “CA II” oocyte. B: simulations for a “Control” or “Tris” oocyte. In these simulations, which are comparable to the physiological experiments in Fig. 7, the tortuosity factor (λ) used to simulate a layer of intracellular vesicles is ∼3.16. Details of the mathematical model are presented in the third paper in this series (49).
Fig. 17.
Fig. 17.
Comparison of predictions of the model, at depths of ∼50 μm (S, Superficial) and ∼300 μm (D, Deep), and the physiological data. A: difference (Deep-Superficial) between pHi time lags. B: (dpHi/dt)max values. C: time constants from physiological experiments or time to 63% of completion (i.e., t63) for simulations. The gray background identifies data for “CA II” oocytes; the absence of background color identifies “Control” or “Tris” oocytes. The physiological data are taken from Fig. 8; note that here we report means ± standard deviation (and not SE, as in Fig. 8).

Similar articles

Cited by

References

    1. Aalkjaer C, Cragoe EJ, Jr. Intracellular pH regulation in resting and contracting segments of rat mesenteric resistance vessels. J Physiol 402: 391–410, 1988 - PMC - PubMed
    1. Becker B. Decrease in intraocular pressure in man by a carbonic anhydrase inhibitor, diamox; a preliminary report. Am J Ophthalmol 37: 13–15, 1954 - PubMed
    1. Becker EL, Hodler JE, Fishman AP. Effect of carbonic anhydrase inhibitor on arterial-alveolar CO2 gradient in man. Proc Soc Exp Biol Med 84: 193–195, 1953 - PubMed
    1. Beckman WW, Rossmeisl EC, Pettengill RB, Bauer W. A study of the effects of sulfanilamide on acid-base metabolism. J Clin Invest 19: 635–644, 1940 - PMC - PubMed
    1. Bell AL, Jr, Smith CN, Andreae E. Effects of the carbonic anhydrase inhibitor “6063” (diamox) on respiration and electrolyte metabolism of patients with respiratory acidosis. Am J Med 18: 536–546, 1955 - PubMed

Publication types

LinkOut - more resources