. 2014 Nov 1;307(9):C841-58.
doi: 10.1152/ajpcell.00049.2014. Epub 2014 Jun 25.

Evidence from mathematical modeling that carbonic anhydrase II and IV enhance CO2 fluxes across Xenopus oocyte plasma membranes

Affiliations

Evidence from mathematical modeling that carbonic anhydrase II and IV enhance CO2 fluxes across Xenopus oocyte plasma membranes

Rossana Occhipinti et al. Am J Physiol Cell Physiol. .

Abstract

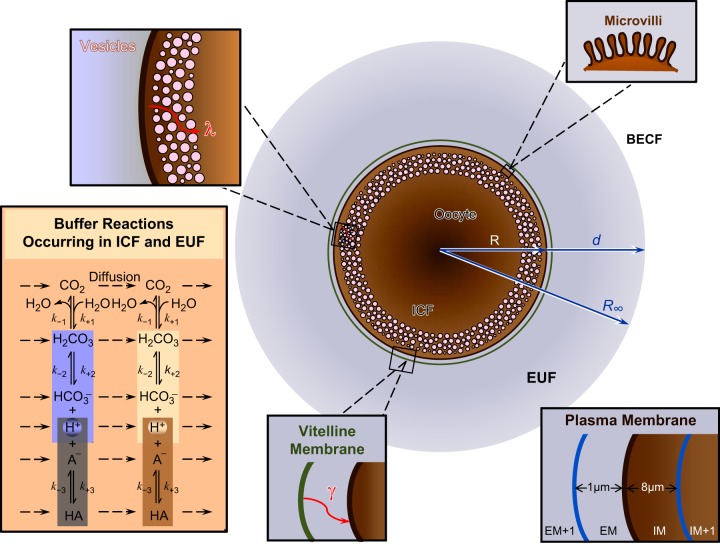
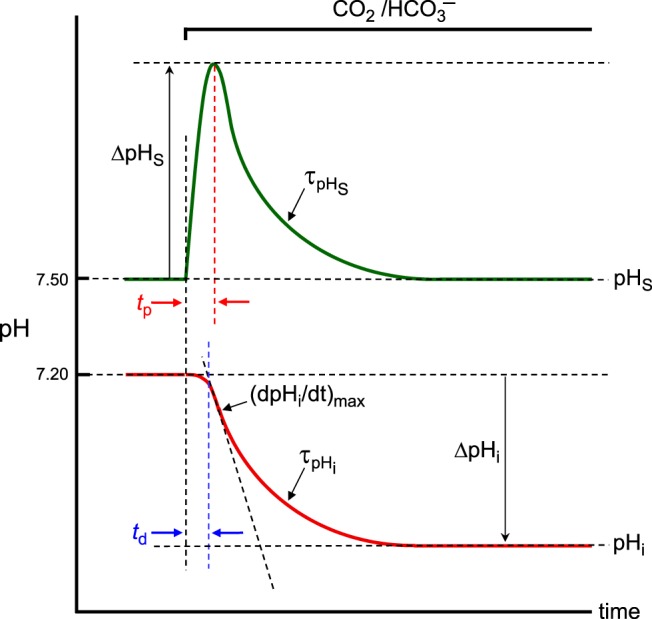
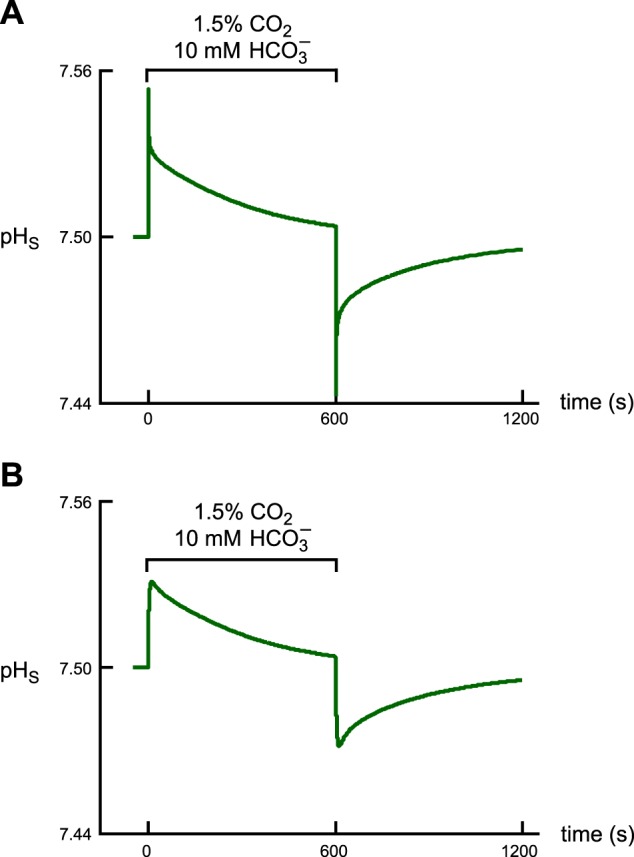
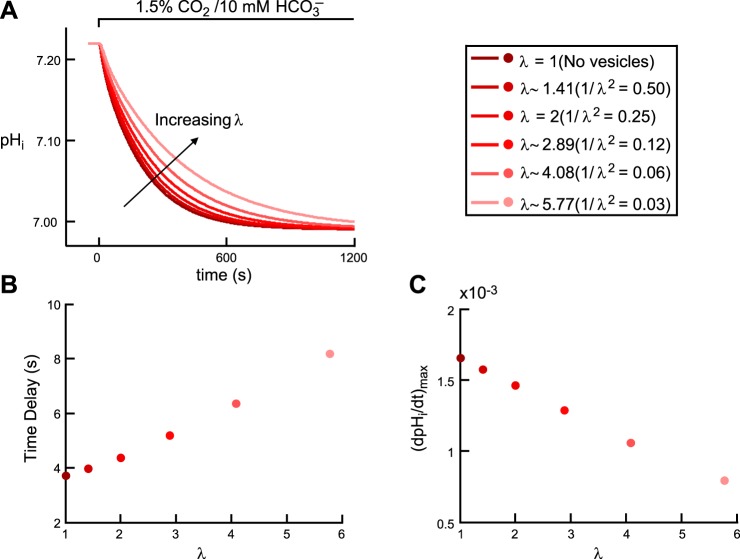
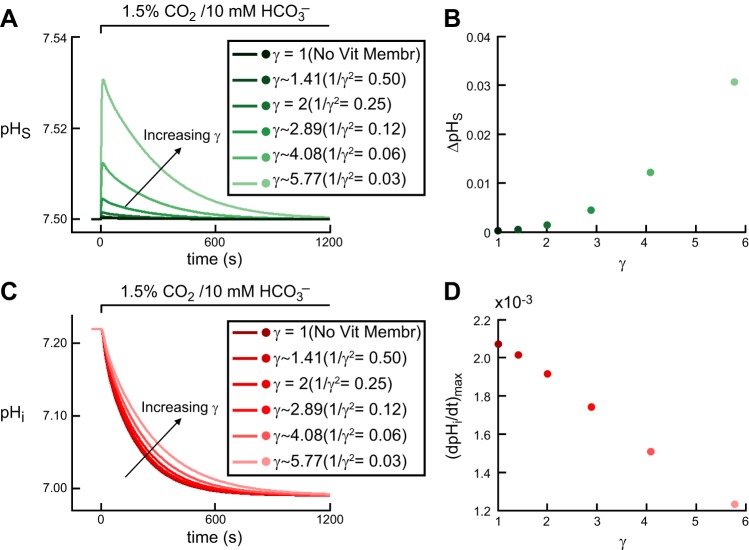
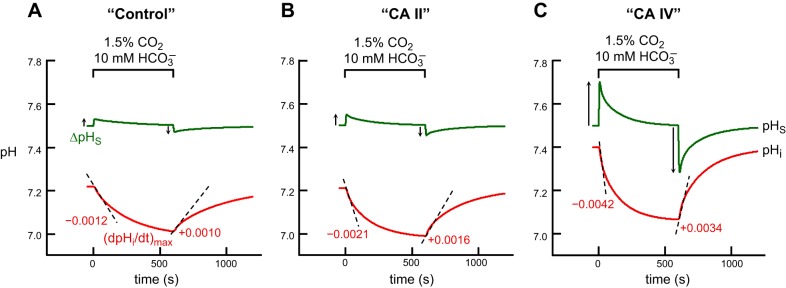
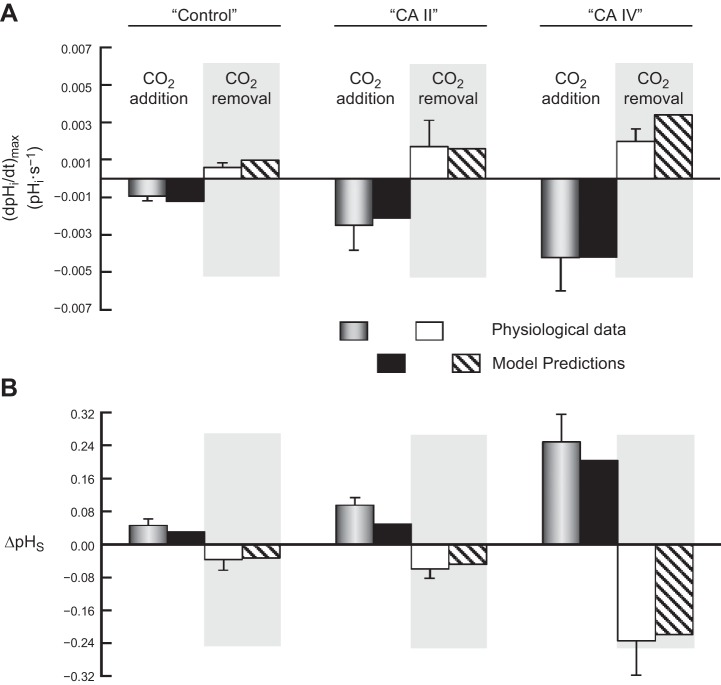
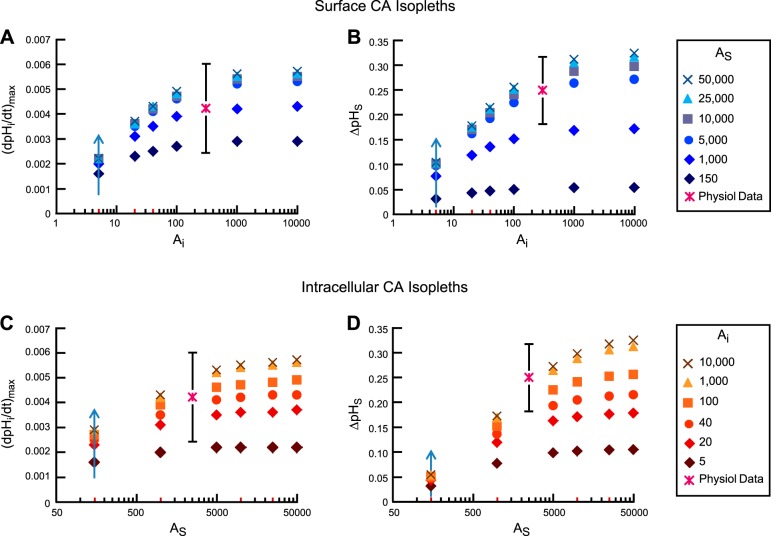
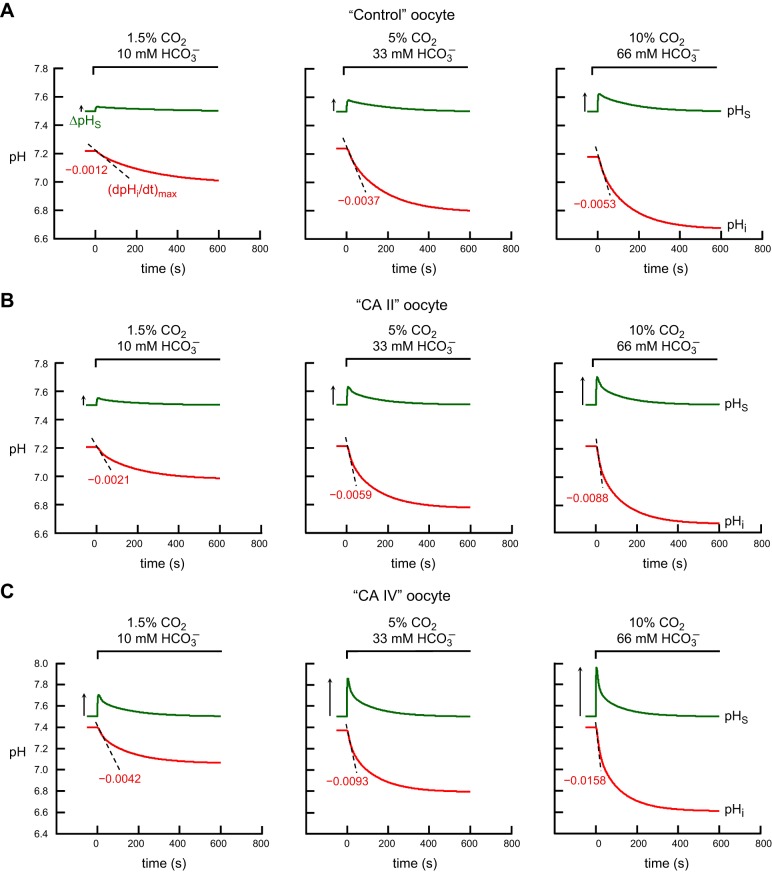
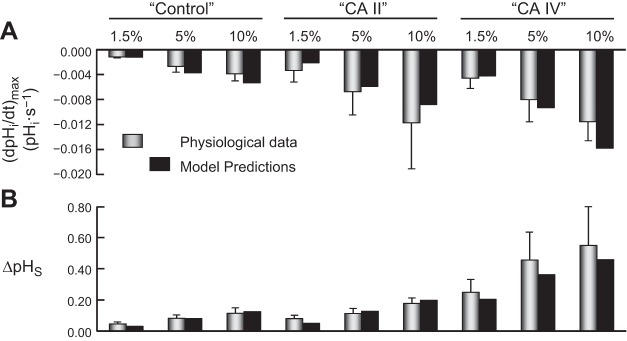
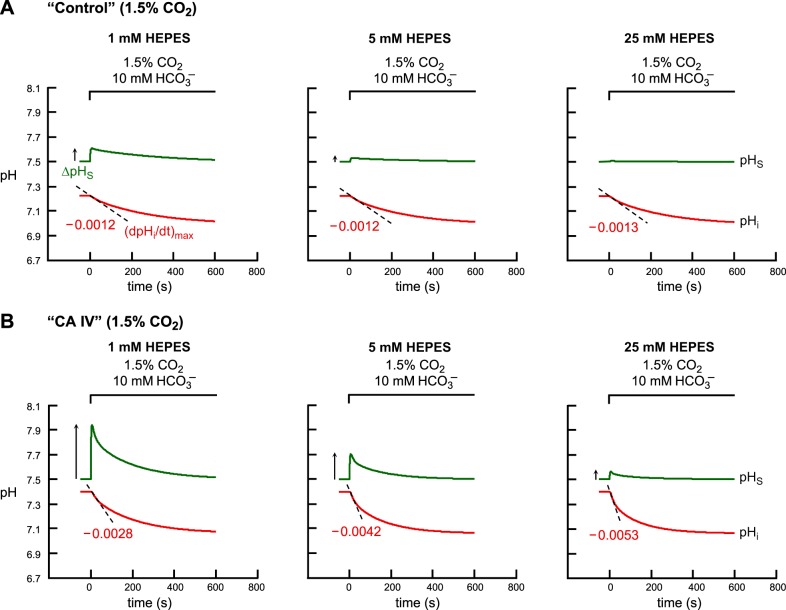
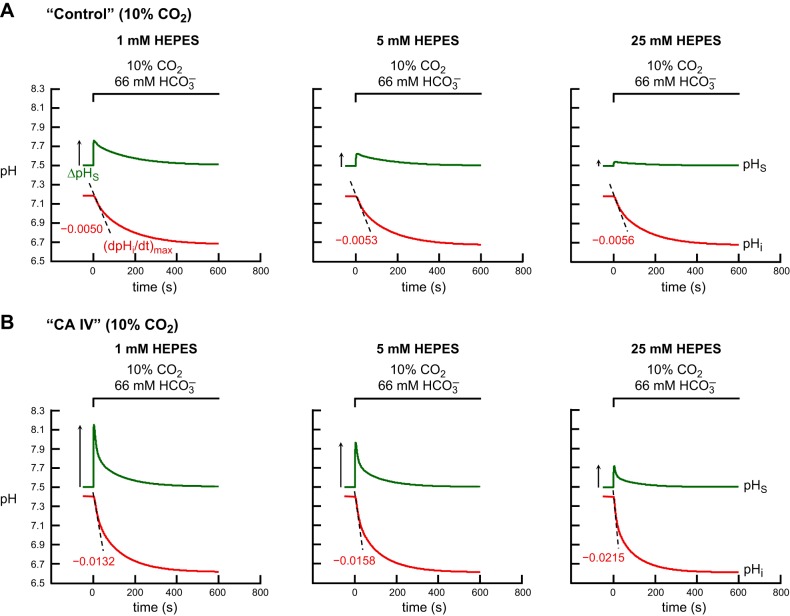
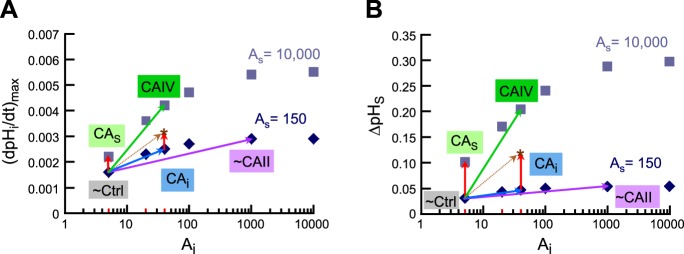
Exposing an oocyte to CO2/HCO3 (-) causes intracellular pH (pHi) to decline and extracellular-surface pH (pHS) to rise to a peak and decay. The two companion papers showed that oocytes injected with cytosolic carbonic anhydrase II (CA II) or expressing surface CA IV exhibit increased maximal rate of pHi change (dpHi/dt)max, increased maximal pHS changes (ΔpHS), and decreased time constants for pHi decline and pHS decay. Here we investigate these results using refinements of an earlier mathematical model of CO2 influx into a spherical cell. Refinements include 1) reduced cytosolic water content, 2) reduced cytosolic diffusion constants, 3) refined CA II activity, 4) layer of intracellular vesicles, 5) reduced membrane CO2 permeability, 6) microvilli, 7) refined CA IV activity, 8) a vitelline membrane, and 9) a new simulation protocol for delivering and removing the bulk extracellular CO2/HCO3 (-) solution. We show how these features affect the simulated pHi and pHS transients and use the refined model with the experimental data for 1.5% CO2/10 mM HCO3 (-) (pHo = 7.5) to find parameter values that approximate ΔpHS, the time to peak pHS, the time delay to the start of the pHi change, (dpHi/dt)max, and the change in steady-state pHi. We validate the revised model against data collected as we vary levels of CO2/HCO3 (-) or of extracellular HEPES buffer. The model confirms the hypothesis that CA II and CA IV enhance transmembrane CO2 fluxes by maximizing CO2 gradients across the plasma membrane, and it predicts that the pH effects of simultaneously implementing intracellular and extracellular-surface CA are supra-additive.

Keywords: buffers; competing equilibria; intracellular pH; reaction-diffusion; surface pH; tortuosity factors.


Figures

Fig. 1.
Fig. 1.
Main features of the revised mathematical model. Following the approach of Somersalo et al. (22), we assume that the oocyte is a perfectly symmetric sphere of radius R, surrounded by a thin layer of extracellular unconvected fluid (EUF) of thickness d. The EUF is in turn surrounded by the bulk extracellular fluid (BECF), which is an infinite reservoir for all solutes. Within the BECF, convection could occur (though it is not included in the present model), but no reaction or diffusion. Solutes can diffuse between the BECF and EUF. In both the intracellular fluid (ICF) and EUF, reaction and diffusion occur, but no convection. The buffer reactions occurring in the ICF and EUF (illustrated in the inset in the bottom left corner) are: the CO2/HCO3 buffer reactions (including the slow conversion of CO2 into H2CO3 and vice versa) and a single non-CO2/HCO3 buffer (HA/A). New features of the model include (starting from the inside of the cell and moving outward): 1) reduced water content of cytosol, 2) reduced cytosolic diffusion constants, 3) refined CA II activity, 4) layer of intracellular vesicles (magnification in top left corner), 5) reduced membrane CO2 permeability, 6) microvilli (magnification in top right corner), 7) refined CA IV activity, 8) vitelline membrane (magnification on lower edge), and 9) a new simulation protocol for the delivery and removal of the bulk extracellular CO2/HCO3 solution. The inset in the bottom right corner explains the spatial discretization for the numerical solution near the plasma membrane (PM). EM, extracellular surface of the PM; IM, intracellular surface of the PM.
Fig. 2.
Fig. 2.
Summary of the key quantities of interest for describing intracellular-pH (pHi) and surface pH (pHS) transients in our physiological experiments during the addition of CO2/HCO3. This figure schematically illustrates the transients of pHi (in red) and pHS (in green) and some of the experimentally measurable key quantities as we expose an oocyte to a CO2/HCO3 solution. For pHi, key quantities are time delay (td), the maximal rate of pHi descent [(dpHi/dt)max], time constant for pHi decay (τpHi), and the difference between initial and final pHi (ΔpHi). For pHS, key quantities are time to peak (tp), maximal height of the pHS trajectory (ΔpHS), and the time constant for pHS decay (τpHS).
Fig. 3.
Fig. 3.
Effect of the new experimental protocol on the shape of the pHS trajectory and on the time to peak. A: pHS trajectory predicted by the model when using the protocol of Somersalo et al. (22). In using this original protocol, we assume that, at the outset of the simulation, the CO2/HCO3 is already at the plasma membrane. B: pHS trajectory predicted by the model when using the revised protocol. Here we assume that the oocyte is initially superfused with the CO2/HCO3-free ND96 solution until we switch the bulk solution to one containing CO2/HCO3 and allow the CO2 and HCO3 to diffuse to the cell surface.
Fig. 4.
Fig. 4.
Effect of intracellular vesicles on the pHi transient during the addition of CO2/HCO3. A: pHi trajectories, at a depth of ∼50 μm. The six simulations correspond to six increasing values of the tortuosity factor λ. B: time delay as a function of λ. The six colored dots correspond to the six simulations in A. C: maximal rate of pHi change (negative direction) as a function of λ. The six colored dots correspond to the six simulations reported in A.
Fig. 5.
Fig. 5.
Effect of vitelline membrane on pHi and pHS transients during the addition of CO2/HCO3. A: pHS trajectories. The six simulations correspond to six increasing values of the tortuosity factor γ. B: maximal height of the pHS spike (positive direction) as a function of γ. The six colored dots correspond to the six simulations in A. C: pHi trajectories, at a depth of ∼50 μm, corresponding to the simulations in A. D: maximal rate of pHi change (negative direction) as a function of γ. The six colored dots correspond to the six simulations in A.
Fig. 6.
Fig. 6.
Simulations of pHi and pHS transients for the addition and removal 1.5% CO2/10 mM HCO3 in 5 mM HEPES. A: “control” oocyte“. B: ”CA II“ oocyte. C: ”CA IV“ oocyte. The pHi transients, calculated at a depth of ∼50 μm into the oocyte, are represented by the red lower trajectories, and pHS, by the green upper trajectories. At the indicated time, we switched the extracellular solution from CO2/HCO3-free ”ND96“ to 1.5% CO2/HCO3 (see Eq. 9). The dashed black lines through the initial portions of the pHi transients for CO2 application and removal represent the maximal rates of pHi change (negative or positive direction), as predicted by the model. The upward and downward arrows near the pHS records represent maximal changes in pHS (positive or negative direction).
Fig. 7.
Fig. 7.
Comparison of the physiological data with predictions of the mathematical model for the addition and removal of extracellular 1.5% CO2/10 mM HCO3. A: maximal rates of pHi change (negative or positive direction) produced by the addition or removal of extracellular CO2/HCO3. B: maximal changes in pHS (positive or negative direction) caused by the addition or removal of extracellular CO2/HCO3. The physiological data come from Fig. 2 of the first paper in this series (14) and Fig. 3 of second paper (15). Note that here we report the means ± standard deviation (and not SE, as in the previous two papers). The data for model predictions come from Fig. 6 of the present paper.
Fig. 8.
Fig. 8.
Dependence of (dpHi/dt)max and ΔpHS on Ai and AS. A: dependence of (dpHi/dt)max on Ai, for several fixed values of AS (i.e., each set of symbols is a surface CA isopleth). B: dependence of ΔpHS on Ai, for several fixed values of AS (i.e., surface CA isopleths). C: dependence of (dpHi/dt)max on AS, for several fixed values of Ai (i.e., intracellular CA isopleths). D: dependence of ΔpHS on AS, for several fixed values of Ai (i.e., intracellular CA isopleths). In these simulations, we assume that a hypothetical oocyte with the intracellular composition (i.e., initial pHi and ΔpHi) of a ”CA IV“ oocyte is exposed to a bulk solution containing 1.5% CO2/10 mM HCO3. The physiological data are plotted on the ordinate as mean ± standard deviation; the position of these points along the abscissa is arbitrary.
Fig. 9.
Fig. 9.
Simulations of pHi and pHS transients for the addition of graded levels of extracellular CO2/HCO3 in 5 mM HEPES. A: ”control“ oocyte”. B: “CA II” oocyte. C: “CA IV” oocyte. The pHi transients, calculated at a depth of ∼50 μm, are represented by the red lower trajectories, and pHS, by the green upper trajectories. At the indicated time, we switched the extracellular solution from CO2/HCO3-free “ND96” to 1) 1.5% CO2/10 mM HCO3 (left), or 2) 5% CO2/33 mM HCO3 (center), or 3) 10% CO2/66 mM HCO3 (right). The dashed black lines through the initial portions of the pHi transients for CO2 application represent the maximal rates of pHi change (negative direction) predicted by the model. The upward arrow near the pHS records represent maximal changes in pHS (positive direction).
Fig. 10.
Fig. 10.
Comparison of the physiological data with predictions of the mathematical model for the addition of graded levels of extracellular CO2/HCO3. A: maximal rates of pHi change (negative direction) produced by the addition of extracellular CO2/HCO3. B: maximal changes in pHS (positive direction) caused by the addition of extracellular CO2/HCO3. The physiological data are taken from Fig. 10 of the first paper in this series (14) and Fig. 10 of the second paper (15). Note that here we report the means ± standard deviation (and not SE, as in the previous two papers). The data for model predictions come from Fig. 9 of the present paper.
Fig. 11.
Fig. 11.
Simulations of pHi and pHS transients for the addition of extracellular 1.5% CO2/10 mM HCO3, with graded increases in levels of extracellular HEPES. A: “control” oocyte. B: “CA IV” oocyte. The pHi transients, calculated at a depth of ∼50 μm, are represented by the red lower trajectories, and pHS, by the green upper trajectories. At the indicated time, we switched the extracellular solution from CO2/HCO3-free “ND96” to: 1) CO2/HCO3 + 1 mM HEPES, or 2) CO2/HCO3 + 5 mM HEPES, or 3) CO2/HCO3 + 25 mM HEPES. The dashed black lines through the initial portions of the pHi transients for CO2 application represent the maximal rates of pHi change (negative direction) predicted by the model. The upward arrows near the pHS records represent maximal changes in pHS (positive direction).
Fig. 12.
Fig. 12.
Simulations of pHi and pHS transients for the addition of extracellular 10% CO2/66 mM HCO3, with graded increases in levels of extracellular HEPES. A: “control” oocyte. B: “CA IV” oocyte. This figure differs from Fig. 11 in that, here, the CO2/HCO3 levels are ∼6.6-fold higher. The pHi transients, calculated at a depth of ∼50 μm, are represented by the red lower trajectories, and pHS, by the green upper trajectories. At the indicated time, we switched the extracellular solution from CO2/HCO3-free “ND96” to 1) CO2/HCO3 + 1 mM HEPES, or 2) CO2/HCO3 + 5 mM HEPES, or 3) CO2/HCO3 + 25 mM HEPES. The dashed black lines through the initial portions of the pHi transients for CO2 application represent the maximal rates of pHi change (negative direction) predicted by the model. The upward arrows near the pHS records represent maximal changes in pHS (positive direction).
Fig. 13.
Fig. 13.
Supra-additivity of simultaneous implementation of intracellular (i.e., cytosolic) and extracellular-surface CA activity. A: dependence of (dpHi/dt)max on Ai, for two fixed values of AS (i.e., surface CA isopleths), a replot of selected data from Fig. 8A. B: dependence of ΔpHS on Ai, for two fixed values of AS (i.e., surface CA isopleths), a replot of selected data from Fig. 8B. In all simulations for this figure, we assume that a hypothetical oocyte with the intracellular composition (i.e., initial pHi and ΔpHi) of a “CA IV” oocyte is exposed to a bulk solution containing 1.5% CO2/10 mM HCO3. The points labeled “∼Ctrl” represent our hypothetical oocyte but with the CA properties of a “control” oocyte (i.e., Ai = 5, on the 150 AS isopleth). The points labeled “∼CAII” represent our hypothetical oocyte but with the CA properties of a “CA II” oocyte (i.e., Ai = 1,000, on the 150 AS isopleth). These points (lavender vectors) approximate the physiologically observed (dpHi/dt)max and ΔpHS values for oocytes injected with CA II. The points labeled “CAS” represent a hypothetical oocyte but in which we raise AS to 10,000 but leave Ai = 5. These points (red vectors on left side of panels) represent (dpHi/dt)max and ΔpHS values that are far smaller than those physiologically observed with oocytes expressing CA IV. The points labeled “CAi” represent a hypothetical oocyte but in which we raise Ai to 40 but leave AS = 150. These points (blue vectors) represent (dpHi/dt)max and ΔpHS values that are far smaller than those physiologically observed with oocytes expressing CA IV. The sum of the red and blue vectors produce the brown vectors, which indicate the effects of simply adding CAi and CAo. Note that the asterisks (at the head of the brown vectors) represent (dpHi/dt)max and ΔpHS values that are still much smaller than those physiologically observed with oocytes expressing CA IV. Finally, the points labeled “CAIV” represent the combination of simultaneously raising AS from 150 to 10,000 and raising Ai from 5 to 40 in our simulations (green vectors). These points do indeed approximate the physiologically observed (dpHi/dt)max and ΔpHS values of oocytes expressing CA IV.

Similar articles

Cited by

References

    1. Alessandrini A, Gavazzo P, Picco C, Facci P. Voltage-induced morphological modifications in oocyte membranes containing exogenous K+ channels studied by electrochemical scanning force microscopy. Microsc Res Tech 71: 274–278, 2008 - PubMed
    1. Bevensee MO, Boron WF. Control of intracellular pH. In: Seldin and Giebisch's The Kidney: Physiology & Pathophysiology. New York: Academic, 2013, p. 1773–1835
    1. Boron W. Acid-base physiology. In: Medical Physiology, edited by Boron W, Boulpaep E. Philadelphia, PA: Saunders Elsevier, 2012, p. 652–671
    1. Boron WF, Endeward V, Gros G, Musa-Aziz R, Pohl P. Intrinsic CO2 permeability of cell membranes and potential biological relevance of CO2 channels. Chemphyschem 12: 1017–1019, 2011 - PubMed
    1. Boron WF, De Weer P. Intracellular pH transients in squid giant axons caused by CO2, NH3, and metabolic inhibitors. J Gen Physiol 67: 91–112, 1976 - PMC - PubMed

Publication types