. 2014 Nov 1;307(9):C814-40.
doi: 10.1152/ajpcell.00050.2014. Epub 2014 Jun 25.

Evidence from simultaneous intracellular- and surface-pH transients that carbonic anhydrase IV enhances CO2 fluxes across Xenopus oocyte plasma membranes

Affiliations

Evidence from simultaneous intracellular- and surface-pH transients that carbonic anhydrase IV enhances CO2 fluxes across Xenopus oocyte plasma membranes

Raif Musa-Aziz et al. Am J Physiol Cell Physiol. .

Abstract

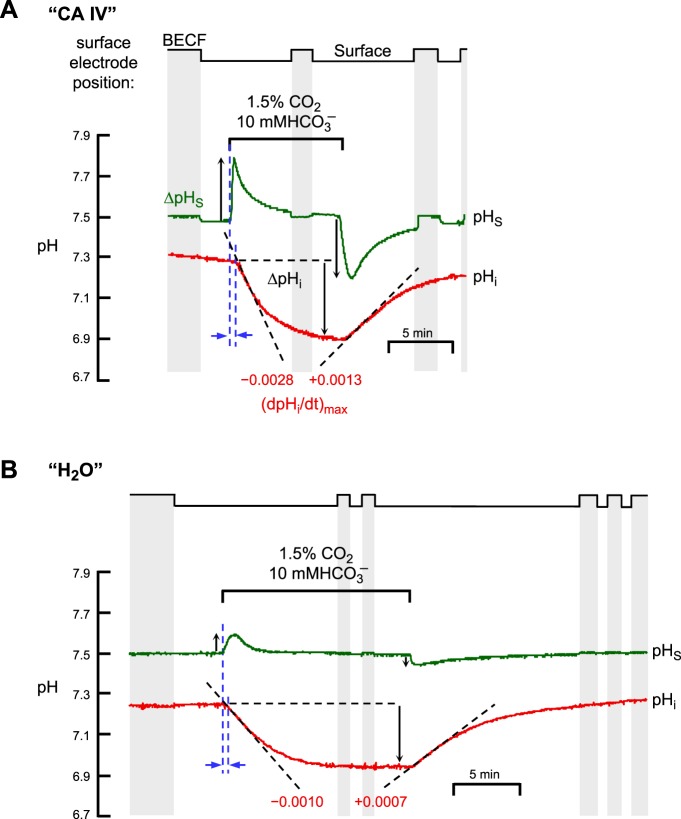
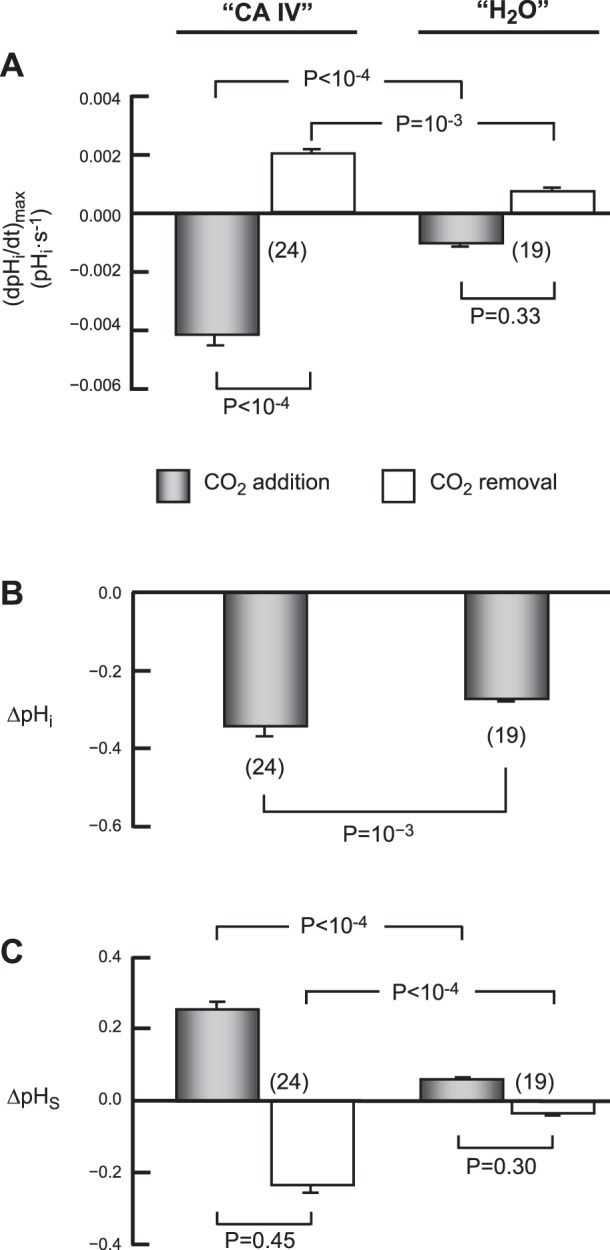
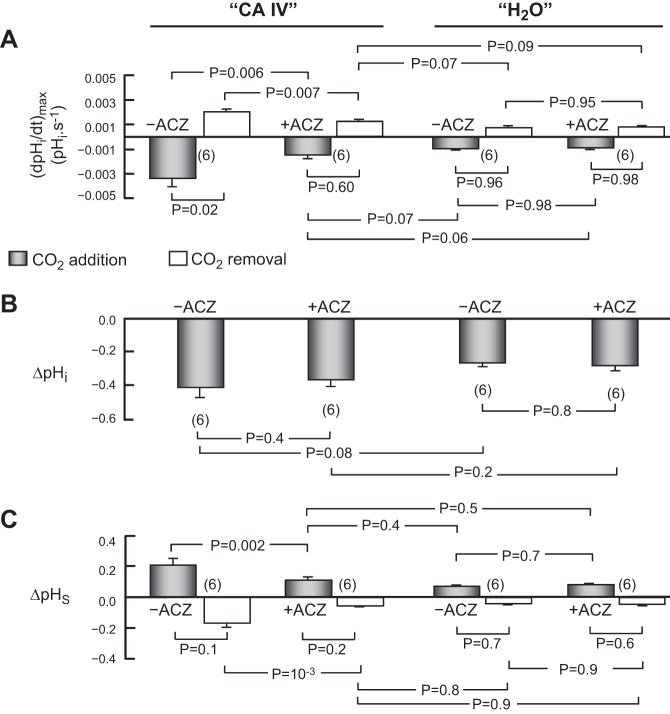
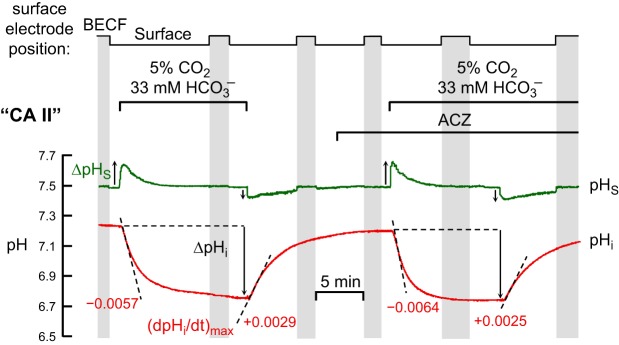
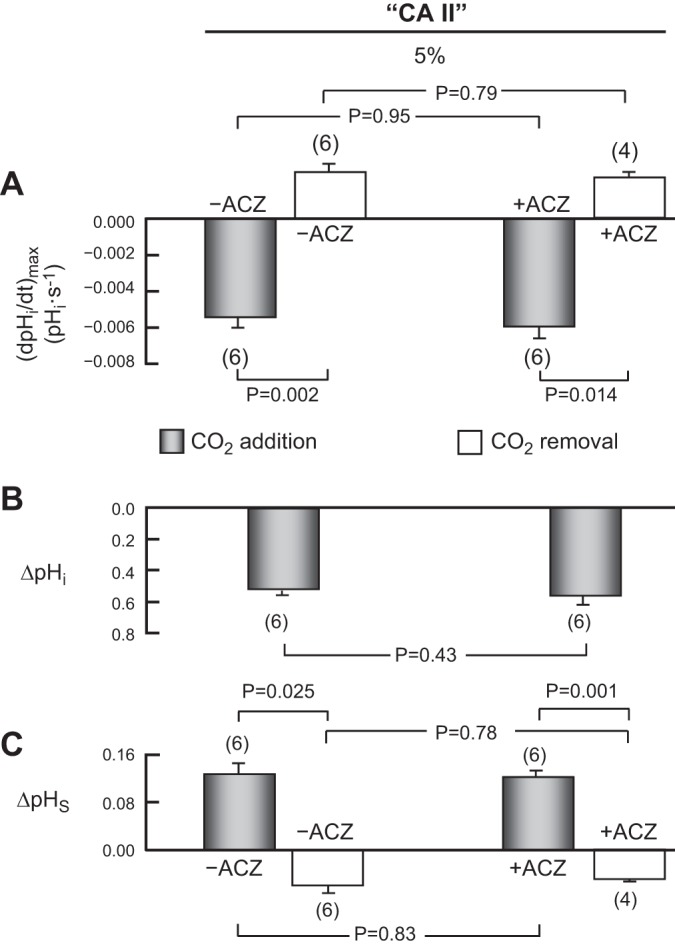
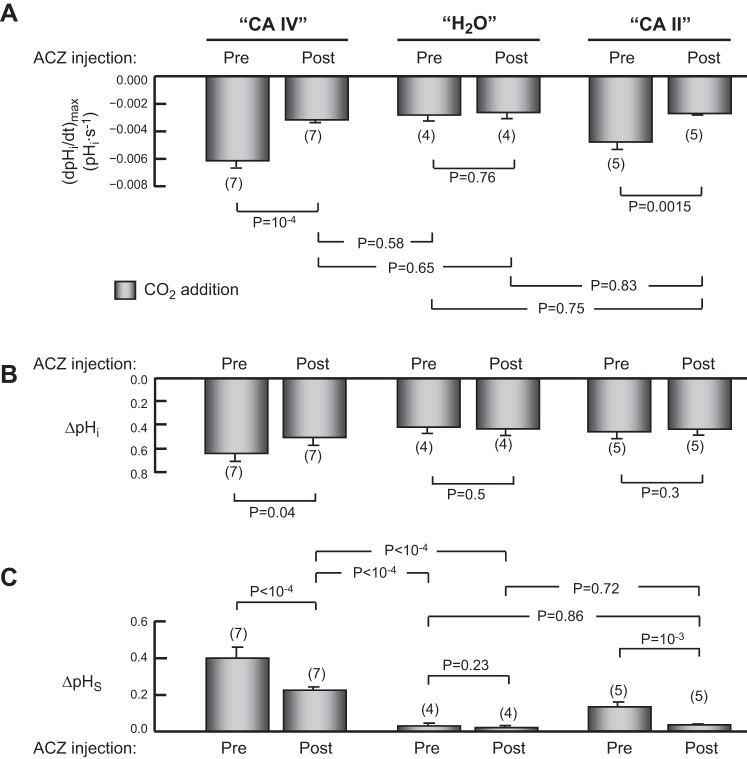
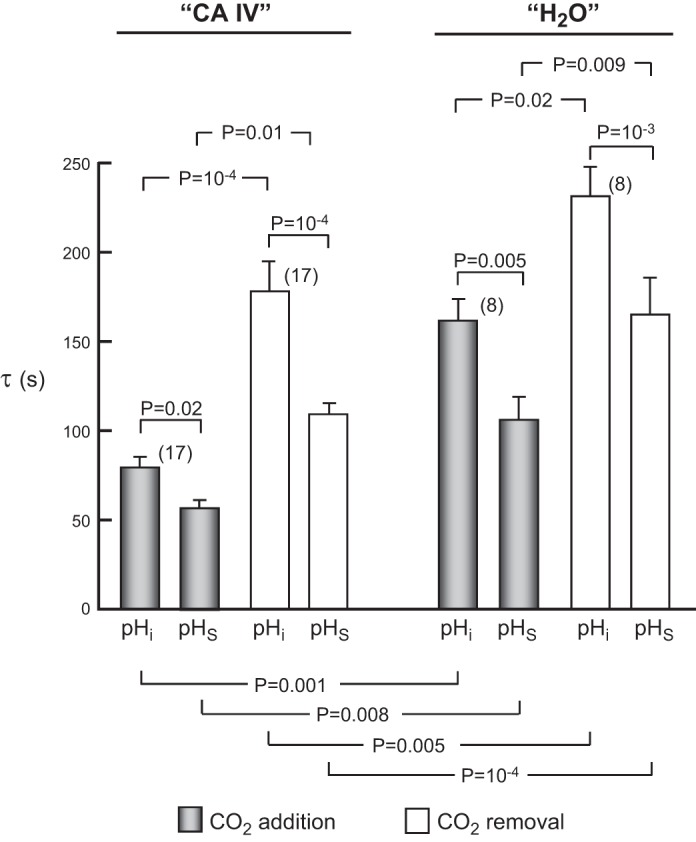
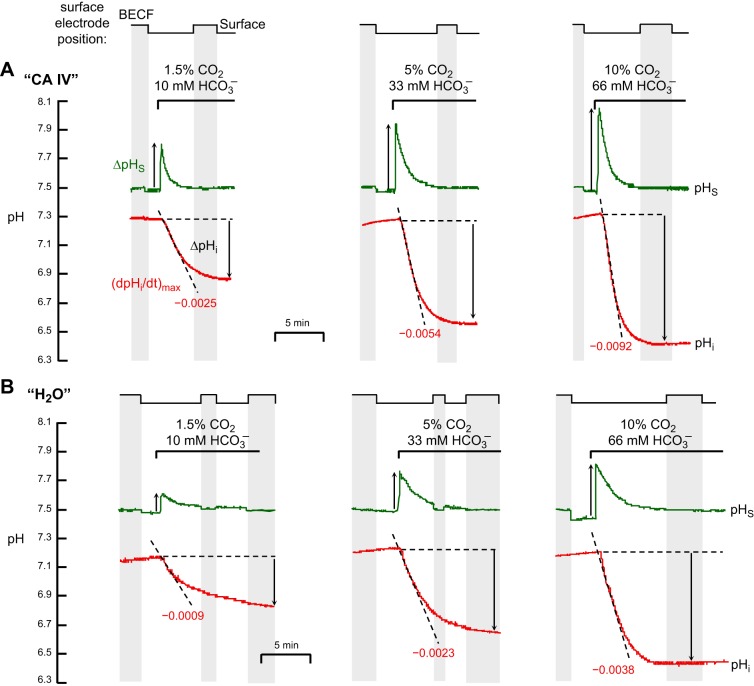
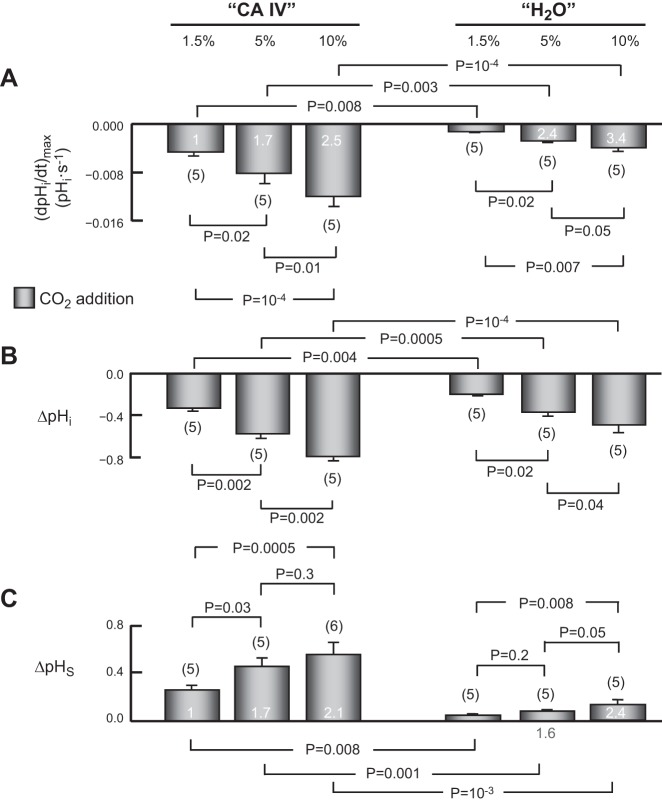
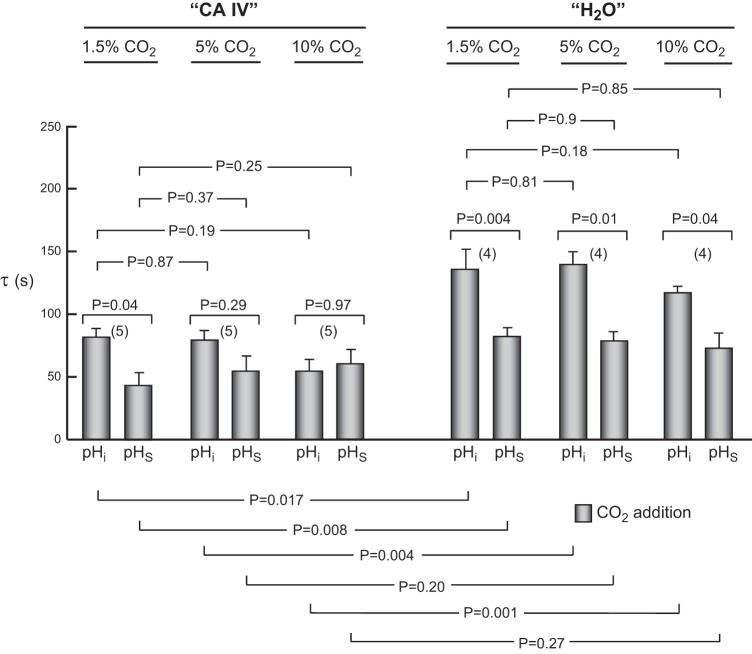
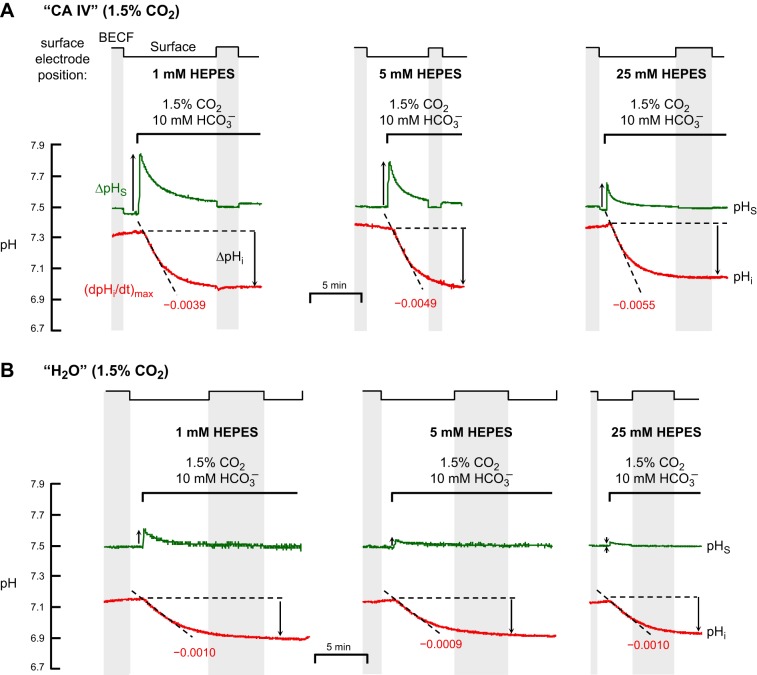
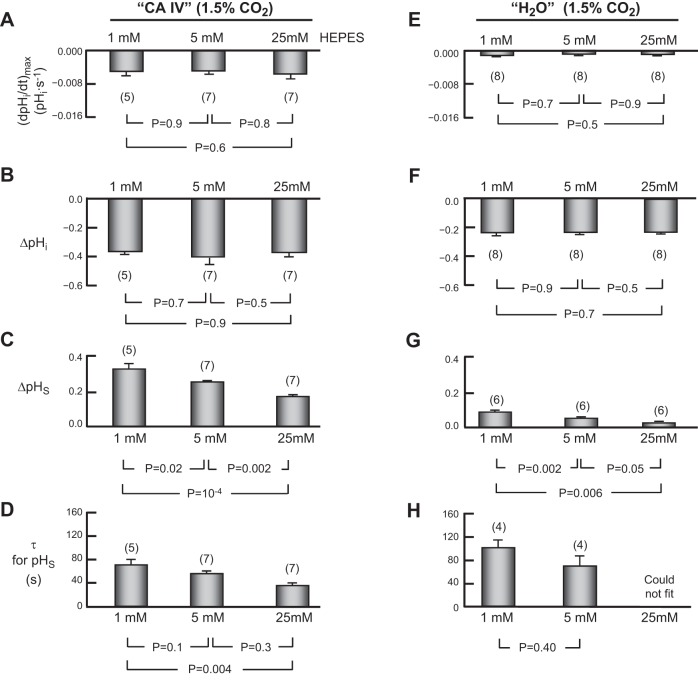
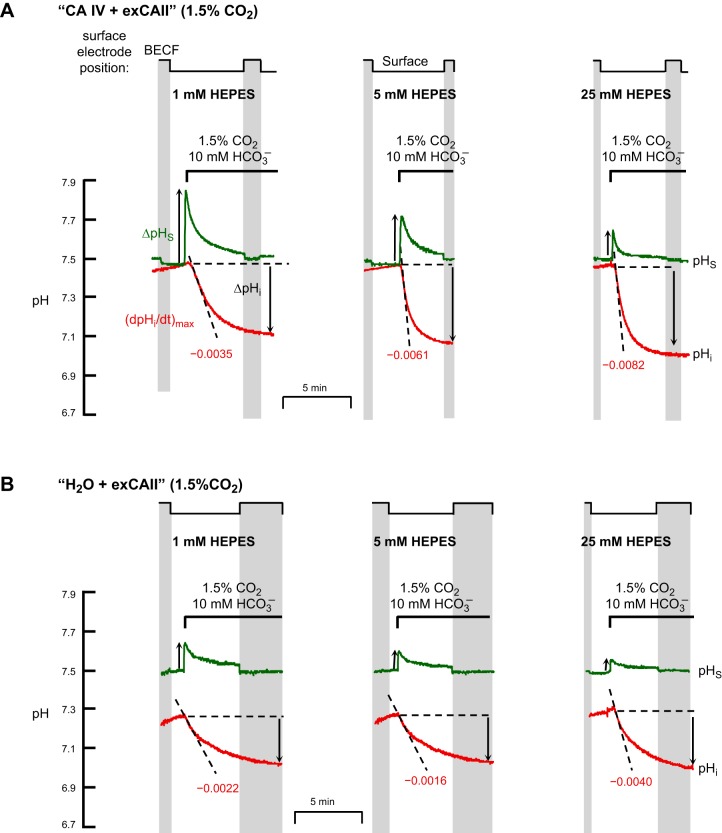
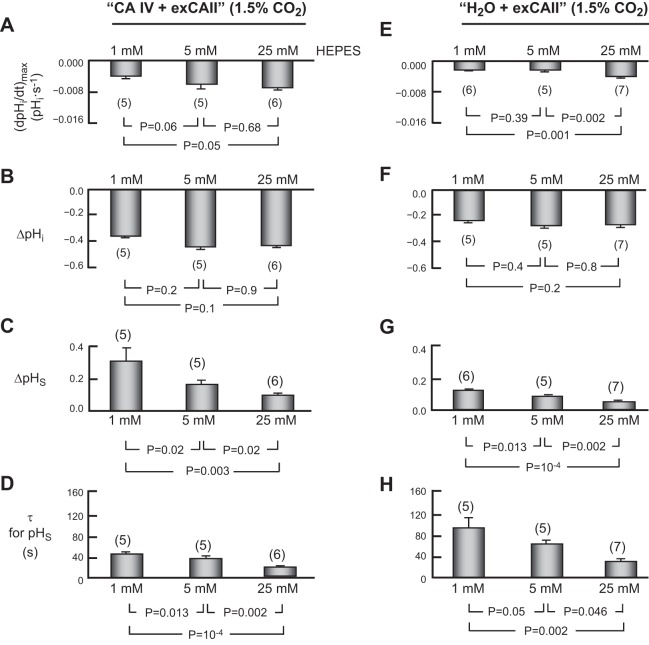
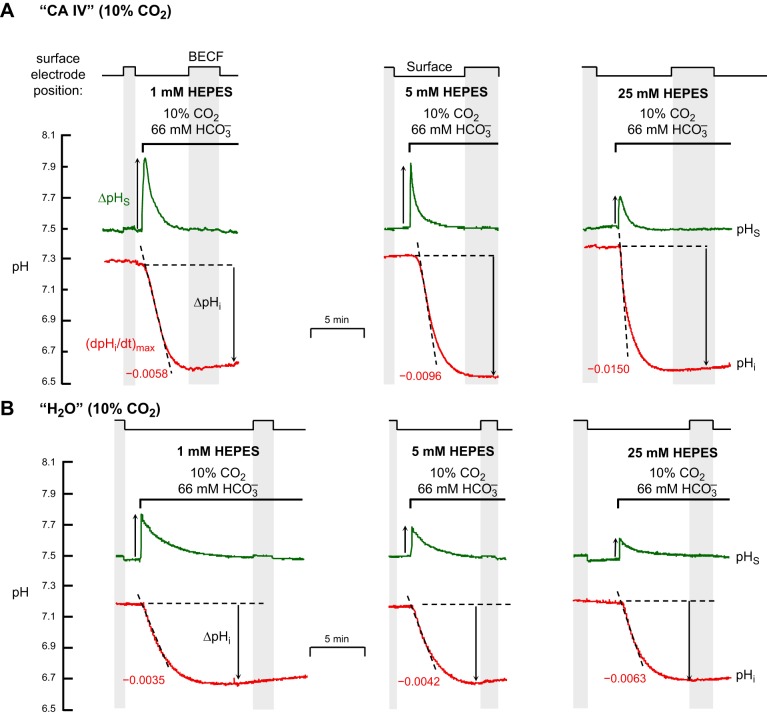
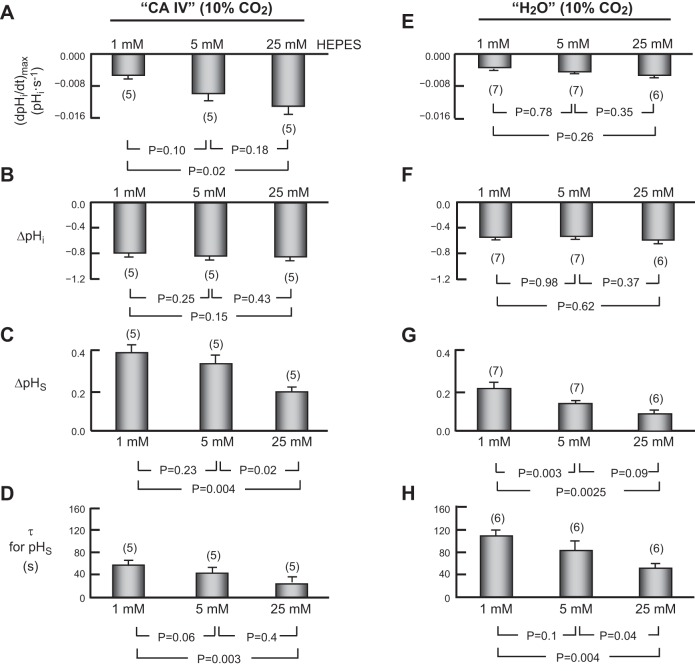
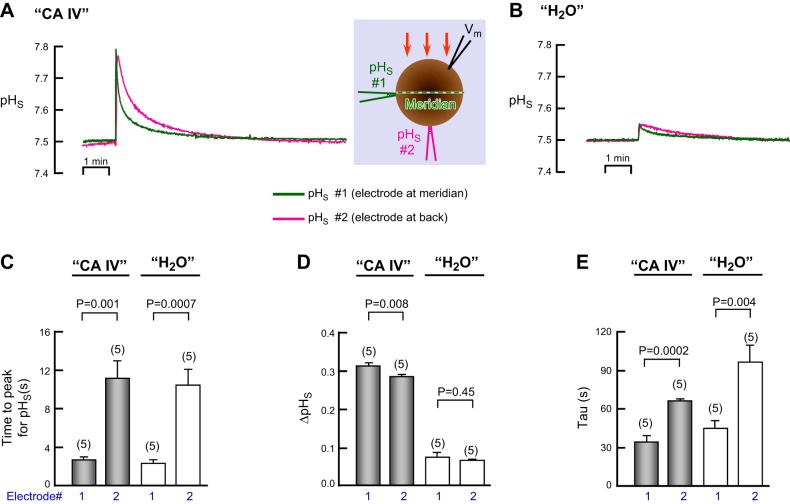
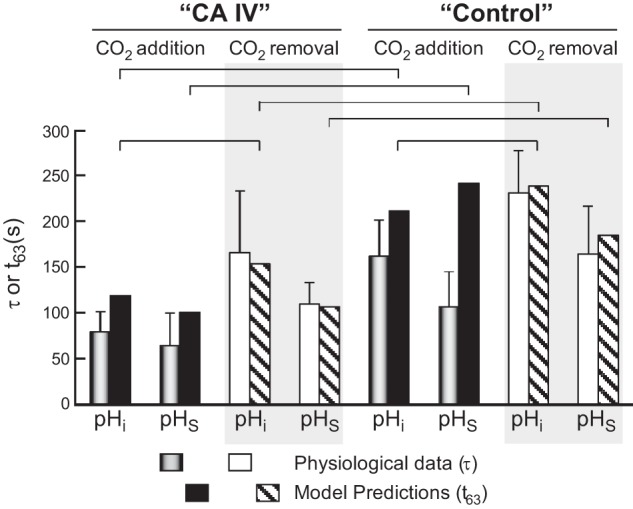
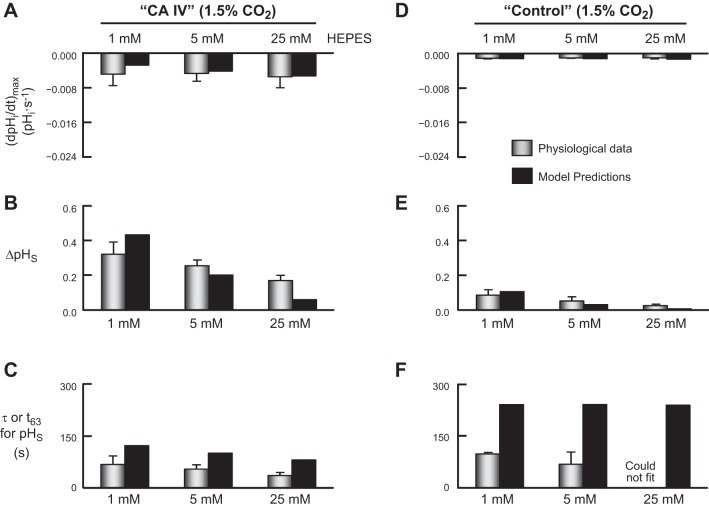
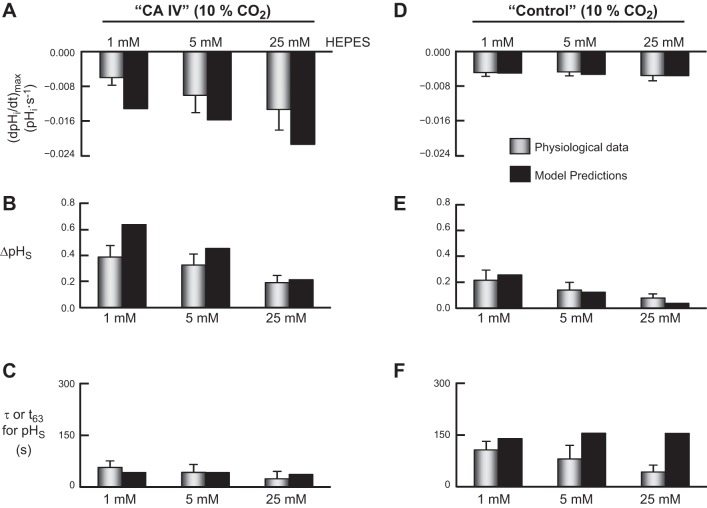
Human carbonic anhydrase IV (CA IV) is GPI-anchored to the outer membrane surface, catalyzing CO2/HCO3 (-) hydration-dehydration. We examined effects of heterologously expressed CA IV on intracellular-pH (pHi) and surface-pH (pHS) transients caused by exposing oocytes to CO2/HCO3 (-)/pH 7.50. CO2 influx causes a sustained pHi fall and a transient pHS rise; CO2 efflux does the opposite. Both during CO2 addition and removal, CA IV increases magnitudes of maximal rate of pHi change (dpHi/dt)max, and maximal pHS change (ΔpHS) and decreases time constants for pHi changes (τpHi ) and pHS relaxations (τpHS ). Decreases in time constants indicate that CA IV enhances CO2 fluxes. Extracellular acetazolamide blocks all CA IV effects, but not those of injected CA II. Injected acetazolamide partially reduces CA IV effects. Thus, extracellular CA is required for, and the equivalent of cytosol-accessible CA augments, the effects of CA IV. Increasing the concentration of the extracellular non-CO2/HCO3 (-) buffer (i.e., HEPES), in the presence of extracellular CA or at high [CO2], accelerates CO2 influx. Simultaneous measurements with two pHS electrodes, one on the oocyte meridian perpendicular to the axis of flow and one downstream from the direction of extracellular-solution flow, reveal that the downstream electrode has a larger (i.e., slower) τpHS , indicating [CO2] asymmetry over the oocyte surface. A reaction-diffusion mathematical model (third paper in series) accounts for the above general features, and supports the conclusion that extracellular CA, which replenishes entering CO2 or consumes exiting CO2 at the extracellular surface, enhances the gradient driving CO2 influx across the cell membrane.

Keywords: HEPES; acetazolamide; electrophysiology; ion-sensitive microelectrodes; mathematical modeling.


Figures

Fig. 1.
Fig. 1.
Representative experiments showing effects of carbonic anhydrase IV (CA IV) on intracellular pH (pHi) and surface pH (pHS) changes evoked by application and removal of CO2/HCO3. A: oocytes expressing human CA IV. (dpHi/dt)max, maximal rate of pHi change; BECF, bulk extracellular fluid. B: oocytes injected only with H2O. Both in “CA IV” or “H2O” oocytes, the pHi trace is represented by the red lower record, and pHS, by the green upper record. At the indicated times, we switched the extracellular solution from ND96 to 1.5% CO2/10 mM HCO3/pH 7.50 (see Table 1 in the first paper in this series; ref. 18) and then back again. In this example, the extracellular solution flowed at 3 ml/min and the sampling rate was 1 per 500 ms. The vertical gray bands represent periods during which the pHS electrode was withdrawn to the BECF for calibration. At other times the pHS electrode was dimpling ∼40 μm into the oocyte surface. The left and right blue, dashed vertical lines represent the initiation of the pHS and pHi transients, respectively. The dashed black lines through the initial portions of the pHi records for CO2 application and removal represent best linear fits for maximal rates of pHi change (negative or positive direction). The downward vertical arrows near the pHi records represent CO2-induced changes in steady-state pHi. The upward and downward arrows near the pHS records represent maximal changes in pHS (positive or negative direction).
Fig. 2.
Fig. 2.
Summary of effects of CA IV on pHi and pHS. This figure summarizes results from a larger number of experiments, such as those in Fig. 1, on oocytes expressing CA IV or injected only with H2O. In each case, we switched the extracellular solution from ND96 to 1.5% CO2/10 mM HCO3 (gray bars) and vice versa (white bars). A: maximal rates of pHi change (negative or positive direction) produced by the extracellular solution switch. This summary includes all oocytes expressing CA IV (and exposed to 1.5% CO2 in 5 mM HEPES) in the present study, as well as their day-matched H2O-injected controls. B: changes in steady-state pHi induced by the addition of CO2/HCO3. C: maximal changes in pHS (positive or negative direction) caused by the extracellular solution switch. Values are means ± SE, with nos. of oocytes in parentheses. We performed a one-way ANOVA in B and C (overall P values: P < 10−4 in A, and P < 10−4 in C), followed by a Student-Newman-Keuls (SNK) analysis (P shown for individual comparisons). We performed a paired t-test in B. The mean initial pHi for “CA IV” oocytes was 7.38 ± 0.024 (n = 26) and for “H2O” oocytes was 7.28 ± 0.025 (n = 19; one-way ANOVA, P = 0.001).
Fig. 3.
Fig. 3.
Representative experiments showing effects of acetazolamide (ACZ) on pHi and pHS. A: oocyte expressing human CA IV. B: H2O-injected oocyte. The pHi and pHS records were obtained from the same oocytes. The extracellular solutions were ND96 at the beginning of the experiment and, during the indicated time, 1.5% CO2/10 mM HCO3/pH 7.50 (see Table 1 in the first paper in this series; ref. 18). Both solutions were supplemented, as indicated, with 600 μM ACZ. Control experiments (not shown) on “CA IV” oocytes showed that a second pulse of CO2/HCO3, in the absence of ACZ, produced pHi and pHS transients that were indistinguishable from the first pulse (n = 4). In both A and B, the solution flowed at 3 ml/min and the sampling rate was 1 per 500 ms. The vertical gray bands represent periods during which the pHS electrode was withdrawn to the BECF for calibration. The dashed black lines through the initial portions of the pHi records for CO2 application and removal represent best linear fits for maximal rates of pHi change (negative or positive direction). The downward vertical arrows represent CO2-induced changes in steady-state pHi. The upward and downward vertical arrows near the pHS records represent maximal CO2-induced changes in pHS (positive or negative direction).
Fig. 4.
Fig. 4.
Summary of the effects of extracellular ACZ on pHi and pHS. This figure summarizes data relating to CO2 addition and removal from a larger number of experiments, such as those in Fig. 3, on oocytes expressing CA IV or injected with H2O. After the first assay, during which we switched the extracellular solution from ND96 to 1.5% CO2/10 mM HCO3 and then back again, in the absence of ACZ (−ACZ), we exposed the same oocyte to 600 μM ACZ and then repeated the assay (+ACZ). A: maximal rates of pHi change (negative or positive direction) produced by the extracellular solution switch. B: changes in steady-state pHi produced by the switch to CO2/HCO3. C: maximal changes in pHS (positive or negative direction) produced by the extracellular solution switch. Values are means ± SE, with nos. of oocytes in parentheses. We performed a one-way ANOVA (overall P values: P = 0.0005 in A, P = 0.06 in B, and P < 10−4 in C), followed by a Student-Newman-Keuls (SNK) analysis (P shown for individual comparisons). The mean initial pHi for “CA IV” oocytes was 7.37 ± 0.02 (n = 8) and for “H2O” oocytes was 7.25 ± 0.025 (n = 6; one-way ANOVA, P = 0.046).
Fig. 5.
Fig. 5.
Representative experiment showing effects of extracellular ACZ on pHi and pHS in an oocyte injected with CA II. The pHi and pHS records were obtained from the same oocyte. The extracellular solution was ND96 at the beginning of the experiment and, during the indicated time, 5% CO2/33 mM HCO3/pH 7.50 (see Table 1 in the first paper in this series; ref. 18). Both solutions were supplemented, as indicated, with 600 μM ACZ. The solution flowed at 3 ml/min and the sampling rate was 1 per 500 ms. The vertical gray bands represent periods during which the pHS electrode was withdrawn to the BECF for calibration. The dashed black lines through the initial portions of the pHi records for CO2 application and removal represent best linear fits for maximal rates of pHi change (negative or positive direction). The downward vertical arrows represent CO2-induced changes in steady-state pHi. The upward and downward vertical arrows near the pHS records represent maximal CO2-induced changes in pHS (positive or negative direction).
Fig. 6.
Fig. 6.
Summary of the effects of extracellular ACZ in “CA II” oocytes. This figure summarizes data relating to CO2 addition and removal from a larger number of experiments such as those in Fig. 5. After the first assay, during which we switched the extracellular solution from ND96 to 5% CO2/33 mM HCO3 and then back again, in the absence of ACZ (−ACZ), we exposed the same oocyte to 600 μM ACZ and then repeated the assay (+ACZ). A: maximal rates of pHi change (negative or positive direction) produced by the extracellular solution switch. B: changes in steady-state pHi produced by the switch to CO2/HCO3. C: maximal changes in pHS (positive or negative direction) produced by the extracellular solution switch. Values are means ± SE, with nos. of oocytes in parentheses. We performed a one-way ANOVA (overall P values: P = 0.0008 in A and P = 0.004 in C), followed by a Student-Newman-Keuls (SNK) analysis (P shown for individual comparisons). We performed a paired t-test in B. The average initial pHi for “CA II” oocytes in the CO2/HCO3-free ND96 solution was 7.27 ± 0.02 (n = 6), which is not significantly different from the value reported for “CA II” oocytes in the first paper (18) in this series (7.21 ± 0.05, n = 16; P = 0.52, unpaired t-test).
Fig. 7.
Fig. 7.
Summary of the effects of injected ACZ in “CA IV” oocytes. This figure summarizes data from experiments (not shown) in which 1) we monitored pHi and pHS while exposing oocytes to a solution containing 5% CO2/33 mM HCO3 (Pre-ACZ injection) and then withdrew the CO2/HCO3; 2) we removed the oocytes from the chamber and injected them with ACZ, and, after ∼3 h, 3) we repeated the electrophysiological assay (Post-ACZ injection). A: maximal rates of pHi change (negative direction) produced by the extracellular addition of CO2/HCO3. B: changes in steady-state pHi produced by the switch to CO2/HCO3. C: maximal changes in pHS (positive direction) produced by the extracellular addition of CO2/HCO3. Values are means ± SE, with nos. of oocytes in parentheses. We performed a one-way ANOVA (overall P values: P < 10−4 in A, P = 0.004 in B, and P < 10−4 in C), followed by a Student-Newman-Keuls (SNK) analysis (P shown for individual comparisons). The average initial pHi in the CO2/HCO3-free ND96 solution was 7.39 ± 0.01 (n = 7) for “CA IV” oocytes, 7.21 ± 0.01 (n = 4) for “H2O” oocytes, and 7.24 ± 0.03 (n = 5) for “CA II” oocytes.
Fig. 8.
Fig. 8.
Summary of time constants (τ) for pHi and pHS changes for a larger number of experiments, such as those in Fig. 1, on oocytes expressing CA IV or injected with H2O. Values are means ± SE, with nos. of oocytes in parentheses. We performed a one-way ANOVA (overall P value: P < 10−4) followed by a Student-Newman-Keuls (SNK) analysis (P shown for individual comparisons).
Fig. 9.
Fig. 9.
Representative experiments showing the effect of graded increases in extracellular CO2/HCO3 levels on pHi and pHS. A: oocyte expressing CA IV. B: oocyte injected with H2O. A and B each represent an experiment on a single oocyte. The pHi trace is represented by the red lower record, and pHS, by the green upper record. At the indicated times, we switched the extracellular solution from 1) ND96 to 1.5% CO2/10 mM HCO3 (left), or 2) ND96 to 5% CO2/33 mM HCO3 (center), or 3) ND96 to 10% CO2/66 mM HCO3 (right). After the first two CO2/HCO3 exposures, we restored the ND96 solution (not shown). For both oocytes, the solution flowed at 3 ml/min and the sampling rate was 1 per 500 ms. The vertical gray bands represent periods during which the pHS electrode was moved to the BECF for calibration. The dashed black lines through the initial portions of the pHi records for CO2 application represent best linear fits for maximal rates of pHi change (negative direction). The downward vertical arrows represent CO2-induced changes in steady-state pHi. The upward vertical arrows represent the maximal excursion of pHS (positive direction).
Fig. 10.
Fig. 10.
Summary of effects of graded increases of extracellular CO2/HCO3 levels on pHi and pHS. This figure summarizes results from a larger number of experiments, such as those in Fig. 9, on oocytes expressing CA IV or injected with H2O. A: maximal rates of pHi change (negative direction) produced by the introduction of extracellular CO2/HCO3. B: changes in steady-state pHi induced by the addition of CO2/HCO3. C: maximal changes in pHS (positive direction) caused by the addition of CO2/HCO3. Values are means ± SE, with nos. of oocytes in parentheses. The white numerals are the ratios of mean values, relative to the value at 1.5% CO2. We performed a one-way ANOVA (overall P values: P < 10−4 in A, in B, and in C) followed by a Student-Newman-Keuls (SNK) analysis (P shown for individual comparisons). For all experiments, the solution flowed at 3 ml/min and the sampling rate was 1 per 500 ms.
Fig. 11.
Fig. 11.
Summary of time constants (τ) for pHi and pHS changes for a larger number of experiments, such as those in Fig. 10, on oocytes expressing CA IV or injected with H2O. Values are means ± SE, with nos. of oocytes in parentheses. We performed a one-way ANOVA (overall P < 10−4) followed by a Student-Newman-Keuls (SNK) analysis (P shown for individual comparisons).
Fig. 12.
Fig. 12.
Representative experiments showing the effect of 1.5% CO2/10 mM HCO3 with graded increases in HEPES levels on pHi and pHS. A: oocyte expressing CA IV. B: oocyte injected with H2O. A and B each represent an experiment on a single oocyte. The pHi trace is represented by the red lower record, and pHS, by the green upper record. At the indicated times, we switched the extracellular solution from ND96 to 1) CO2/HCO3 + 1 mM HEPES, or 2) CO2/HCO3 + 5 mM HEPES, or 3) CO2/HCO3 + 25 mM HEPES (see Table 1 in the first paper in this series; ref. 18). After the first two CO2/HCO3 exposures, we restored the ND96 solution (not shown). For both oocytes, the solution flowed at 3 ml/min and the sampling rate was 1 per 500 ms. The vertical gray bands represent periods during which the pHS electrode was moved to the BECF for calibration. The dashed black lines through the initial portions of the pHi records for CO2 application represent best linear fits for maximal rates of pHi change (negative direction). The downward vertical arrows represent the CO2-induced change in steady-state pHi. The upward vertical arrows represent the maximal excursion of pHS (positive direction).
Fig. 13.
Fig. 13.
Summary of the effect of graded increases in extracellular HEPES levels on pHi and pHS. This figure summarizes results from a larger number of experiments, such as those in Fig. 12, A and B. A and E: maximal rates of pHi change (negative direction) produced by the introduction of extracellular CO2/HCO3. B and F: changes in steady-state pHi induced by the addition of CO2/HCO3. C and G: maximal changes in pHS (positive direction) caused by the addition of CO2/HCO3. D and H: time constants for pHS decay (τpHS) caused by the addition of CO2/HCO3. Values are means ± SE, with nos. of oocytes in parentheses. We performed a one-way ANOVA (overall P values: P < 10−4 for A with E, B with F, and C with G, and P = 0.0009 for D with H) followed by a Student-Newman-Keuls (SNK) analysis (P shown for individual comparisons). For all experiments, the solution flowed at 3 ml/min and the sampling rate was 1 per 500 ms.
Fig. 14.
Fig. 14.
Representative experiments showing the effect of 1.5% CO2/10 mM HCO3 with graded increases in HEPES levels (+ extracellular bovine CA II = 0.1 mg/ml) on pHi and pHS. A: oocyte expressing CA IV. B: oocyte injected with H2O. A and B each represent an experiment on a single oocyte. The pHi trace is represented by the red lower record, and pHS, by the green upper record. At the indicated time, we switched the extracellular (ex) solution from ND96 to 1) CO2/HCO3 + 1 mM HEPES, or 2) CO2/HCO3 + 5 mM HEPES, or 3) CO2/HCO3 + 25 mM HEPES (see Table 1 in the first paper in this series; ref. 18). After the first two CO2/HCO3 exposures, we restored the ND96 solution (not shown). For both oocytes, the solution flowed at 3 ml/min and the sampling rate was 1 per 500 ms. The vertical gray bands represent periods during which the pHS electrode was moved to the BECF for calibration. The dashed black lines through the initial portions of the pHi records for CO2 application represent best linear fits for maximal rates of pHi change (negative direction). The downward vertical arrows represent the CO2-induced change in steady-state pHi. The upward vertical arrows represent the maximal excursion of pHS (positive direction).
Fig. 15.
Fig. 15.
Summary of the effect of graded increases in extracellular HEPES levels on pHi and pHS (+ extracellular bovine CA II = 0.1 mg/ml). This figure summarizes results from a larger number of experiments, such as those in Fig. 14, A and B. A and E: maximal rates of pHi change (negative direction) produced by the introduction of extracellular CO2/HCO3. B and F: changes in steady-state pHi induced by the addition of CO2/HCO3. C and G: maximal changes in pHS (positive direction) caused by the addition of CO2/HCO3. D and H: time constants for pHS decay (τpHS) caused by the addition of CO2/HCO3. Values are means ± SE, with nos. of oocytes in parentheses. We performed a one-way ANOVA (overall P values: P < 10−4 for A with E, B with F, C with G, and D with H) followed by a Student-Newman-Keuls (SNK) analysis (P shown for individual comparisons). For all experiments, the solution flowed at 3 ml/min and the sampling rate was 1 per 500 ms.
Fig. 16.
Fig. 16.
Representative experiments showing the effect of 10% CO2/66 mM HCO3 with graded increases in HEPES levels on pHi and pHS. A: oocyte expressing CA IV. B: oocyte injected with H2O. A and B each represent an experiment on a single oocyte. The pHi trace is represented by the red lower record, and pHS, by the green upper record. At the indicated time, we switched the extracellular solution from ND96 to 1) CO2/HCO3 + 1 mM HEPES, or 2) CO2/HCO3 + 5 mM HEPES, or 3) CO2/HCO3 + 25 mM HEPES (see Table 1 in the first paper in this series; ref. 18). After the first two CO2/HCO3 exposures, we restored the ND96 solution (not shown). For both oocytes, the solution flowed at 3 ml/min and the sampling rate was 1 per 500 ms. The vertical gray bands represent periods during which the pHS electrode was moved to the BECF for calibration. The dashed black lines through the initial portions of the pHi records for CO2 application represent best linear fits for maximal rates of pHi change (negative direction). The downward vertical arrows represent the CO2-induced change in steady-state pHi. The upward vertical arrows represent the maximal excursion of pHS (positive direction).
Fig. 17.
Fig. 17.
Summary of the effect of graded increases in extracellular HEPES levels on pHi and pHS. This figure summarizes results from a larger number of experiments, such as those in Fig. 16, A and B. A and E: maximal rates of pHi change (negative direction) produced the introduction of extracellular CO2/HCO3. B and F: changes in steady-state pHi induced by the addition of CO2/HCO3. C and G: maximal changes in pHS (positive direction) caused by the addition of CO2/HCO3. D and H: time constants for pHS decay (τpHS) caused by the addition of CO2/HCO3. Values are means ± SE, with nos. of oocytes in parentheses. We performed a one-way ANOVA (overall P values: P < 10−4 for A with E, B with F, C with G, and D with H) followed by a Student-Newman-Keuls (SNK) analysis (P shown for individual comparisons). For all experiments, the solution flowed at 3 ml/min and the sampling rate was 1 per 500 ms.
Fig. 18.
Fig. 18.
Studies with dual pHS electrodes. A and B: representative experiments on an oocyte expressing CA IV (A) and an oocyte injected with H2O (B). The inset is a schematic top view of the oocyte (darker animal pole facing upward), showing the arrangement of microelectrodes; the red arrows show the direction of convective flow. The tip of electrode no. 1 is ∼5° downstream from the meridian perpendicular to the direction of bulk flow, and at the equator (border between the upward facing animal pole and downward facing vegetal pole of the oocyte); its pHS record is green. The tip of electrode no. 2 is at the back of the oocyte; its pHS record is magenta. In these experiments, the solution flowed at 3 ml/min and the sampling rate was 1 per 500 ms. CE: summary of experiments with dual pHS electrodes. These panels summarize results from a larger number of experiments, such as those in A and B. C shows time to peak for pHS produced by the introduction of extracellular CO2/HCO3. D shows maximal changes in pHS (positive direction) caused by the addition of CO2/HCO3. E shows time constants for pHS decay (τpHS) caused by the addition of CO2/HCO3. Values are means ± SE, with nos. of oocytes in parentheses. We performed a one-way ANOVA (overall P values: P = 0.00013 in C, P = 10−4 in D, and P < 10−4 in E) followed by a Student-Newman-Keuls (SNK) analysis (P shown for individual comparisons). For all experiments, the solution flowed at 3 ml/min and the sampling rate was 1 per 500 ms.
Fig. 19.
Fig. 19.
Predictions of the mathematical model for concentration-time profiles of CO2 for a “CA IV” oocyte (red curves) and a “Control” or “H2O” oocyte (brown curves). A: [CO2] near the intracellular surface of the plasma membrane (IM). B: [CO2] near the extracellular surface of the plasma membrane (EM). C: gradient of CO2 across the plasma membrane (PM), the result of subtracting values in B from corresponding values in A. Figure 20 illustrates the dimensions of the IM and EM regions. In modeling the “CA IV” oocyte, we implemented a large increase in CA activity on the extracellular surface of the oocyte, and a small increase in the cytosol. Details of the mathematical model are presented in the third paper in this series (21).
Fig. 20.
Fig. 20.
Predictions of the mathematical model for maximal CO2 diffusion and reaction fluxes near the plasma membrane during addition of 1.5% CO2/10 mM HCO3. A: “CA IV” oocyte. B: “Control” or “H2O” oocyte. B is identical to Fig. 12B in the first paper in this series (18). The parallel dark brown curves identify the plasma membrane (PM). The green curves to the left and right of the PM represent the spatial discretizations for the numerical solutions. The numbers near arrows 1 through 5 indicate the maximal diffusive fluxes (sharp arrowheads) and reaction fluxes (dull arrowheads) in units of μmol/s. These maximal fluxes occur within ∼1 s of each other. The diffusion/reaction ratio (DRR) is the quotient of flux no. 1/flux no. 4. Details of the mathematical model are presented in the third paper in this series (21).
Fig. 21.
Fig. 21.
Comparison of physiological τ data with t63 data predicted by the mathematical model. The physiological data are taken from Fig. 8; note that here we report the means ± standard deviation (and not SE, as in Fig. 8). The simulated “Control” data are identical to those in Fig. 13 in the first paper in this series (18). An apparent inconsistency arises when we compare pHS data from physiological experiments (time constant, τ) and simulations (time to 63% of completion, t63) for CO2 addition, under both CA IV and control conditions. The inconsistency probably arises, in part, because of the multiexponential decay of the simulated pHS trajectory, the special nature of the pHS trajectory beneath the pHS electrode, and the asymmetry of pHS over the oocyte surface. Details of the mathematical model are presented in the third paper (21).
Fig. 22.
Fig. 22.
Predictions of the mathematical model for maximal CO2 diffusion and reaction fluxes near the plasma membrane during removal of 1.5% CO2/10 mM HCO3. A: “CA IV” oocyte. B: “Control” or “H2O” oocyte. B is identical to Fig. 14B in the first paper in this series (18). The parallel dark brown curves identify the plasma membrane (PM). The green curves to the left and right of the PM represent the spatial discretizations for the numerical solutions. The numbers near arrows 1 through 5 indicate the maximal diffusive fluxes (sharp arrowheads) and reaction fluxes (dull arrowheads) in units of μmol/s. These maximal fluxes occur within ∼1 s of each other. The diffusion/reaction ratio (DRR) is the quotient of flux no. 1/flux no. 4. Details of the mathematical model are presented in the third paper in the series (21).
Fig. 23.
Fig. 23.
Comparison of physiological data with data predicted by the mathematical model during addition of 1.5% CO2/10 mM HCO3 with graded increases in HEPES levels. A and D: maximal rates of pHi change (negative direction) produced by the introduction of extracellular CO2/HCO3. B and E: maximal changes in pHS (positive direction) caused by the addition of CO2/HCO3. C and F: time constants for pHS decay in physiological experiments (τpHS) and time to 63% of completion (i.e., t63) for pHS decay predicted by mathematical model during the addition of CO2/HCO3. The physiological data are taken from Fig. 13; note that here we report the means ± standard deviation (and not SE, as in Fig. 13). Details of the mathematical model are presented in the third paper in this series (21).
Fig. 24.
Fig. 24.
Comparison of physiological data with data predicted by the mathematical model during addition of 10% CO2/66 mM HCO3 with graded increases in HEPES levels. A and D: maximal rates of pHi change (negative direction) produced by the introduction of extracellular CO2/HCO3. B and E: maximal changes in pHS (positive direction) caused by the addition of CO2/HCO3. C and F: time constants for pHS decay (τpHS) in physiological experiments and time to 63% of completion (i.e., t63) for pHS decay predicted by mathematical model during the addition of CO2/HCO3. The physiological data are taken from Fig. 17; note that here we report the means ± standard deviation (and not SE, as in Fig. 17). Details of the mathematical model are presented in the third paper in this series (21).

Similar articles

Cited by

References

    1. Becker HM, Deitmer JW. Carbonic anhydrase II increases the activity of the human electrogenic Na+/HCO3− cotransporter. J Biol Chem 282: 13508–13521, 2007 - PubMed
    1. Boron WF, De Weer P. Intracellular pH transients in squid giant axons caused by CO2, NH3, and metabolic inhibitors. J Gen Physiol 67: 91–112, 1976 - PMC - PubMed
    1. Brown D, Zhu XL, Sly WS. Localization of membrane-associated carbonic anhydrase type IV in kidney epithelial cells. Proc Natl Acad Sci USA 87: 7457–7461, 1990 - PMC - PubMed
    1. Busa WB, Nuccitelli R. Metabolic regulation via intracellular pH. Am J Physiol Regul Integr Comp Physiol 246: R409–R438, 1984 - PubMed
    1. Chesler M, Kaila K. Modulation of pH by neuronal activity. Trends Neurosci 15: 396–402, 1992 - PubMed

Publication types

LinkOut - more resources