. 2014 Jun 26;510(7506):512-7.
doi: 10.1038/nature13423. Epub 2014 Jun 18.

Structure of a modular polyketide synthase

Affiliations

Structure of a modular polyketide synthase

Somnath Dutta et al. Nature. .

Abstract

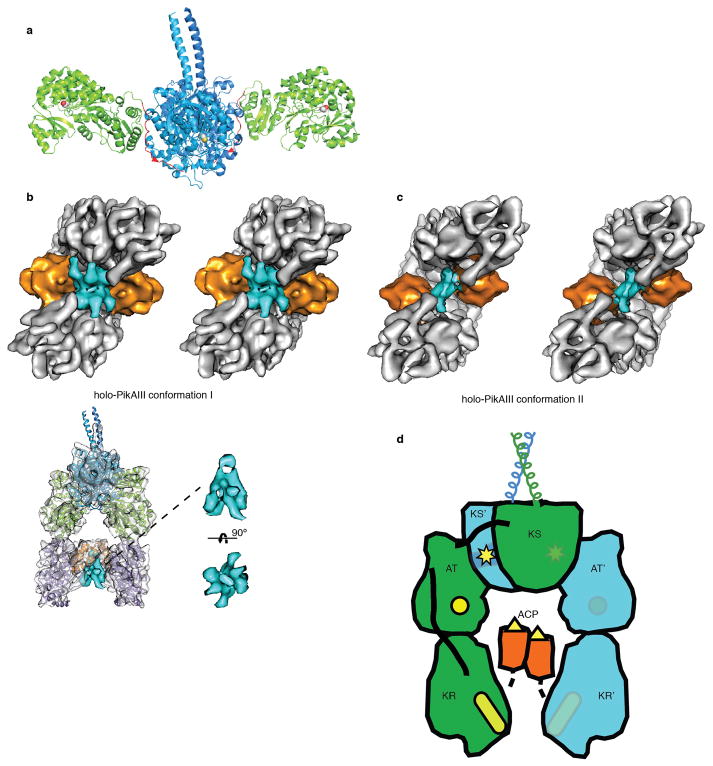
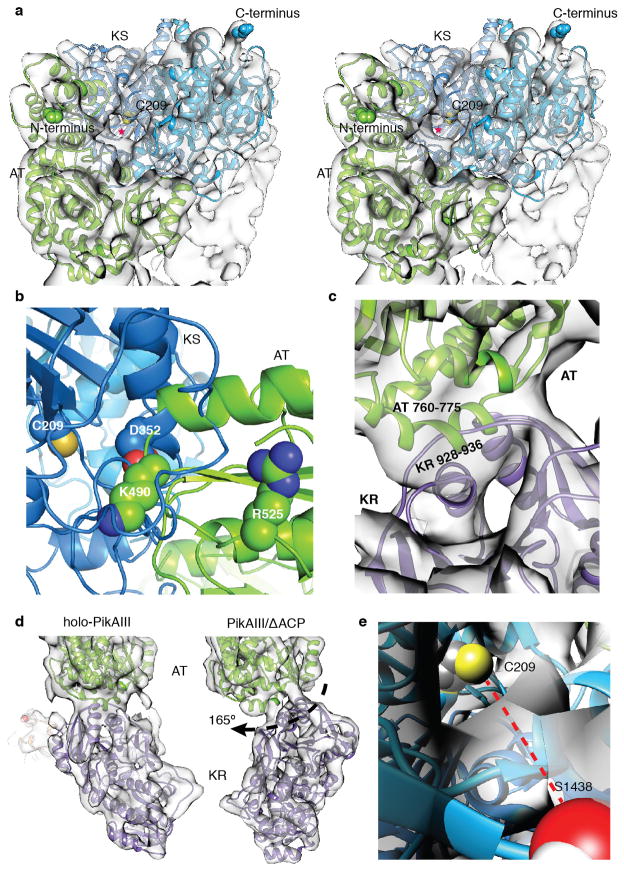
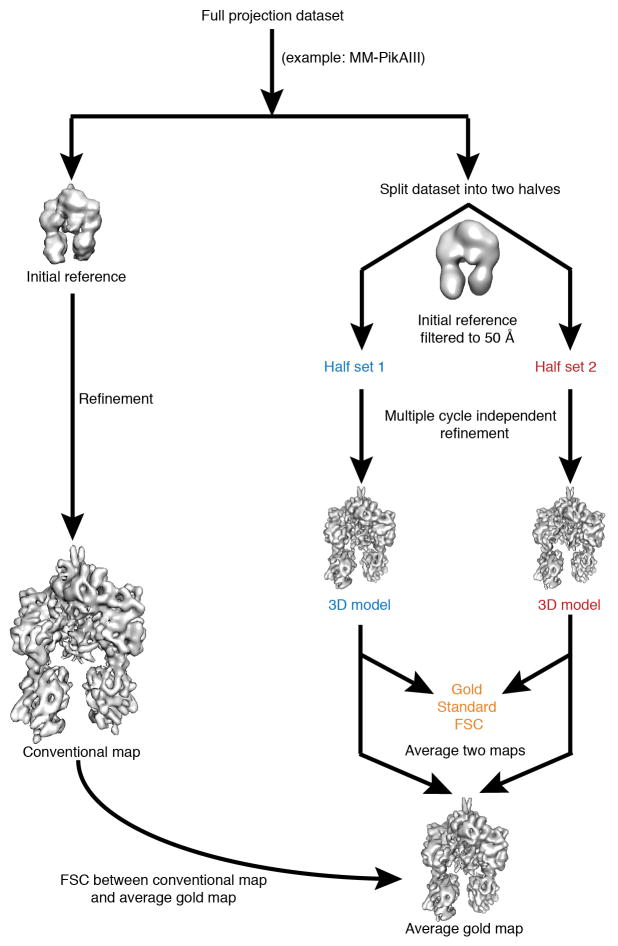
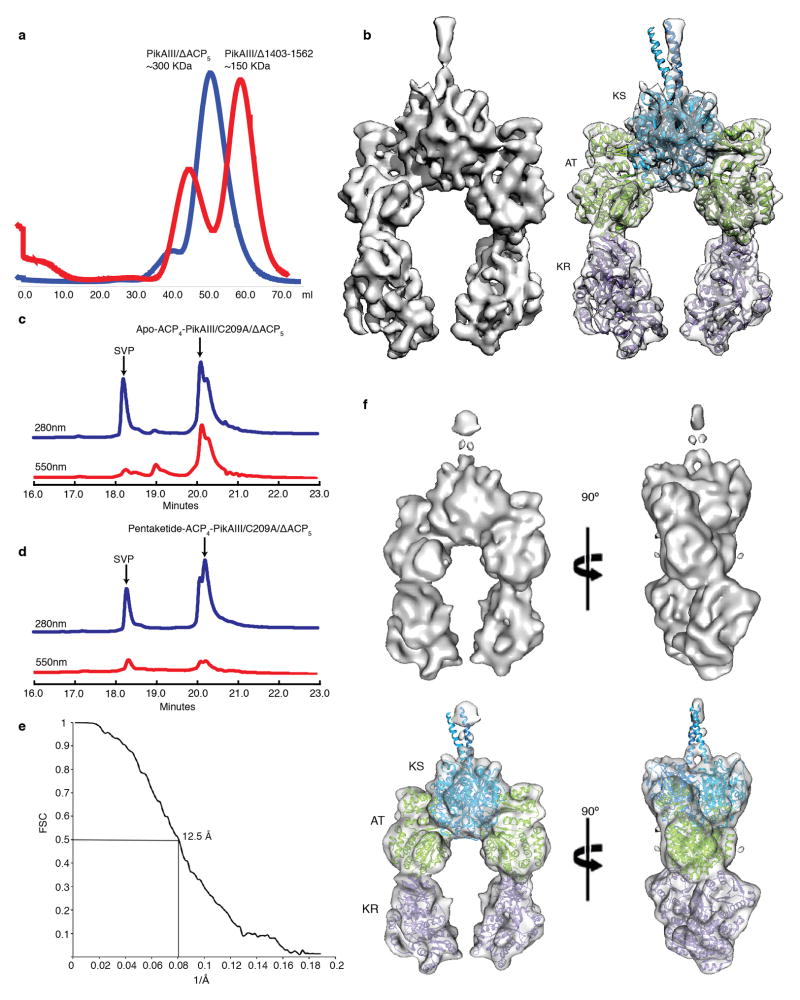
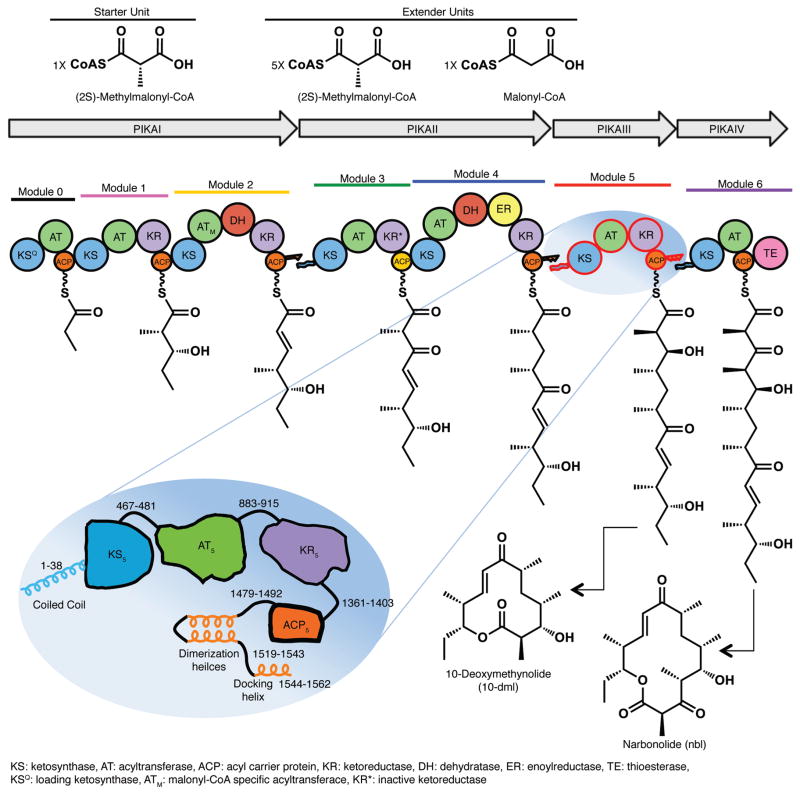
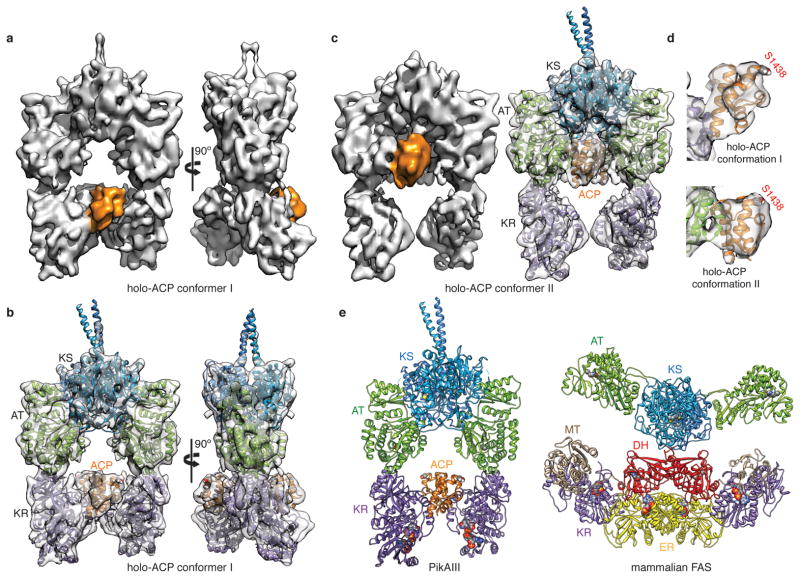
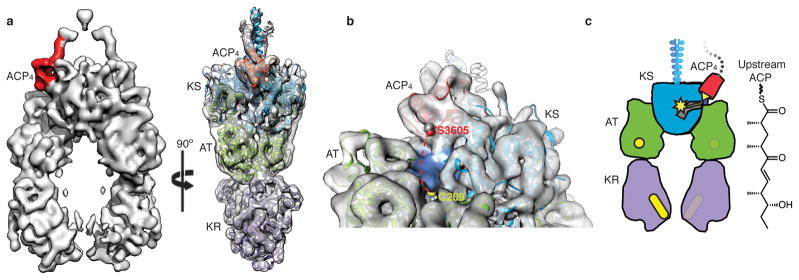
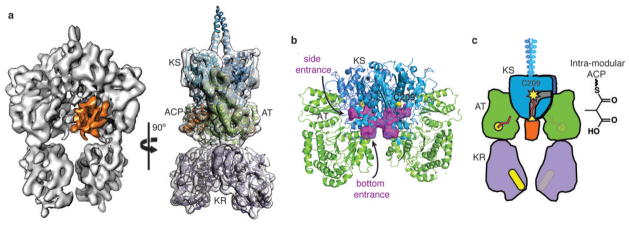
Polyketide natural products constitute a broad class of compounds with diverse structural features and biological activities. Their biosynthetic machinery, represented by type I polyketide synthases (PKSs), has an architecture in which successive modules catalyse two-carbon linear extensions and keto-group processing reactions on intermediates covalently tethered to carrier domains. Here we used electron cryo-microscopy to determine sub-nanometre-resolution three-dimensional reconstructions of a full-length PKS module from the bacterium Streptomyces venezuelae that revealed an unexpectedly different architecture compared to the homologous dimeric mammalian fatty acid synthase. A single reaction chamber provides access to all catalytic sites for the intramodule carrier domain. In contrast, the carrier from the preceding module uses a separate entrance outside the reaction chamber to deliver the upstream polyketide intermediate for subsequent extension and modification. This study reveals for the first time, to our knowledge, the structural basis for both intramodule and intermodule substrate transfer in polyketide synthases, and establishes a new model for molecular dissection of these multifunctional enzyme systems.


Figures

Extended Data Figure 1
PikAIII sample preparation and raw EM images. a, SDS-PAGE gel of each purified form of PikAIII examined by cryo-EM. The numbers on the left indicate molecular weight in kDa. b, Raw EM image of holo-PikAIII particles embedded in negative stain. c, Raw cryo-EM image of holo-PikAIII particles. d, Boxed-out particle projections of holo-PikAIII.
Extended Data Figure 2
PikAIII initial cryo-EM 3D reconstructions. a, Generation of initial MM-PikAIII reconstructions using 3,600 particle projections and employing three different starting models. Top: generation of a MM-PikAIII reconstruction using a randomized Gaussian sphere from makeinitialmodel.py in EMAN2. Middle: refinement of a starting model obtained by the EMAN2 initial-model-generation program e2initialmodel.py. Bottom: refinement starting from a low pass filtered model of the excised KS-AT di-domain crystal structure. These three different starting models converged to similar structures that are also in agreement with reference-free class averages. b, Comparison of re-projections of a low-resolution cryo-EM 3D map (iteration 28 of top panel in this figure) with reference-free 2D class averages and raw particle projections from both cryo-EM and negative stain PikAIII-MM data. c, Tilt pair parameter plot of PikAIII/ΔACP5 with a tilt angle differential of 30° (+15°/−15°). Black dots represent each particle pair’s tilt axis and tilt angle based on the cryo-EM map of PikAIII/ΔACP5. Most particle projection pairs cluster in a region (red circle) centered at 29.5° with an RMSD tilt angle of 8.3° and tilt axis of 90.23°.
Extended Data Figure 3
Cryo-EM analysis of MM-PikAIII. a, Refinement of MM-PikAIII reconstruction: A 3D model obtained ab initio (see Extended Data Fig. 2) was used as a starting reference for initial projection matching of ~29,000 cryo-EM particle views to provide a map at 8.1-Å resolution (middle), which was subsequently used for the refinement of the entire MM-PikAIII dataset (56,292 projections) to obtain a final map at 7.3-Å resolution. The panels on the bottom show vertical and horizontal cross-sections of the final MM-PikAIII cryo-EM map. b, Cross correlation values between the overall pseudo-atomic resolution model and the 3D maps of various states of PikAIII.
Extended Data Figure 4
Estimation of EM map resolution and assessment of over-refinement. Conventional FSC curves (blue), gold standard FSC (red) and high-resolution phase randomization tests (green) for PikAIII reconstructions. For conventional FSC calculations (full dataset refinement) we have used the conservative FSC=0.5 criterion as resolution indicator, whereas for gold standard FSC calculations (half dataset independent refinements) we have used the FSC=0.143 criterion, as previously applied. Consistently, the indicated resolution at FSC=0.5 of the conventional FSC is in close agreement with FSC=0.143 of the gold standard FSC. The FSC calculations with phase randomized data show a sharp drop off at the expected resolution level (10 Å, or 12 Å for holo-PikAIII) and a lack of noise refinement. Additionally, we have measured the FSC between the average map of the two gold standard half maps and the conventional map (full dataset) as implemented by Cheng and colleagues (see Extended Data Fig. 10). The agreement between the conventional and the average gold map by this method is also fully consistent with conventional and gold standard FSC calculations. The table inset summarizes the number of projections used for each reconstruction, the conventional and gold standard FSC resolution indications, and the agreement by FSC between the average map of the two gold standard half maps and the conventional map.
Extended Data Figure 5
Partial mass spectra of active site PikAIII and ACP4-PikAIII/C209A/ΔACP5 peptides from LC/FT-ICR MS of trypsin digested proteins. a–d, ACP5 active site peptides in their apo (a,b) and holo (with phosphopantetheine (Ppant); c,d) states at 2+ and 3+ charge states. Based on integrated peak abundances from multiple LC/MS runs, greater than 97% of the ACP5 Ser1438-containing peptides were modified with Ppant. e–f, Confirmation of the C209A mutation of the KS5 active site. The mutated active site peptide was detected in the 4+ (e) and 3+ (f) charge states. g–i, Example mass spectra of Ser3605-containing active site ACP4-derived peptides following enzymatic loading of the pentaketide from pentaketide-CoA. Both apo (g), holo (with Ppant; h), and pentaketide-ACP4 (i) were detected. j–l, Example mass spectra of active site ACP4-derived peptides from a control experiment in which pentaketide-CoA was absent. The majority of the ACP4 active site peptides were detected in the apo and holo states, while a very small percentage (<1%) contained the pentaketide intermediate. m–p, ACP5 active site peptides following incubation with MM-CoA. The MM building block was detected in high abundance on ACP5 Ser1438 (o,p) with some unloaded holo-protein as well (m,n). q–s, AT5 active site peptides following incubation with MM-CoA. The MM building block was detected on AT Ser655.
Extended Data Figure 6
PikAIII domain organization and connectivity. a, Crystal structure of excised DEBS module 5 KS-AT di-domain. KS (blue, yellow active site) and AT (green with red active site) domains interact differently than in the full module (Fig. 2), and the post-AT linker (red) lies on the surface of the KS domain. b, Localization of post-ACP5 dimerization helices. top: Stereo view of holo-PikAIII conformer I with the density ascribed to the post-ACP5 dimerization helices (rendered in cyan) observed between the ACP5 domains (orange). bottom: Overview of localization and enlarged cut-out densities of post-ACP5 dimerization helices (cyan) in holo-PikAIII conformer I. c, Stereo view of holo-PikAIII conformer II with the density ascribed to the post-ACP5 dimerization helices (rendered in cyan) observed between the ACP5 domains (orange). d, Proposed connectivity of domains in PikAIII determined by distances between domain termini and linker lengths. The catalytic domains are colored (green or blue) according to the assigned polypeptide chain. The AT interacts with the KS of the opposite monomer whereas the AT-KR interaction is within the monomer. Active site locations are indicated in yellow.
Extended Data Figure 7
Domain interfaces in PikAIII. a, Stereo view of the docked crystal structures of KS (blue) and AT (green) in the holo-PikAIII cryo-EM map reveal an extensive interface. The red star marks the side entrance to the KS active site where the catalytic Cys209 (yellow spheres) resides. b, The interface of KS (blue) and AT (green) is less than 20 Å from the KS active site Cys209 (spheres; blue C and yellow S). This is the only region of steric clashes between the KS and AT crystal structures rigidly docked in the 3D maps (KS5 amino acids 350-357 clash with AT5 488-498 and 526-531). Asp352 (spheres; blue C and red O) of the KS and Lys490 and Arg525 (spheres; green C and blue N) of the AT were substituted with Ala in PikAIII-TE. D352A and K490A, which are located in the clash zone, resulted in 0% and 50% activity, respectively, relative to WT PikAIII-TE. The R525A substitution abolished product formation even though this residue is outside the clash zone. The sensitivity of Arg525 and insensitivity of Lys490 to Ala substitution is consistent with a structural rearrangement at the KS-AT interface. c, The docked crystal structures of AT (green) and KR (purple) in the holo-PikAIII cryo-EM map. The interface is formed primarily by a loop of KR (residues 928-936) and an α-helix of AT (residues 760-775). d, The KR domain of PikAIII/ΔACP5 (right) is rotated by 165° compared to holo-PikAIII (left). e, View of the unobstructed path and proximity of Ser1438 (red) and Cys209 (yellow) in the docked structures of KS and ACP in the MM-PikAIII cryo-EM map.
Extended Data Figure 8
PikAIII functional assays. a, Example HPLC traces of PikAIII-TE assay. The levels of 10-deoxymethynolide (10-dml) produced by wild type PikAIII-TE (red trace), D352A PikAIII-TE (green), K490A PikAIII-TE (blue), R525A PikAIII-TE (orange), and a no enzyme control (yellow) are shown. b, Activity of PikAIII-TE mutants. ND-not detectable. c, Example HPLC traces of PikAIII/PikAIV assay. The levels of 10-deoxymethynolide (10-dml) and narbonolide (nbl) produced by wild type PikAIII/PikAIV (red trace), wild type PikAIII with PikAIV/R147E (green), wild type PikAIII with PikAIV/R320E (blue), and a no enzyme control (yellow) are shown. d, Activity of PikAIV mutants.
Extended Data Figure 9
Analysis of ACP-less PikAIII. a, Overlay of gel filtration chromatography elution profiles of PikAIII/ΔACP5 (blue) and PikAIII/Δ1403-1562 (red). PikAIII/ΔACP5 includes the post-ACP dimerization helices and elutes as a dimer whereas PikAIII/Δ1403-1562 lacks the dimerization helices and elutes as a monomer. The first peak in the red trace is apparently aggregated protein in the void volume of the S300 column. b, Solid rendering (left) and transparent representation with modeled structures (right) of the cryo-EM map of PikAIII/ΔACP5 at a resolution of 7.8 Å. c, Example HPLC traces of chromophore-CoA loading experiments. The blue trace (280 nm) indicates the level of protein and the red trace (550 nm) indicates the chromophore from CoA 547 (New England Biolabs). Incubation of apo-ACP4-PikAIII/C209A/ΔACP5 with SVP and CoA 547 indicates 100% of the ACP4 was in the apo form, based on molar extinction coefficients for protein and chromophore. d, Incubation of pentaketide-ACP4-PikAIII/C209A/ΔACP5 with SVP and CoA 547 indicates 80% of the ACP4 was loaded with pentaketide. e, Conventional FSC curve for the 3D reconstruction of holo-ACP4/PikAIII/C209A/ΔACP5 (no pentaketide added). f, Orthogonal views of solid rendering (top) and transparent representations with modeled structures (bottom) of the cryo-EM 3D reconstruction of holo-ACP4/PikAIII/C209A/ΔACP5 (no pentaketide added). No density for the upstream ACP4 was observed in the cryo-EM map even though densities corresponding to the N-terminal docking domains are clearly visible (compare with Fig. 3b). Fit into the 3D maps shown in panels b and f are the structures of DEBS module 5 KS (blue, 2HG4), DEBS module 5 AT (green, 2HG4) and DEBS module 1 KR (purple, 2FR0).
Extended Data Figure 10
Cryo-EM map refinement and resolution validation scheme. The flow chart shows the overall 3D reconstruction scheme and resolution calculation by conventional and gold standard FSC procedures using MM-PikAIII as an example. The procedure was applied for every high resolution 3D reconstruction in this study. Besides the conventional full dataset refinement (left), each dataset was split into two separate half datasets, which were employed for two independent reconstructions using the 50-Å filtered EM map as an initial reference (right; gold standard procedure). The final two gold half reconstructions were compared by FSC, and the indicated resolution by gold standard FSC with the 0.143 criterion showed excellent agreement with the value indicated at the 0.5 level of the conventional FSC (Extended Data Fig. 4). In addition, the two gold half maps were averaged, and the resulting average gold map was compared by FSC to the corresponding conventional map, again showing very good agreement at the same resolution range (Extended Data Fig. 4). These tests, along with the phase randomization tests (Extended Data Fig. 4), reveal the lack of over-refinement and accurate resolution values reported in this study.
Figure 1
Figure 1
Modular polyketide synthase for pikromycin. The six modules of the pikromycin PKS, comprised of PikAI-IV polypeptides, sequentially elongate and modify a polyketide intermediate. A polyketide product, either 10-deoxymethynolide (10-dml) from module 5 or narbonolide (nbl) from module 6, is off-loaded by the thioesterase domain (TE) of the final module, PikAIV. Modules are differently colored. Circles represent protein domains (ketosynthase KS, acyltransferase AT, dehydratase DH, enoyl reductase ER, ketoreductase KR and acyl carrier protein ACP; KSQ is a decarboxylase; KR* is inactive), and docking domains are shown as jagged ends. PikAIII schematic: The 1562-amino acid PikAIII polypeptide, selected for this study, is shown with functional domains in contrasting colors, used throughout, and linker peptides identified by residue ranges. The N- and C-terminal docking domains are shown as helices, as are the post-ACP dimerization helices.
Figure 2
Figure 2
Cryo-EM structures of holo-PikAIII. a, Solid rendering and b, transparent representations with modeled structures of the cryo-EM map of holo-PikAIII conformer I. This conformation, in which the ACP5 (orange) is near KR5, is observed in 57% of particle projections. c, Solid rendering (left) and transparent representations with modeled structures (right) of the cryo-EM map of holo-PikAIII conformer II. This conformation, in which ACP5 (orange) is near AT5, is observed in 43% of particle projections. d, Fitting of the ACP structure in the corresponding density of both holo-PikAIII conformers reveals that Ser1438 is directed away from any active site. e, Comparison of holo-PikAIII full module and mammalian FAS. The KS is blue, AT is green, ACP is orange (disordered in FAS), DH is yellow, and ER is red. Active sites are highlighted with spheres.
Figure 3
Figure 3
Interaction of upstream ACP with the PKS module. a, Orthogonal views of solid rendering (left) and transparent representation with modeled structures (right) of the cryo-EM map of pentaketide-ACP4-PikAIII/C209A/ΔACP5 at 8.6 Å resolution. b, The position of Ser3605 proximal to the KS active site entrance. Ser3605 (red sphere) and Cys209 (yellow sphere) are 28 Å apart (dashed red line). Loops 1 and 2 of ACP4 (residues 3588-3606 and 3624-3634) contact two helices (residues 284-293 and 316-322) and a loop (residues 140-150) of KS5. c, Cartoon representation of pentaketide-ACP4-PikAIII/C209A/ΔACP5. The upstream ACP (red with yellow serine) carrying the pentaketide intermediate (yellow line) docks to the side entrance of the downstream KS (blue with yellow active site).
Figure 4
Figure 4
Interaction of intra-module ACP5 with KS5 in methylmalonyl-PikAIII. a, Orthogonal views of solid rendering (left) and transparent representation with modeled structures (right) of the MM-PikAIII cryo-EM map at 7.3-Å resolution. The ACP (orange) has shifted ~20 Å relative to its position in holo-PikAIII conformer II. b, KS active site channels. Internal cavity analysis (purple surface) depicts channels to the active site from both the side and bottom entrances. c, Cartoon representation of MM-PikAIII. AT (green, yellow active site) loading of the MM building block (red) onto the intra-module ACP (orange, yellow serine) positions the carrier domain at the bottom entrance of KS (blue, yellow active site) for decarboxylative condensation, remote from the KR domain (purple, yellow active site).

Comment in

References

    1. Newman DJ, Cragg GM. Natural products as sources of new drugs over the 30 years from 1981 to 2010. J Nat Prod. 2012;75:311–335. - PMC - PubMed
    1. Fischbach MA, Walsh CT. Assembly-line enzymology for polyketide and nonribosomal Peptide antibiotics: logic, machinery, and mechanisms. Chem Rev. 2006;106:3468–3496. - PubMed
    1. Smith S, Tsai SC. The type I fatty acid and polyketide synthases: a tale of two megasynthases. Nat Prod Rep. 2007;24:1041–1072. - PMC - PubMed
    1. Broadhurst RW, Nietlispach D, Wheatcroft MP, Leadlay PF, Weissman KJ. The structure of docking domains in modular polyketide synthases. Chem Biol. 2003;10:723–731. - PubMed
    1. Buchholz TJ, Geders TW, Bartley FE, 3rd, Reynolds KA, Smith JL, Sherman DH. Structural basis for binding specificity between subclasses of modular polyketide synthase docking domains. ACS Chem Biol. 2009;4:41–52. - PMC - PubMed

Publication types