. 2014 Jun 25:3:e02304.
doi: 10.7554/eLife.02304.

An atomic-resolution view of neofunctionalization in the evolution of apicomplexan lactate dehydrogenases

Affiliations

An atomic-resolution view of neofunctionalization in the evolution of apicomplexan lactate dehydrogenases

Jeffrey I Boucher et al. Elife. .

Abstract

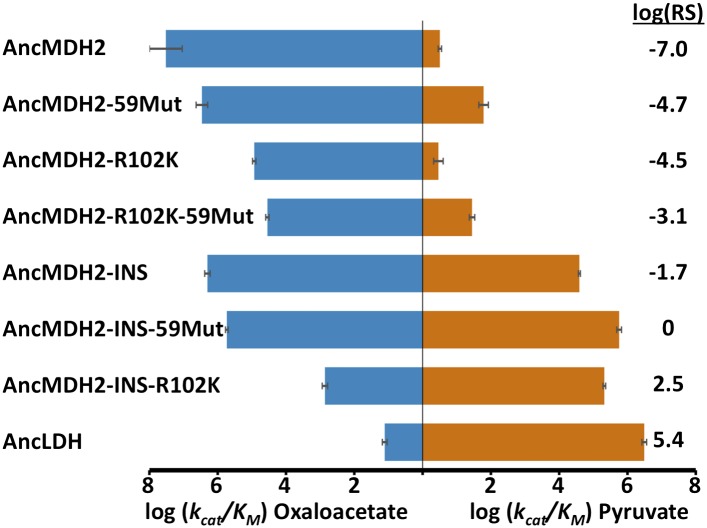
Malate and lactate dehydrogenases (MDH and LDH) are homologous, core metabolic enzymes that share a fold and catalytic mechanism yet possess strict specificity for their substrates. In the Apicomplexa, convergent evolution of an unusual LDH from MDH produced a difference in specificity exceeding 12 orders of magnitude. The mechanisms responsible for this extraordinary functional shift are currently unknown. Using ancestral protein resurrection, we find that specificity evolved in apicomplexan LDHs by classic neofunctionalization characterized by long-range epistasis, a promiscuous intermediate, and few gain-of-function mutations of large effect. In canonical MDHs and LDHs, a single residue in the active-site loop governs substrate specificity: Arg102 in MDHs and Gln102 in LDHs. During the evolution of the apicomplexan LDH, however, specificity switched via an insertion that shifted the position and identity of this 'specificity residue' to Trp107f. Residues far from the active site also determine specificity, as shown by the crystal structures of three ancestral proteins bracketing the key duplication event. This work provides an unprecedented atomic-resolution view of evolutionary trajectories creating a nascent enzymatic function.

Keywords: ancestral sequence reconstruction; biophysics; dehydrogenase; evolutionary biology; gene duplication; genomics; molecular evolution; promiscuity; specificity; structural biology.


Conflict of interest statement

The authors declare that no competing interests exist.

Figures

Figure 1.
Figure 1.. Schematic of M/LDH superfamily active site and catalytic mechanism.
MDH reduces oxaloacetate to malate, in which the R-group is a methylene carboxylate group. LDH reduces pyruvate to lactate, in which the R-group is a methyl group. Key conserved active site residues are shown in black; substrate is shown in blue. The oxidized 2-ketoacid form of the substrate is at left; the reduced 2-hydroxy acid form is shown at right. The R-group of the substrate interacts with Arg102 in MDHs and Gln102 in canonical LDHs. Both Arg109 and position 102 are found in the mobile ‘specificity loop’ that closes over the active site. DOI: http://dx.doi.org/10.7554/eLife.02304.003
Figure 1—figure supplement 1.
Figure 1—figure supplement 1.. Fold architecture in the LDH and MDH superfamily.
At left is CpMDH (blue, 2hjr), at right is PfLDH (vermilion and olive, 1t2d). The Rossmann fold domain, which binds the NADH cofactor, is show as light blue in CpMDH and vermilion in PfLDH. The active site is found at the interface of the two domains. In CpMDH, the ‘opposing loop’ is highlighted in yellow (see text). In PfLDH, the six-residue insertion is highlighted in yellow. DOI: http://dx.doi.org/10.7554/eLife.02304.004
Figure 2.
Figure 2.. Apicomplexan M/LDH active sites.
Structures of CpMDH (blue, 2hjr) and PfLDH (vermilion, 1t2d) superposed using THESEUS. The ligands (oxalate and NAD+) are from 1t2d and colored white. Side chains of important residues are shown as sticks and the six-residue insert of PfLDH is highlighted in yellow. Note how the PfLDH Trp107f overlays Arg102 from CpMDH. Residues in the insertion are labeled using numbers and letters to maintain consistency with homologous positions in the dogfish LDH. DOI: http://dx.doi.org/10.7554/eLife.02304.005
Figure 2—figure supplement 1.
Figure 2—figure supplement 1.. Sequence alignment of the specificity loop from apicomplexan M/LDHs with ancestral sequences.
DOI: http://dx.doi.org/10.7554/eLife.02304.006
Figure 2—figure supplement 2.
Figure 2—figure supplement 2.. Alanine scanning of PfLDH specificity loop.
Logarithm of pyruvate kcat/KM of PfLDH and each mutant. Labels on x-axis describe the mutation tested in the WT PfLDH background. DOI: http://dx.doi.org/10.7554/eLife.02304.007
Figure 2—figure supplement 3.
Figure 2—figure supplement 3.. Crystal structure of PfLDH-W107fA mutant.
(A) Crystal lattice of the W107fA mutant (left) compared to the WT PfLDH (right). (B) Superposition of the WT PfLDH (olive) and the W107fA mutant (vermilion). The structures are highly similar throughout, expect for the active site loop (at top), which is closed in the WT and partially disordered and open in the mutant. DOI: http://dx.doi.org/10.7554/eLife.02304.009
Figure 3.
Figure 3.. Phylogeny of apicomplexan M/LDH superfamily.
(A) 1844 taxa. The tree is colored according to function (LDH—vermilion; MDH—blue; HicDH—moss). The N-terminal Rossmann-fold of glucosidases and aspartate dehydrogenases (AspDHs) was used to root the phylogeny. Numbers highlight convergent events of LDH evolution from MDHs: 1–Canonical LDHs, 2–Trichomonad LDHs, and 3,4–apicomplexan LDHs. The shaded clades have highly significant supports (Anisimova and Gascuel, 2006). (B) Apicomplexan M/LDH Clade. A close-up of the apicomplexan portion of the phylogeny in A, similarly colored by function. aLRT supports for each group: α-proteobacteria MDHs, 15; apicomplexan LDHs, 11; Plasmodium LDHs, 333; Cryptosporidium MDHs, 54; Cryptosporidium LDHs, 202. Ancestral reconstructed proteins are labeled at internal nodes (AncMDH1, AncMDH2, AncMDH3, AncLDH). The focus of the present work is the gene duplication at node 3. DOI: http://dx.doi.org/10.7554/eLife.02304.010
Figure 3—figure supplement 1.
Figure 3—figure supplement 1.. Phylogeny of M/LDH superfamily.
Same phylogeny as Figure 3A with select branch supports shown (aLRT supports). DOI: http://dx.doi.org/10.7554/eLife.02304.011
Figure 3—figure supplement 2.
Figure 3—figure supplement 2.. Phylogeny of M/LDH superfamily.
Same phylogeny as Figure 3A. The tree is colored by domain of life (eubacterial—vermilion; eukaryotic—blue; archeal—magenta). DOI: http://dx.doi.org/10.7554/eLife.02304.012
Figure 3—figure supplement 3.
Figure 3—figure supplement 3.. Apicomplexan M/LDH Clade.
Same phylogeny as Figure 3B with aLRT branch supports and clades shown in full detail. DOI: http://dx.doi.org/10.7554/eLife.02304.013
Figure 4.
Figure 4.. Specificity switching in apicomplexan M/LDHs.
Blue horizontal bars (left) quantify activity towards oxaloacetate; vermilion horizontal bars (right) quantify activity towards pyruvate. Activity is measured as log10(kcat/KM ), where kcat/KM is in units of s-1M−1. Error bars are shown as small black brackets and represent 1 SD of the mean from triplicate measurements. INS refers to the presence of the six-residue insertion from PfLDH, DEL refers to the removal of the six-residue insertion. Relative specificity (RS) is the ratio of kcat/KM for pyruvate vs oxaloacetate, with positive log10(RS) representing a preference for pyruvate and negative log10(RS) representing a preference for oxaloacetate. All logarithms are base 10. DOI: http://dx.doi.org/10.7554/eLife.02304.014
Figure 5.
Figure 5.. Evolution of novel LDHs in Apicomplexa.
The activities of ancestral and modern apicomplexan M/LDHs are plotted on the corresponding nodes of the protein phylogeny. Nodes are numbered as in Figure 3B. The y-axis of the bar graphs is log(kcat/KM), with oxaloacetate in blue and pyruvate in vermilion. RbMDH is a representative α-proteobacterial MDH from Rickettsia bellii. T. gondii has two LDH proteins (TgLDH1 and TgLDH2), each expressed at different stages of the life cycle (Dando et al., 2001). DOI: http://dx.doi.org/10.7554/eLife.02304.016
Figure 5—figure supplement 1.
Figure 5—figure supplement 1.. Sequence identity of ancestral and modern proteins.
DOI: http://dx.doi.org/10.7554/eLife.02304.018
Figure 6.
Figure 6.. Specificity switching in ancestral MDH2.
INS refers to the reconstructed six-residue insertion from AncLDH. 59Mut is described in the text. Relative specificity (RS) is described in legend of Figure 4. DOI: http://dx.doi.org/10.7554/eLife.02304.019
Figure 6—figure supplement 1.
Figure 6—figure supplement 1.. Histogram of ancestral reconstructions.
Reconstructed residues binned according to posterior probability (PP) of the predicted residue. DOI: http://dx.doi.org/10.7554/eLife.02304.022
Figure 6—figure supplement 2.
Figure 6—figure supplement 2.. Histogram of ancestral reconstructions.
Reconstructed residues binned according to posterior probability (PP) of the predicted residue. DOI: http://dx.doi.org/10.7554/eLife.02304.023
Figure 6—figure supplement 3.
Figure 6—figure supplement 3.. Histogram of ancestral reconstructions.
Reconstructed residues binned according to posterior probability (PP) of the predicted residue. DOI: http://dx.doi.org/10.7554/eLife.02304.024
Figure 6—figure supplement 4.
Figure 6—figure supplement 4.. Histogram of ancestral reconstructions.
Reconstructed residues binned according to posterior probability (PP) of the predicted residue. DOI: http://dx.doi.org/10.7554/eLife.02304.025
Figure 6—figure supplement 5.
Figure 6—figure supplement 5.. Histogram of ancestral reconstructions.
Reconstructed residues binned according to posterior probability (PP) of the predicted residue. DOI: http://dx.doi.org/10.7554/eLife.02304.026
Figure 6—figure supplement 6.
Figure 6—figure supplement 6.. Histogram of ancestral reconstructions.
Reconstructed residues binned according to posterior probability (PP) of the predicted residue. DOI: http://dx.doi.org/10.7554/eLife.02304.027
Figure 6—figure supplement 7.
Figure 6—figure supplement 7.. Alternative ancestral enzymes.
INS refers to the reconstructed six amino acid insertion from AncLDH*. 58Mut refers to remaining residue differences between AncMDH* and AncLDH* that are not R102K or INS. Relative specificity (RS) is described in legend of Figure 4. DOI: http://dx.doi.org/10.7554/eLife.02304.028
Figure 7.
Figure 7.. Ancestral and modern dehydrogenase structures.
(A) Superposition of CpMDH and AncMDH2. Superposition of AncMDH2 structure (blue, 4plw, chain C) and CpMDH (aquamarine, 2hjr, chain A). Ligands from AncMDH2 are shown in gray; ligands from CpMDH are in white. (B) Active site detail of Cp MDH and AncMDH2. Side chains of catalytic residues highlighted as sticks. (C) Superposition of apicomplexan LDHs and AncLDH*. Superposition of AncLDH* structure (vermilion, 4plg, chain A) and four apicomplexan LDHs (deep olive, PfLDH, 1t2d, chain A, Plasmodium berghei (Pb) LDH, 1oc4, chain B, TgLDH1, 1pzh, chain A, TgLDH2, 1sow, chain B). Ligands from AncLDH* are shown in gray, ligands from apicomplexan LDHs are in white. The ‘opposing loop’ and residues 236 and 246 (discussed in text) are highlighted in cyan. (D) Active site detail of apicomplexan LDHs and AncLDH*. Side chains of catalytic residues highlighted as sticks. (E) Superposition of ancestral dehydrogenases. Superposition of AncMDH2 (blue, 4plw, chain C), AncLDH* (vermilion, 4plg, chain A), and AncMDH2-INS (magenta, 4ply, chain F and 4plv, chain B). Ligands are shown in gray. (F) Active site detail of ancestral dehydrogenases. Side chains of catalytic residues highlighted as sticks. DOI: http://dx.doi.org/10.7554/eLife.02304.029
Figure 7—figure supplement 1.
Figure 7—figure supplement 1.. Crystallographic statistics table for AncLDH*, AncMDH2, AncMDH2-INS, and PfLDH-W107fA structures.
DOI: http://dx.doi.org/10.7554/eLife.02304.030
Figure 8.
Figure 8.. Alternative LDH mutations in AncMDH2.
Relative specificity (RS) is described in legend of Figure 4. DOI: http://dx.doi.org/10.7554/eLife.02304.031

References

    1. Adams PD, Afonine PV, Bunkóczi G, Chen VB, Davis IW, Echols N, Headd JJ, Hung LW, Kapral GJ, Grosse-Kunstleve RW, McCoy AJ, Moriarty NW, Oeffner R, Read RJ, Richardson DC, Richardson JS, Terwilliger TC, Zwart PH. 2010. PHENIX: a comprehensive Python-based system for macromolecular structure solution. Acta Crystallographica Section D Biological Crystallography 66:213–221. doi: 10.1107/S0907444909052925 - DOI - PMC - PubMed
    1. Altschul SF, Gish W, Miller W, Myers EW, Lipman DJ. 1990. Basic local alignment search tool. Journal of Molecular Biology 215:403–410. doi: 10.1016/S0022-2836(05)80360-2 - DOI - PubMed
    1. Anisimova M, Gascuel O. 2006. Approximate likelihood-ratio test for branches: a fast, accurate, and powerful alternative. Systematic Biology 55:539–552. doi: 10.1080/10635150600755453 - DOI - PubMed
    1. Aurrecoechea C, Brestelli J, Brunk BP, Dommer J, Fischer S, Gajria B, Gao X, Gingle A, Grant G, Harb OS, Heiges M, Innamorato F, Iodice J, Kissinger JC, Kraemer E, Li W, Miller JA, Nayak V, Pennington C, Pinney DF, Roos DS, Ross C, Stoeckert CJ, Jnr, Treatman C, Wang H. 2009. PlasmoDB: a functional genomic database for malaria parasites. Nucleic Acids Research 37:D539–D543. doi: 10.1093/nar/gkn814 - DOI - PMC - PubMed
    1. Birktoft JJ, Banaszak LJ. 1983. The presence of a histidine-aspartic acid pair in the active site of 2-hydroxyacid dehydrogenases. X-ray refinement of cytoplasmic malate dehydrogenase. The Journal of Biological Chemistry 258:472–482 - PubMed

Publication types