. 2014 Sep 6;11(98):20140431.
doi: 10.1098/rsif.2014.0431.

Shear-induced force transmission in a multicomponent, multicell model of the endothelium

Affiliations

Shear-induced force transmission in a multicomponent, multicell model of the endothelium

Mahsa Dabagh et al. J R Soc Interface. .

Abstract

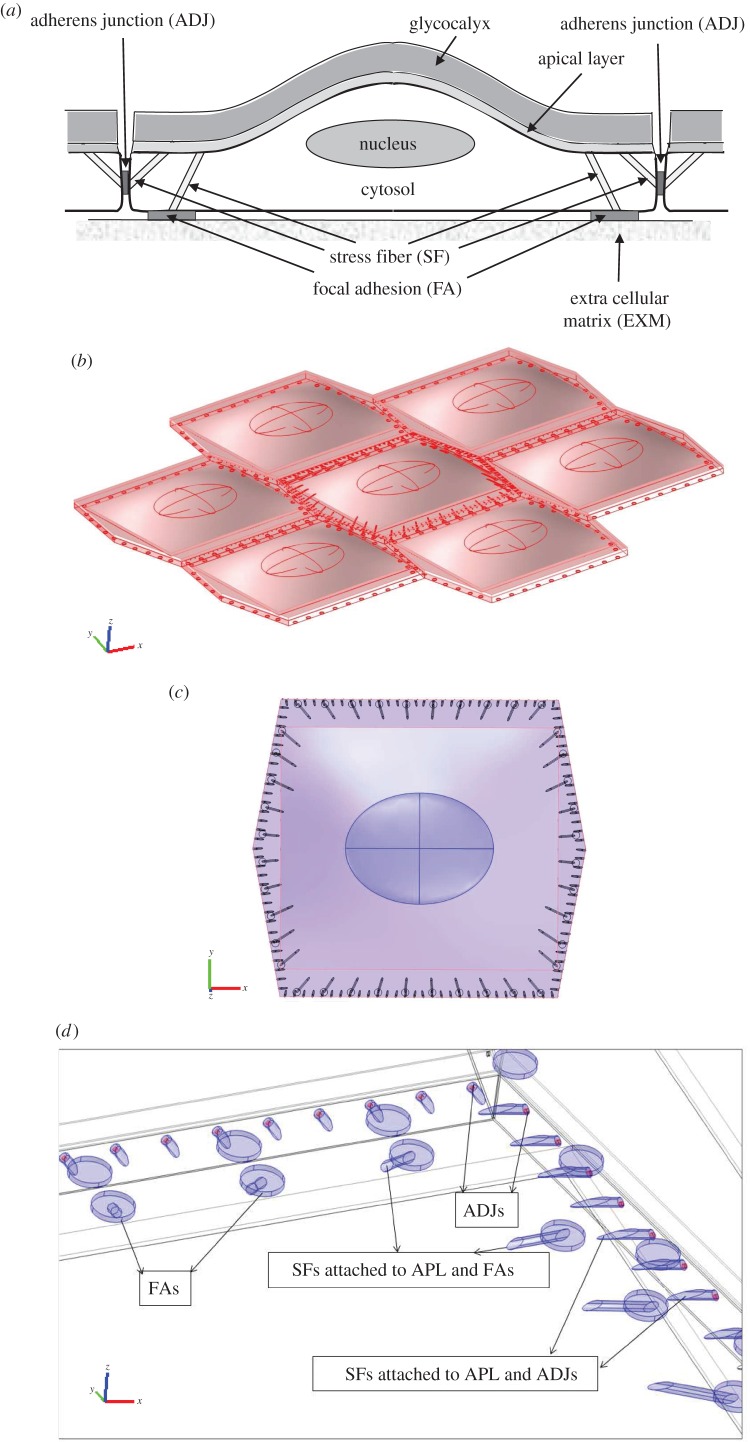
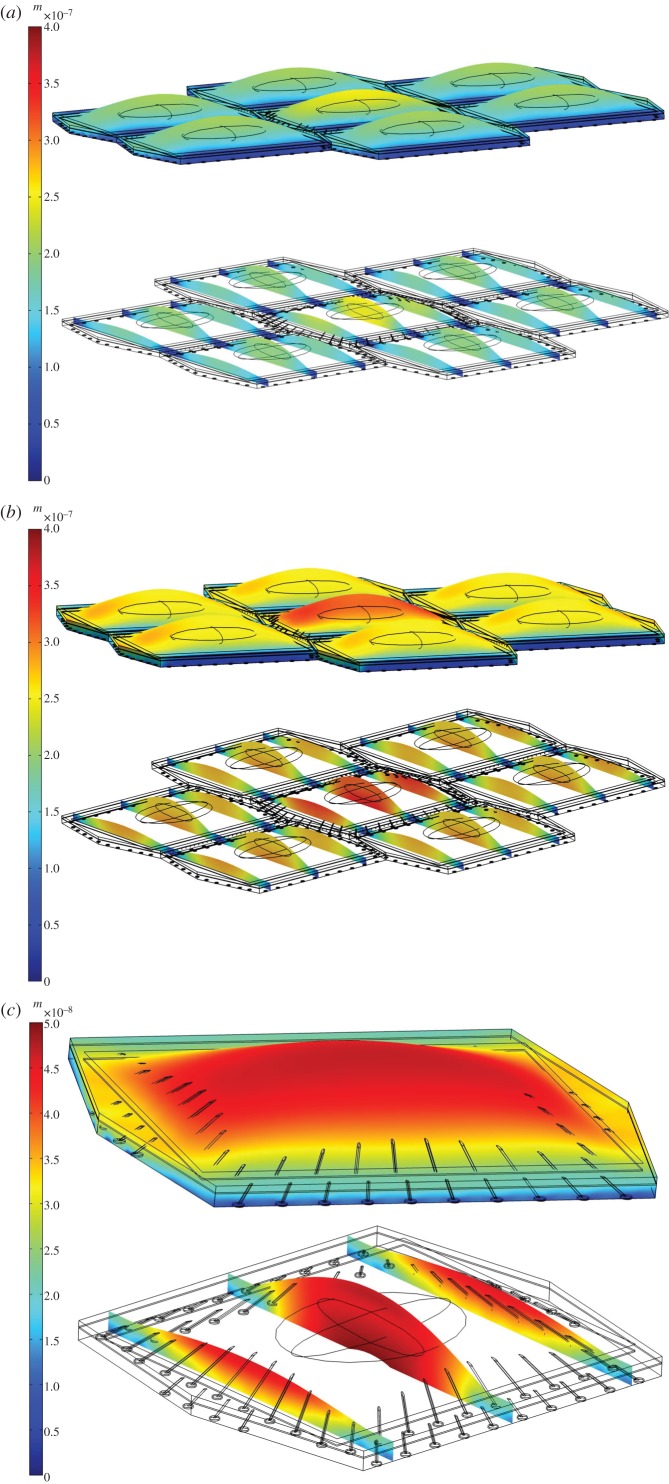
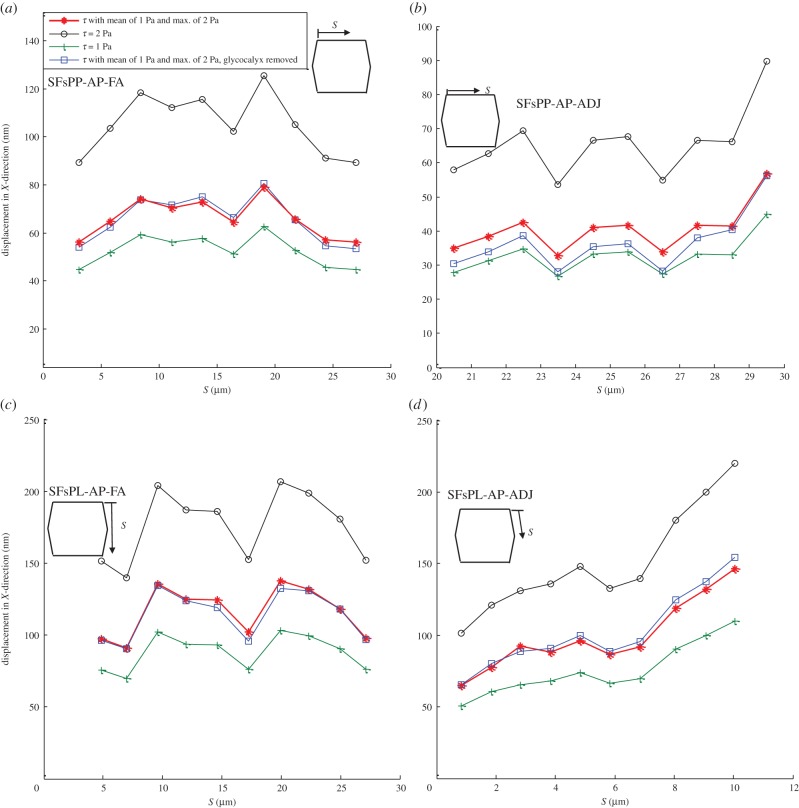
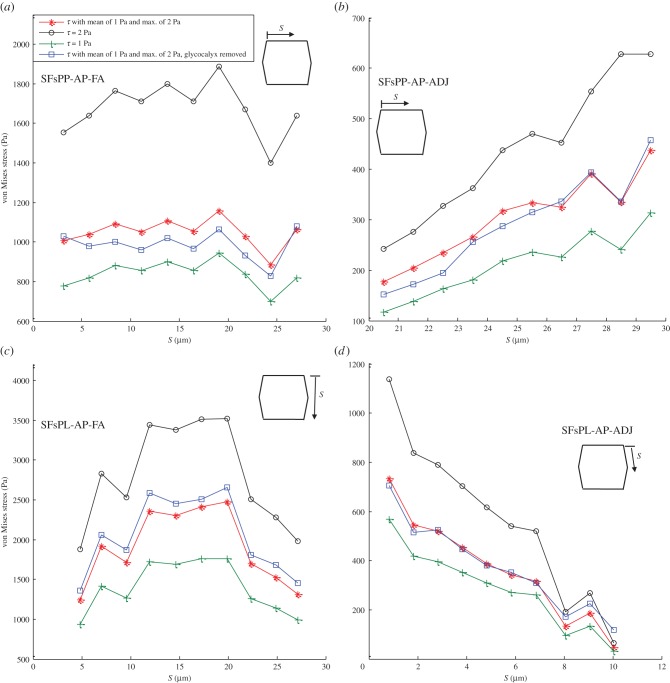
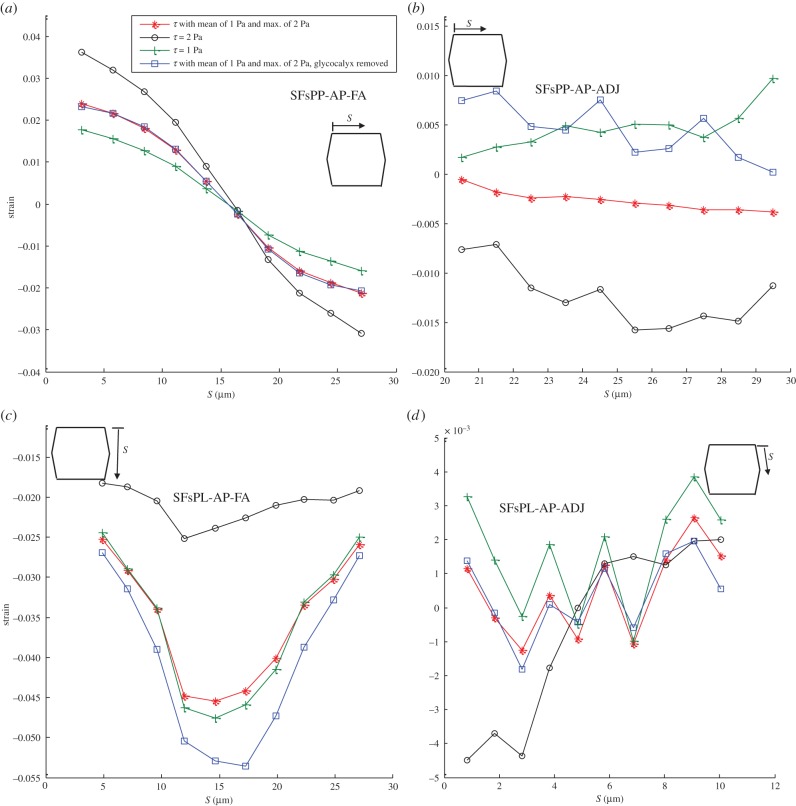
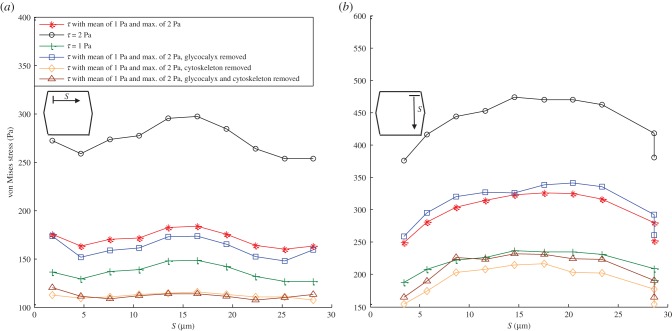
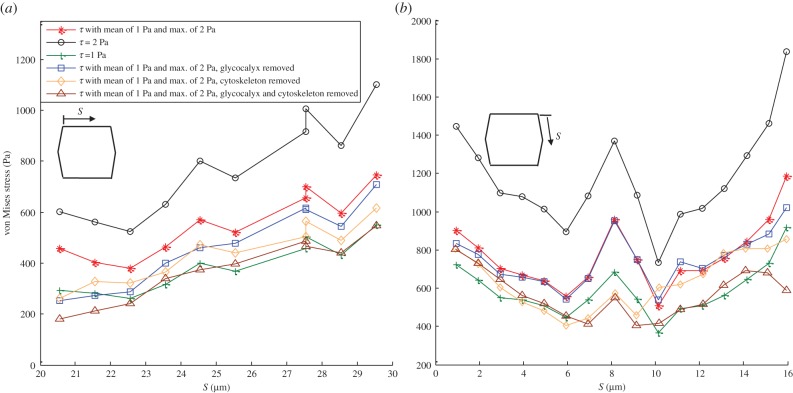
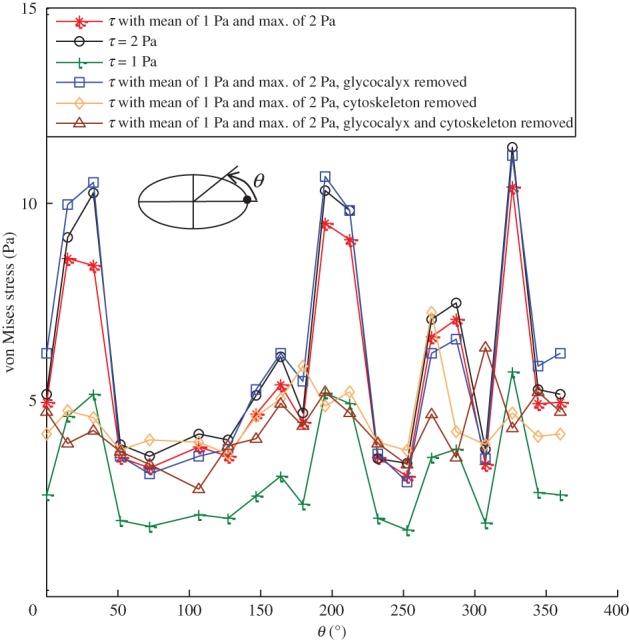
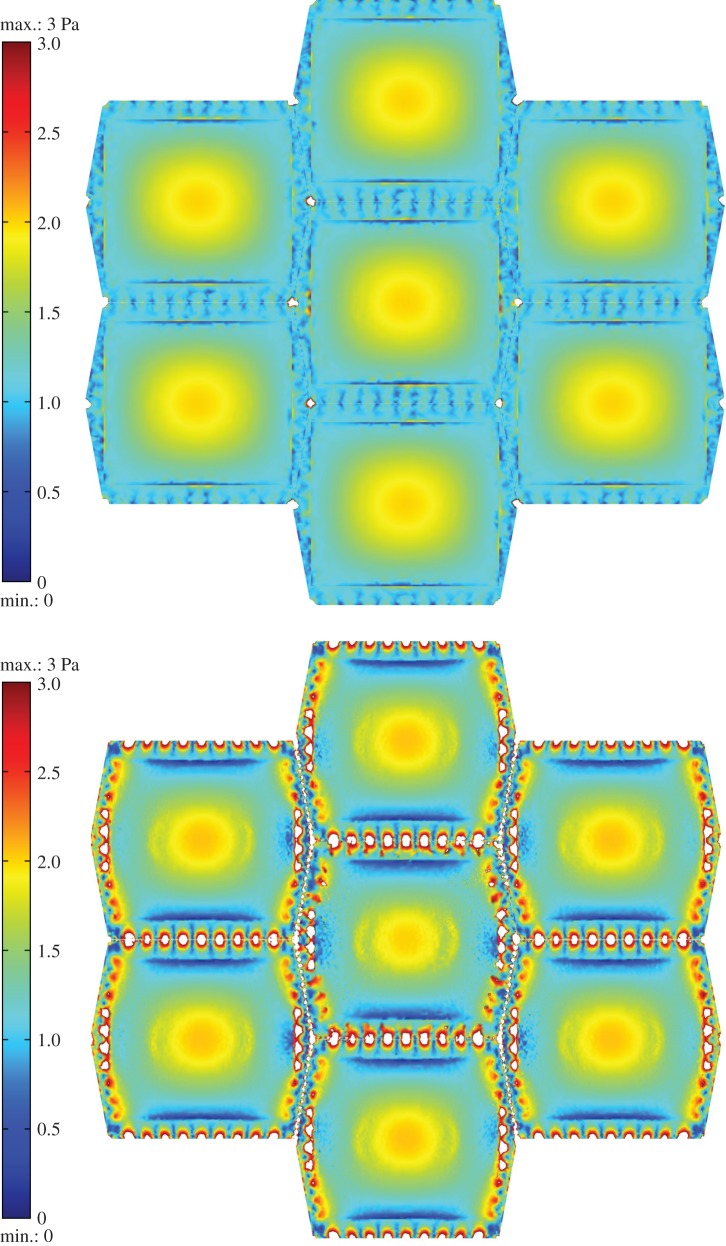
Haemodynamic forces applied at the apical surface of vascular endothelial cells (ECs) provide the mechanical signals at intracellular organelles and through the inter-connected cellular network. The objective of this study is to quantify the intracellular and intercellular stresses in a confluent vascular EC monolayer. A novel three-dimensional, multiscale and multicomponent model of focally adhered ECs is developed to account for the role of potential mechanosensors (glycocalyx layer, actin cortical layer, nucleus, cytoskeleton, focal adhesions (FAs) and adherens junctions (ADJs)) in mechanotransmission and EC deformation. The overriding issue addressed is the stress amplification in these regions, which may play a role in subcellular localization of mechanotransmission. The model predicts that the stresses are amplified 250-600-fold over apical values at ADJs and 175-200-fold at FAs for ECs exposed to a mean shear stress of 10 dyne cm(-2). Estimates of forces per molecule in the cell attachment points to the external cellular matrix and cell-cell adhesion points are of the order of 8 pN at FAs and as high as 3 pN at ADJs, suggesting that direct force-induced mechanotransmission by single molecules is possible in both. The maximum deformation of an EC in the monolayer is calculated as 400 nm in response to a mean shear stress of 1 Pa applied over the EC surface which is in accord with measurements. The model also predicts that the magnitude of the cell-cell junction inclination angle is independent of the cytoskeleton and glycocalyx. The inclination angle of the cell-cell junction is calculated to be 6.6° in an EC monolayer, which is somewhat below the measured value (9.9°) reported previously for ECs subjected to 1.6 Pa shear stress for 30 min. The present model is able, for the first time, to cross the boundaries between different length scales in order to provide a global view of potential locations of mechanotransmission.

Keywords: adherens junctions; endothelial cell mechanics; focal adhesions; glycocalyx; mechanotransmission; stress fibres.


Figures

Figure 1.
Figure 1.
The EC monolayer applied in the mathematical modelling of the force transmission through inter-/intracellular organelles. (a) Schematic view of EC, its connection to neighbouring cells and subcellular structures. (b) The EC monolayer from the side. (c) The transverse section of middle EC, including the glycocalyx, cortical layer, cytosol, nucleus, SFs, FAs and ADJs. (d) The peripherally distributed SFs are located along the apical plasma membrane of ECs and FAs or apical layer and intercellular junctions.
Figure 2.
Figure 2.
The displacement of (a) EC monolayer where shear stress given by equation (2.7) is applied over the surface of ECs, with a mean value of 1 Pa and maximum of 2 Pa. (b) EC monolayer where a uniform shear stress of 2 Pa is applied over surface of ECs. (c) Single EC where a uniform shear stress of 1 Pa is applied over the cell surface.
Figure 3.
Figure 3.
Displacement of SFs in ECs exposed to shear stress given by equation (2.7) applied over the surface of ECs with a mean value of 1 Pa and maximum of 2 Pa, uniform shear stress of 2 Pa, uniform shear stress of 1 Pa and shear stress given by equation (2.7) applied over the surface of ECs with a mean value of 1 Pa and maximum of 2 Pa while the glycocalyx is removed. The displacement is calculated for the upper edge of SFs which are attached to the apical layer. (a) SFs are located perpendicular to FSS and attached to the apical layer and FAs (SFsPP-AP-FA), (b) SFs are perpendicular to FSS and attached to the apical layer to ADJs (SFsPP-AP-ADJ), (c) SFs are parallel to FSS and attached to the apical layer and FAs (SFsPL-AP-FA) and (d) SFs are parallel to FSS and attached to the apical layer to ADJs (SFsPL-AP-ADJ). S represents the distances of SFs from the starting point of the EC edge that SFs are located along it. (Online version in colour.)
Figure 4.
Figure 4.
The average von Mises stress magnitude over the SFs in ECs exposed to shear stress given by equation (2.7) with a mean value of 1 Pa and maximum of 2 Pa, uniform shear stress of 2 Pa, uniform shear stress of 1 Pa and shear stress given by equation (2.7) applied over the surface of ECs with a mean value of 1 Pa and the maximum of 2 Pa while the glycocalyx is removed. (a) SFs are located perpendicular to FSS and attached to the apical layer and FAs (SFsPP-AP-FA), (b) SFs are perpendicular to FSS and attached to the apical layer to ADJs (SFsPP-AP-ADJ), (c) SFs are parallel to FSS and attached to the apical layer and FAs (SFsPL-AP-FA) and (d) SFs are parallel to FSS and attached to the apical layer to ADJs (SFsPL-AP-ADJ). (Online version in colour.)
Figure 5.
Figure 5.
The axial strain along the SFs in ECs exposed to shear stress given by equation (2.7) with a mean value of 1 Pa and the maximum of 2 Pa, uniform shear stress of 2 Pa, uniform shear stress of 1 Pa, and shear stress given by equation (2.7) applied over the surface of ECs with a mean value of 1 Pa and the maximum of 2 Pa while the glycocalyx is removed. (a) SFs are located perpendicular to FSS and attached to the apical layer and FAs (SFsPP-AP-FA), (b) SFs are perpendicular to FSS and attached to the apical layer to ADJs (SFsPP-AP-ADJ), (c) SFs are parallel to FSS and attached to the apical layer and FAs (SFsPL-AP-FA) and (d) SFs are parallel to FSS and attached to the apical layer to ADJs (SFsPL-AP-ADJ). S represents the distances of SFs from the starting point of the EC edge that SFs are located along it. (Online version in colour.)
Figure 6.
Figure 6.
The von Mises stress distribution over the FAs. (a) FAs located perpendicular to the flow direction. (b) FAs located parallel to the flow direction. The cells are exposed to shear stress given by equation (2.7) with a mean value of 1 Pa and the maximum of 2 Pa, uniform shear stress of 2 Pa, uniform shear stress of 1 Pa, shear stress given by equation (2.7) applied over the surface of ECs with a mean value of 1 Pa and the maximum of 2 Pa while the glycocalyx is removed, shear stress given by equation (2.7) applied over the surface of ECs with a mean value of 1 Pa and the maximum of 2 Pa while the cytoskeleton is removed, and shear stress given by equation (2.7) applied over the surface of ECs with a mean value of 1 Pa and the maximum of 2 Pa while both the glycocalyx and cytoskeleton are removed. (Online version in colour.)
Figure 7.
Figure 7.
The average von Mises stress magnitude over ADJs along (a) the upper edge (perpendicular to FSS) of middle EC and (b) the right-upper edge (parallel to FSS) of the middle EC. The cells are exposed to shear stress given by equation (2.7) with a mean value of 1 Pa and the maximum of 2 Pa, uniform shear stress of 2 Pa, uniform shear stress of 1 Pa, shear stress given by equation (2.7) applied over the surface of ECs with a mean value of 1 Pa and the maximum of 2 Pa while the glycocalyx is removed, shear stress given by equation (2.7) applied over the surface of ECs with a mean value of 1 Pa and the maximum of 2 Pa while the cytoskeleton is removed, and shear stress given by equation (2.7) applied over the surface of ECs with a mean value of 1 Pa and the maximum of 2 Pa while both the glycocalyx and cytoskeleton are removed. S represents the distances of ADJs from the starting point of the EC edge that ADJs are attached to it. (Online version in colour.)
Figure 8.
Figure 8.
The von Mises stress distribution over the perimeter of the central cross section of the nucleus of the middle EC. The cells are exposed to shear stress given by equation (2.7) with a mean value of 1 Pa and the maximum of 2 Pa, uniform shear stress of 2 Pa, uniform shear stress of 1 Pa, shear stress given by equation (2.7) applied over the surface of ECs with a mean value of 1 Pa and the maximum of 2 Pa while the glycocalyx is removed, shear stress given by equation (2.7) applied over the surface of ECs with a mean value of 1 Pa and the maximum of 2 Pa while the cytoskeleton is removed, and shear stress given by equation (2.7) applied over the surface of ECs with a mean value of 1 Pa and the maximum of 2 Pa while both the glycocalyx and cytoskeleton are removed. (Online version in colour.)
Figure 9.
Figure 9.
The von Mises stress distribution at the surface of (a) glycocalyx. (b) Cortical apical layer. The stresses over 3 Pa appear in white. The EC monolayer is exposed to shear stress given by equation (2.7) with a mean value of 1 Pa and the maximum of 2 Pa.

References

    1. Chen CS. 2008. Mechanotransduction—a field pulling together? J. Cell Sci. 121, 3285–3292. (10.1242/jcs.023507) - DOI - PubMed
    1. Orr AW, Helmke BP, Blackman B, Schwartz MA. 2006. Mechanisms of mechanotransduction. Dev. Cell 10, 11–20. (10.1016/j.devcel.2005.12.006) - DOI - PubMed
    1. Huang H, Kamm RD, Lee RT. 2004. Cell mechanics and mechanotransduction: pathways, probes, and physiology. Am. J. Physiol. Cell Physiol. 287, C1–C11. (10.1152/ajpcell.00559.2003) - DOI - PubMed
    1. Davies PF. 1995. Flow-mediated endothelial mechanotransduction. Physiol. Rev. 75, 519–560. - PMC - PubMed
    1. Li YS, Haga JH, Chein S. 2005. Molecular basis of the effects of shear stress on vascular endothelial cells. J. Biomech. 38, 1949–1971. (10.1016/j.jbiomech.2004.09.030) - DOI - PubMed

Publication types

LinkOut - more resources