. 2014 Jun;4(6):140070.
doi: 10.1098/rsob.140070.

Modelling and mutational analysis of Aspergillus nidulans UreA, a member of the subfamily of urea/H⁺ transporters in fungi and plants

Affiliations

Modelling and mutational analysis of Aspergillus nidulans UreA, a member of the subfamily of urea/H⁺ transporters in fungi and plants

Manuel Sanguinetti et al. Open Biol. 2014 Jun.

Abstract

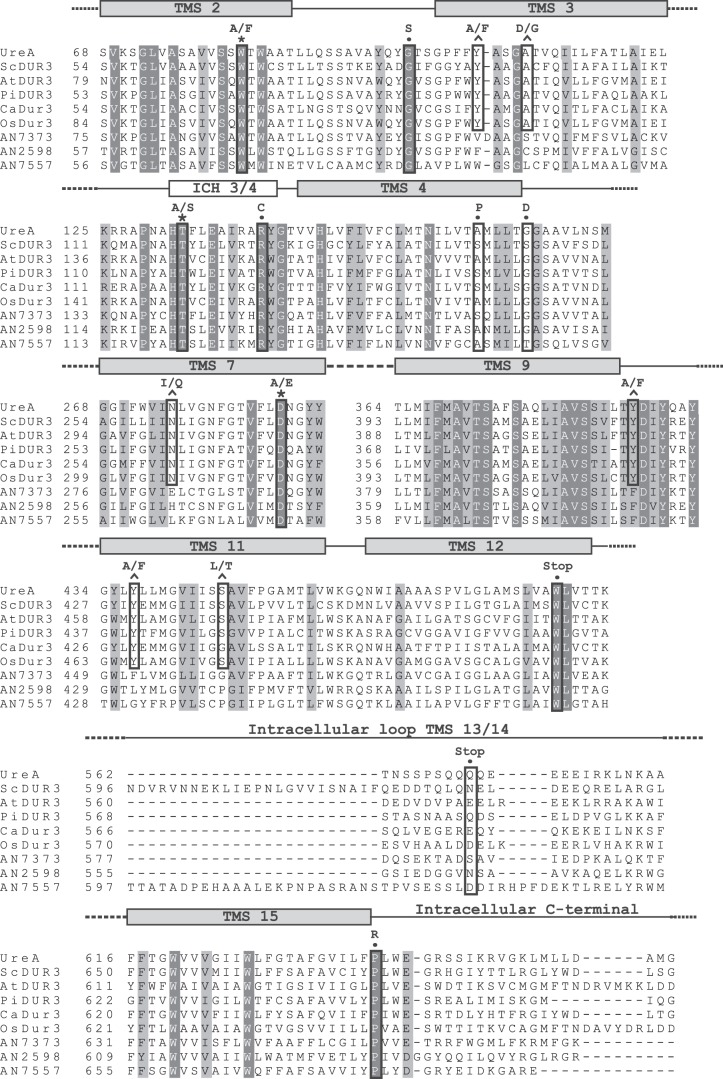
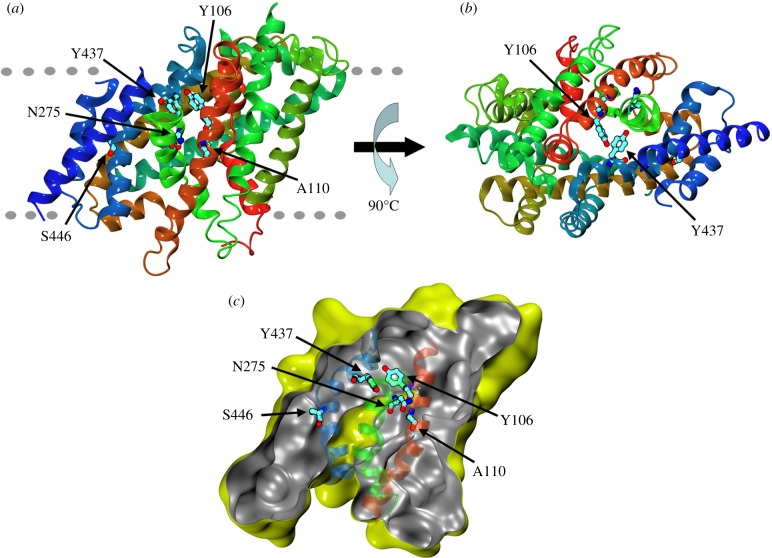
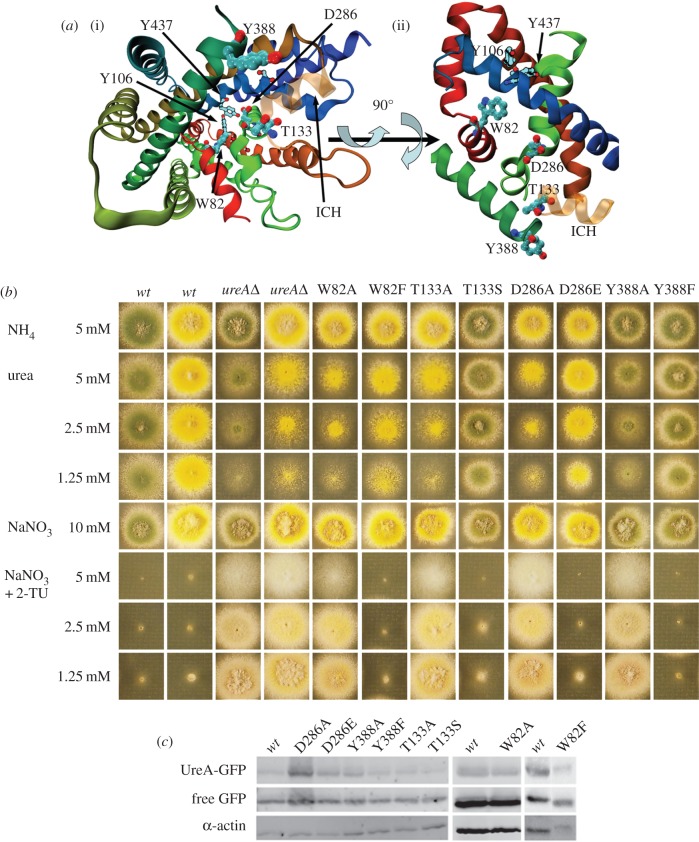
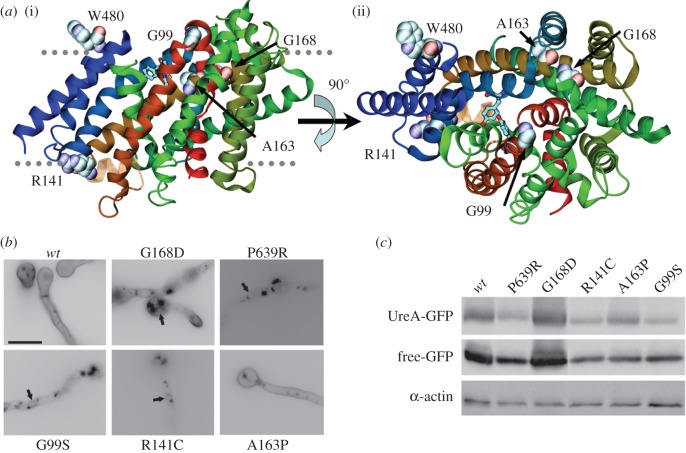
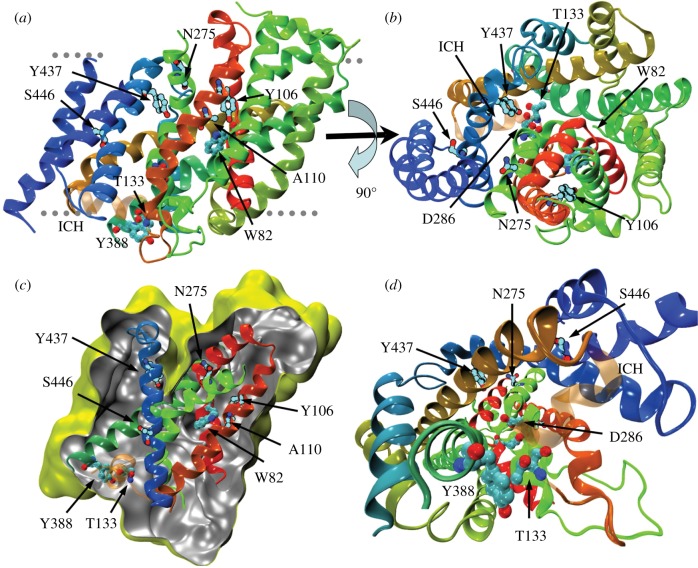
We present the first account of the structure-function relationships of a protein of the subfamily of urea/H(+) membrane transporters of fungi and plants, using Aspergillus nidulans UreA as a study model. Based on the crystal structures of the Vibrio parahaemolyticus sodium/galactose symporter (vSGLT) and of the Nucleobase-Cation-Symport-1 benzylhydantoin transporter from Microbacterium liquefaciens (Mhp1), we constructed a three-dimensional model of UreA which, combined with site-directed and classical random mutagenesis, led to the identification of amino acids important for UreA function. Our approach allowed us to suggest roles for these residues in the binding, recognition and translocation of urea, and in the sorting of UreA to the membrane. Residues W82, Y106, A110, T133, N275, D286, Y388, Y437 and S446, located in transmembrane helixes 2, 3, 7 and 11, were found to be involved in the binding, recognition and/or translocation of urea and the sorting of UreA to the membrane. Y106, A110, T133 and Y437 seem to play a role in substrate selectivity, while S446 is necessary for proper sorting of UreA to the membrane. Other amino acids identified by random classical mutagenesis (G99, R141, A163, G168 and P639) may be important for the basic transporter's structure, its proper folding or its correct traffic to the membrane.

Keywords: permease; sodium : solute symporter-family; structure–function relationships.


Figures

Figure 1.
Figure 1.
Multiple sequence alignment of UreA and homologues. Aligned sequences include A. nidulans UreA (GI: 67516273), characterized orthologues in fungi and plants—ScDur3 of S. cerevisiae (GI: 51013791), AtDur3 of A. thaliana (GI: 9758728), PiDur3 of P. involutus (sequence kindly provided by Morel et al. [10]), CaDur3 of C. albicans (GI: 68484979) and OsDur3 of O. sativa (GI: 115483686)—and UreA paralogues AN7373 (GI: 259483267), AN2598 (GI: 259488035) and AN7557 (GI: 67901140). Putative TMSs and the intracellular helix between TMS3 and TMS4 (ICH3/4) are represented by grey and white rectangles above the sequence, respectively. For space reasons, only those TMSs, ICHs and loops including mutated residues are shown; omitted segments are represented by dashed lines. Fully conserved amino acids are shaded in black, and structurally conserved amino acids are shaded in grey. The mutations obtained in this work, whether by classical or directed mutagenesis, are boxed in black; residues affected by directed mutagenesis and conserved in UreA orthologues but not in its paralogues are denoted by a circumflex above the sequence, while those affecting amino acids conserved in all UreA homologues are denoted by an asterisk. The aligned residues affected by classical mutagenesis are denoted by a filled circle.
Figure 2.
Figure 2.
Molecular model of UreA in the inward-facing, closed conformation. (a) Secondary structure elements are coloured by sequence number going continuously from red (amino terminal) to blue (carboxy terminal). The rough position of the membrane is indicated by the grey dotted lines with the extracellular surface on the upper part of the figure. (b) Same as (a), viewed from outside the membrane and rotated 90° along the membrane plane. (c) Solvent accessible surface calculated with a probe radius of 0.2 nm. The slice on the surface is taken perpendicularly to the membrane to show the inward-facing cavity. External and internal sides of the surface are yellow and grey, respectively. For clarity, only the semitransparent cartoon representation of helixes 3, 7 and 11 is shown, coloured as in (a).
Figure 3.
Figure 3.
Characterization of strains bearing mutations in residues conserved in functionally characterized UreA orthologues. (a) Growth phenotypes of mutant UreA strains at 37°C on urea as nitrogen source or on 2-thiourea with NaNO3 10 mM as nitrogen source to test resistance to the analogue. Growth on ammonium 5 mM and nitrate 10 mM are used as controls. A wt and a ureAΔ strain are shown as positive and negative controls, respectively. Similar results were obtained at 25°C (not shown). (b) Western blot analysis of total protein extracts of UreA–GFP mutants probed with anti-GFP antibody. Cultures were grown for 14–16 h at 25°C in derepressed conditions (proline as sole nitrogen source). The low mobility band corresponds to intact UreA–GFP and the high mobility band to free GFP (see text). Antibody against actin was used as an internal control of loading. (c) Epifluorescence and confocal microscopy of mutant bearing the S446L mutation grown in derepressing conditions, showing the retention of the UreA–GFP fusion in the ER, seen as perinuclear rings (indicated by arrows). Upper panels show the localization of the GFP signal. Wild-type UreA–GFP localization is shown as control. Middle panels show the localization to the nucleus of a histone H1 (HhoA)–mRFP fusion. Lower panels display the colocalization of GFP and RFP signals. Scale bar, 10 µm.
Figure 4.
Figure 4.
Analysis of strains bearing mutations in the putative intramolecular urea pathway. (a) Location of the mutated residues. (i) A perspective view into the inward-facing cavity. W82, T133, Y388 and D286 are shown from the cytoplasmic side. Y106 and Y437, which close the cavity, are shown for reference. The colouring of the cartoon is the same as in figure 2. The additional intracellular helix where T133 is located is shown as semitransparent in orange. (ii) A side view of the transporter showing the W82, T133, Y388 and D286 residues in the predicted urea path. For clarity, we show only the helixes where the residues chosen for directed mutagenesis are located. (b) Growth tests of strains bearing mutations in W82, T133, Y388 and D286 residues. Growth conditions were as described in figure 3a. yA+ and yA2 wt strains were used as positive controls so that each mutant strain could be compared with the relevant one. A ureAΔ strain is shown as a negative control. (c) Western blot analysis on total protein extracts of UreA–GFP mutants probed with anti-GFP antibody. See legend of figure 3b for details.
Figure 5.
Figure 5.
Analysis of mutants isolated by classical random mutagenesis. (a) Structural context of mutants isolated by classical random mutagenesis. (i) The UreA molecule is shown as helix-succession representation, coloured as in figure 2. The residues affected by the mutations are shown with a space-filling representation. For reference, Y106, A110, N275, Y437 and S446 are shown by stick representation. (ii) Same as (i), but seen from the extracellular side. Stick representations of Y106 and Y437 are included for reference. (b) Epifluorescence microscopy in greyscale inverted mode, showing in vivo subcellular expression of mutant UreA–GFP fusions. Arrows signal perinuclear ER membrane rings. (c) Western blot analysis on total protein extracts of UreA–GFP mutants probed with anti-GFP antibody. See legend of figure 3b for details.
Figure 6.
Figure 6.
Molecular model of UreA in the outward-facing conformation. (a) Secondary structure elements and amino acids are coloured as in figure 2. The approximate position of the membrane is indicated by the grey dotted lines with the extracellular side on the upper part of the figure. (b) Same as in (a), rotated 90° along the membrane plane and seen from the extracellular side. (c) Solvent accessible surface calculated with a probe radius of 0.2 nm. The slice on the surface is taken perpendicular to the membrane to show the outward-facing cavity. External and internal sides of the surface are yellow and grey, respectively. For clarity, we show only the helixes where the residues chosen for directed mutagenesis are located. (d) Perspective view into the outward-facing cavity from the intracellular side (compare with figure 5a). The colour of the cartoon is the same as figure 2, and the intracellular helix where T133 is located is shown as semitransparent.

References

    1. McDonald MD, Smith CP, Walsh PJ. 2006. The physiology and evolution of urea transport in fishes. J. Membr. Biol. 212, 93–107. (doi:10.1007/s00232-006-0869-5) - DOI - PubMed
    1. Witte CP. 2011. Urea metabolism in plants. Plant Sci. 180, 431–438. (doi:10.1016/j.plantsci.2010.11.010) - DOI - PubMed
    1. Wagemaker MJ, Welboren W, van der Drift C, Jetten MS, Van Griensven LJ, Op den Camp HJ. 2005. The ornithine cycle enzyme arginase from Agaricus bisporus and its role in urea accumulation in fruit bodies. Biochim. Biophys. Acta 1681, 107–115. (doi:10.1016/j.bbaexp.2004.10.007) - DOI - PubMed
    1. Smith CP. 2009. Mammalian urea transporters. Exp. Physiol. 94, 180–185. (doi:10.1113/expphysiol.2008.043042) - DOI - PubMed
    1. Davis RH. 1970. Sources of urea in Neurospora. Biochim. Biophys. Acta 215, 412–414. (doi:10.1016/0304-4165(70)90042-5) - DOI - PubMed

Publication types

MeSH terms

LinkOut - more resources