. 2014 Oct 1;112(7):1667-77.
doi: 10.1152/jn.00368.2014. Epub 2014 Jun 25.

Temperature systematically modifies neural activity for sweet taste

Affiliations

Temperature systematically modifies neural activity for sweet taste

David M Wilson et al. J Neurophysiol. .

Abstract

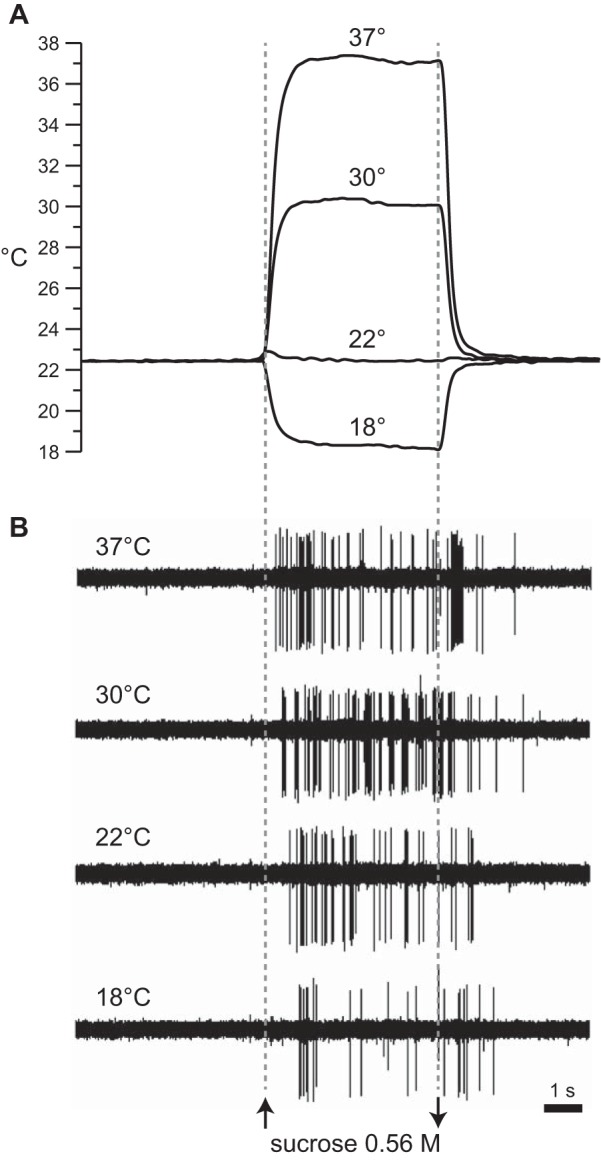
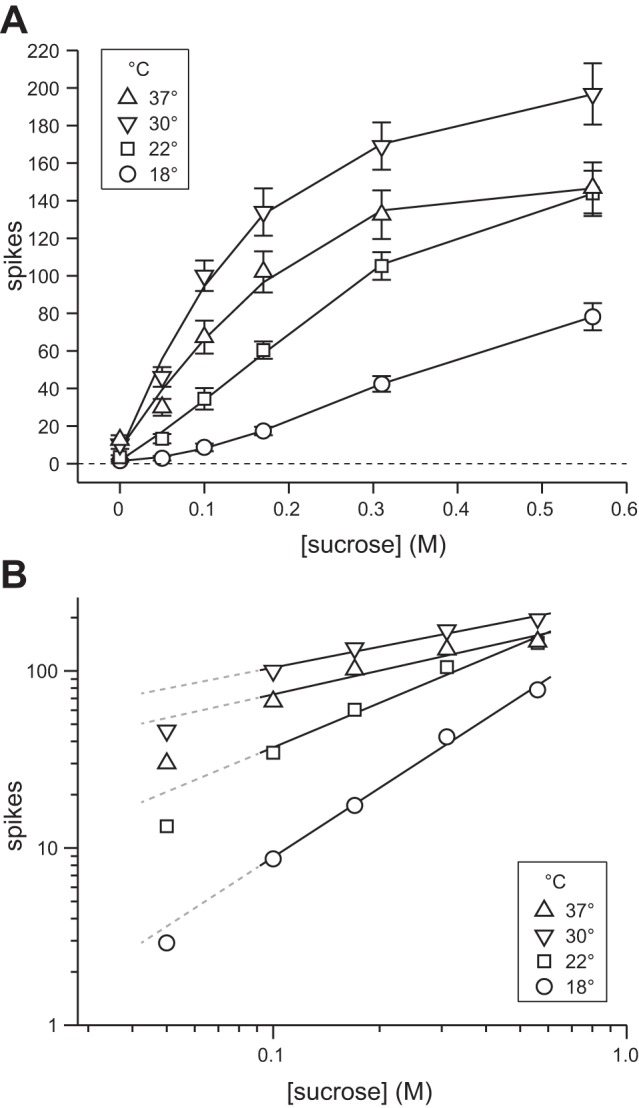
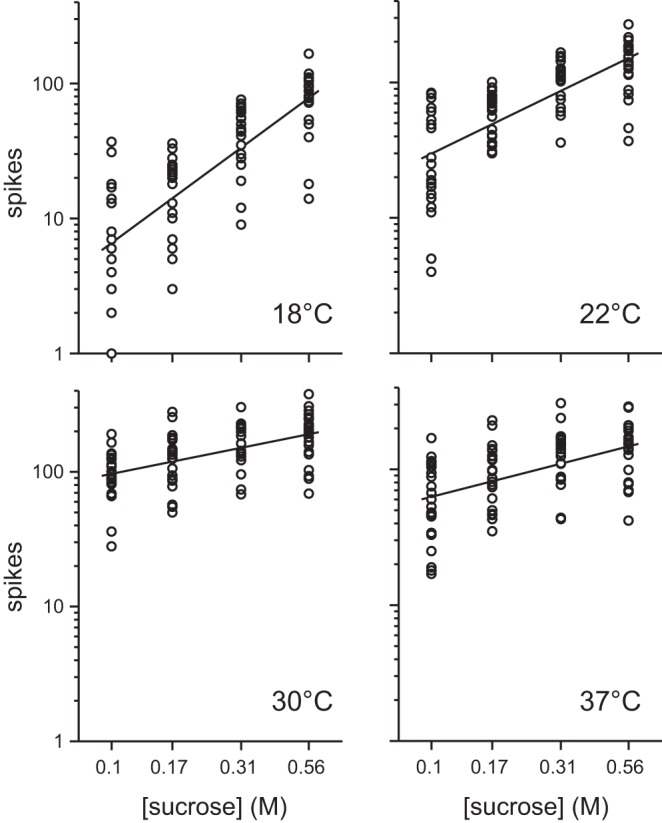
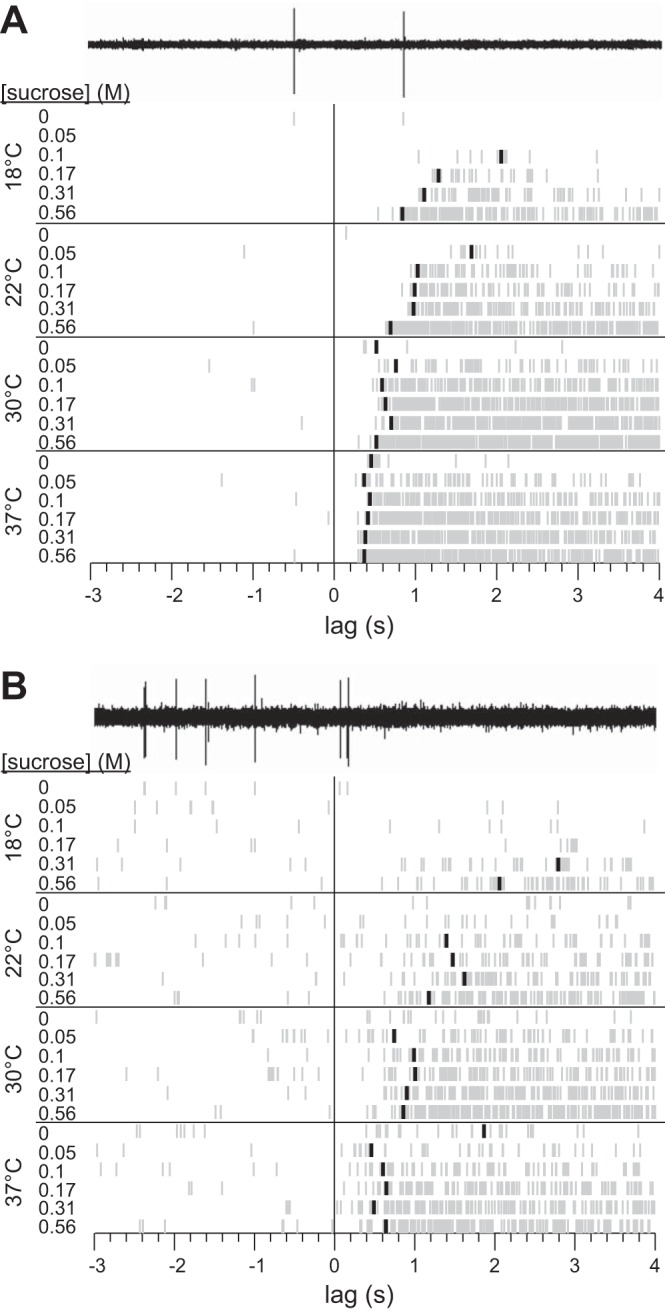
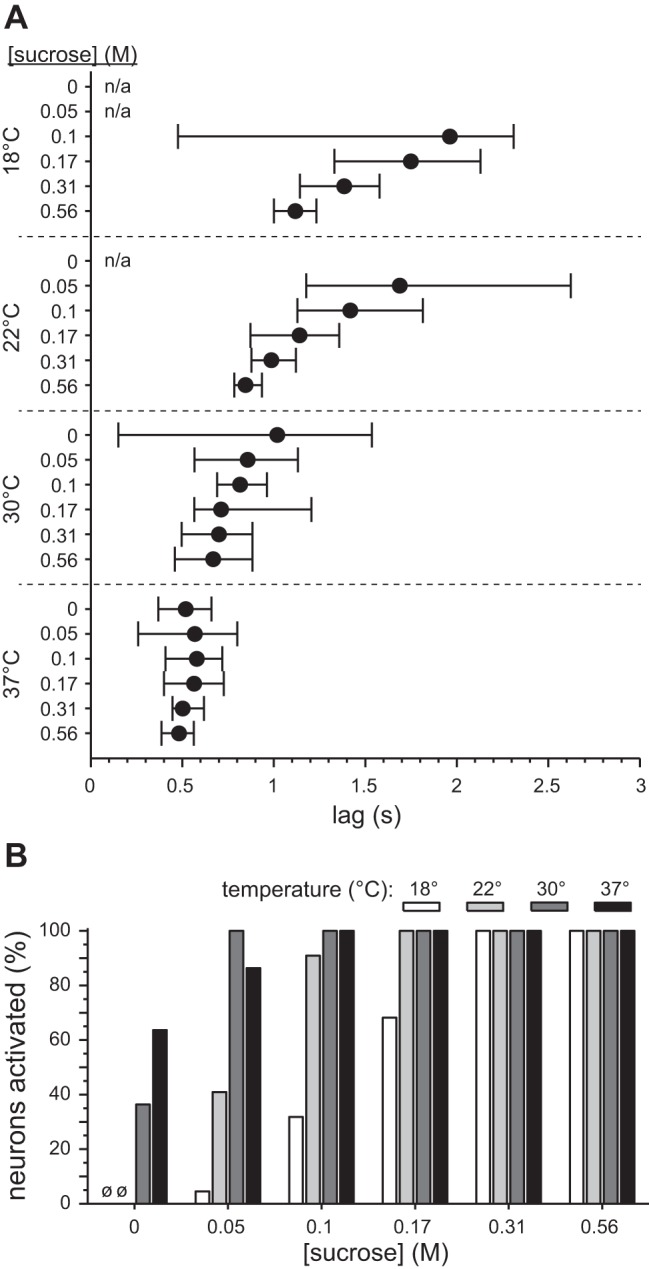
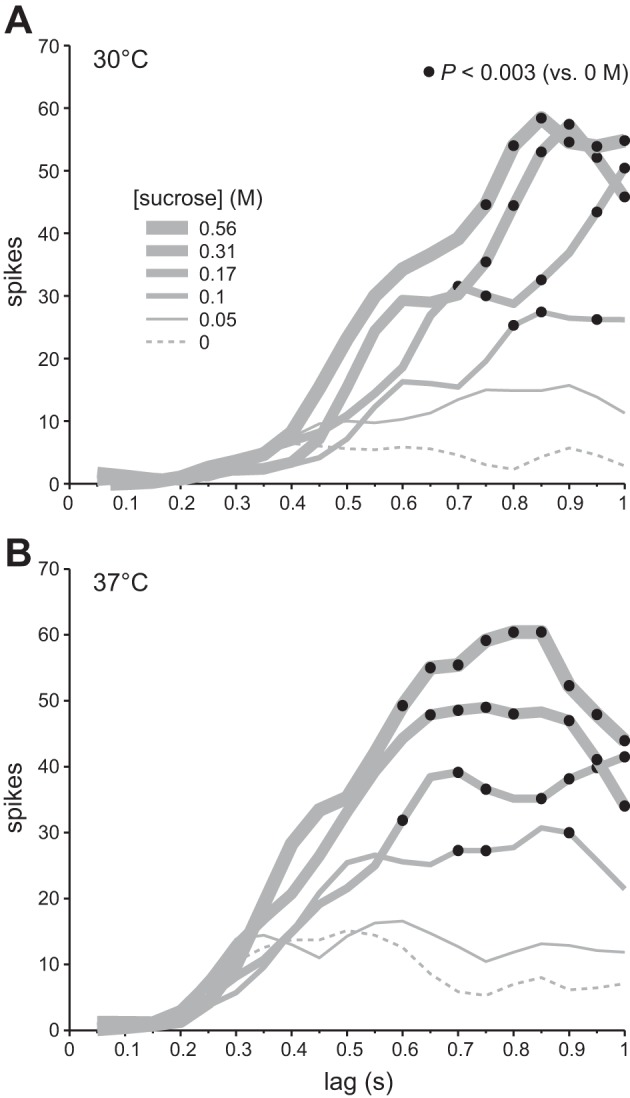
Temperature can modify neural and behavioral responses to taste stimuli that elicit "sweetness," a perception linked to intake of calorie-laden foods. However, the role of temperature in the neural representation of sweet taste is poorly understood. Here we made electrophysiological recordings from gustatory neurons in the medulla of inbred mice to study how adjustments in taste solution temperature to cool (18°C), ambient (22°C), and warm (30°C and 37°C) values changed the magnitude and latency of gustatory activity to sucrose (0, 0.05, 0.1, 0.17, 0.31, and 0.56 M). Analysis of 22 sucrose-best neurons revealed that temperature markedly influenced responses to sucrose, which, across concentrations, were largest when solutions were warmed to 30°C. However, reducing solution temperature from warm to ambient to cool progressively steepened the slope of the sucrose concentration-response function computed across cells (P < 0.05), indicating that mean activity to sucrose increased more rapidly with concentration steps under cooling than with warming. Thus the slope of the sucrose concentration-response function shows an inverse relation with temperature. Temperature also influenced latency to the first spike of the sucrose response. Across neurons, latencies were shorter when sucrose solutions were warmed and longer, by hundreds of milliseconds, when solutions were cooled (P < 0.05), indicating that temperature is also a temporal parameter of sucrose activity. Our findings reveal that temperature systematically modifies the timing of gustatory activity to sucrose in the mammalian brain and how this activity changes with concentration. Results further highlight how oral somatosensory cues function as physiological modulators of gustatory processing.

Keywords: coding; latency; sucrose; taste; temperature.


Figures

Fig. 1.
Fig. 1.
Example recordings from 1 S-type neuron. A: family of traces depicting real-time measurement of rinse and stimulus temperature, at the moment of oral delivery, on 4 separate trials where a fixed concentration of sucrose (0.56 M) was tested at 18°C, 22°C, 30°C, and 37°C. B: electrophysiological sweeps depicting trains of action potentials recorded in synchrony with temperature during each trial in A. Sweeps are aligned by time of stimulus onset (see materials and methods). Upward and downward arrows indicate stimulus onset and offset, respectively.
Fig. 2.
Fig. 2.
Effect of temperature on averaged concentration-response functions to sucrose. A: mean (±SE) responses across 22 S-type neurons to 0, 0.05, 0.1, 0.17, 0.31, and 0.56 M sucrose tested at 18°C, 22°C, 30°C, and 37°C. Data are plotted in linear coordinates. Solid lines represent quadratic fit of mean responses at each temperature. B: mean response values in A, except for 0 M, plotted in doubly logarithmic (base 10) coordinates. Solid lines represent least-squares fits applied to mean response values for 0.1, 0.17, 0.31, and 0.56 M sucrose at each temperature, operating on the logarithm of the mean response and the logarithm of concentration. Dashed lines extend fits for each temperature to allow visual comparison against activity to 0.05 M sucrose.
Fig. 3.
Fig. 3.
Responses by each of 22 S-type neurons to 0.1, 0.17, 0.31, and 0.56 M sucrose tested at 18°C, 22°C, 30°C, and 37°C. Data are plotted in doubly logarithmic (base 10) coordinates. Solid lines represent least-squares fits applied to all individual responses to these concentrations at each temperature, operating on the logarithm of neural activity and the logarithm of concentration. See materials and methods for details and Table 1 for regression results.
Fig. 4.
Fig. 4.
Rastergrams for 2 separately recorded S-type neurons (A and B) showing detection of latency to first spike across 24 unique temperature-concentration combination trials for sucrose. The electrophysiological sweep recorded for 0 M sucrose at 18°C is shown for each cell to demonstrate conversion of neurophysiological data to raster spikes. A blackened raster spike on a trial represents the time during stimulus delivery when the firing rate of the neuron became unusually high compared with the average prestimulus firing rate of the cell (see materials and methods). The absence of a blackened spike indicates that no significant elevation in firing was detected for that trial.
Fig. 5.
Fig. 5.
Effect of temperature on latency to first spike to sucrose across 22 S-type neurons. A: median latency (filled circles) and 95% confidence limits for the median (whiskers) for each of the 24 sucrose temperature-concentration conditions. Confidence limits were approximated with a bootstrap resampling procedure (see materials and methods). n/a, Interval not applicable: no or too few cells activated. B: % of neurons within each temperature-concentration condition for sucrose where latency to first spike could be detected (i.e., neurons that showed significant activation to sucrose). ø, No cells activated (0 M sucrose at 18°C and 22°C).
Fig. 6.
Fig. 6.
Time course of neuronal responses to 0, 0.05, 0.1, 0.17, 0.31, and 0.56 M sucrose tested at 30°C (A) and 37°C (B). In each panel, a family of traces (gray lines) depicts time-evolved activity by 22 S-type neurons to multiple sucrose concentrations, where traces for different concentrations are denoted by line thickness. To construct each plot, individual spike trains were binned (50 ms) and spike counts in time-aligned bins were summed across cells. Each trace connects points for sequential response bins for 1 concentration. Bins are referenced along the x-axis by their time of closure (e.g., data for the 0–0.05 s bin are plotted at 0.05 s on x-axis). Filled circles denote bins where median activity to sucrose was significantly greater than median activity to isothermal water (i.e., 0 M sucrose). Response traces represent smoothed data (lowess method), although statistical comparisons were made with raw spike counts.

References

    1. Askwith CC, Benson CJ, Welsh MJ, Snyder PM. DEG/ENaC ion channels involved in sensory transduction are modulated by cold temperature. Proc Natl Acad Sci USA 98: 6459–6463, 2001 - PMC - PubMed
    1. Bachmanov AA, Li X, Reed DR, Ohmen JD, Li S, Chen Z, Tordoff MG, de Jong PJ, Wu C, West DB, Chatterjee A, Ross DA, Beauchamp GK. Positional cloning of the mouse saccharin preference (Sac) locus. Chem Senses 26: 925–933, 2001 - PMC - PubMed
    1. Bair W, Koch C. Temporal precision of spike trains in extrastriate cortex of the behaving macaque monkey. Neural Comput 8: 1185–1202, 1996 - PubMed
    1. Bartoshuk LM, Rennert K, Rodin J, Stevens JC. Effects of temperature on the perceived sweetness of sucrose. Physiol Behav 28: 905–910, 1982 - PubMed
    1. Breza JM, Curtis KS, Contreras RJ. Temperature modulates taste responsiveness and stimulates gustatory neurons in the rat geniculate ganglion. J Neurophysiol 95: 674–685, 2006 - PubMed

Publication types

LinkOut - more resources