

Morphological and histological adaptation of muscle and bone to loading induced by repetitive activation of muscle
- PMID: 24966314
- PMCID: PMC4083794
- DOI: 10.1098/rspb.2014.0786
Morphological and histological adaptation of muscle and bone to loading induced by repetitive activation of muscle
Abstract
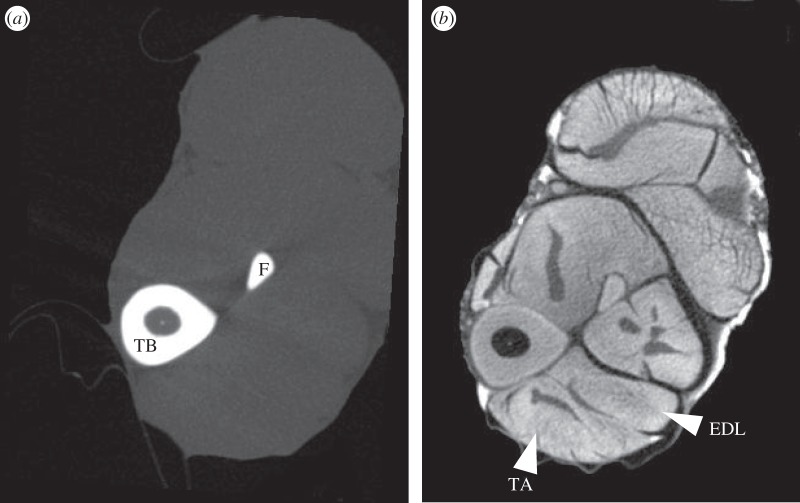
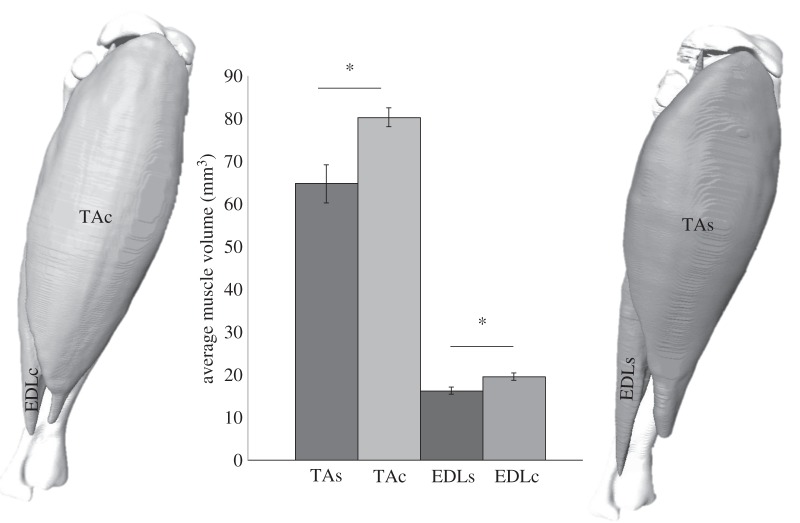
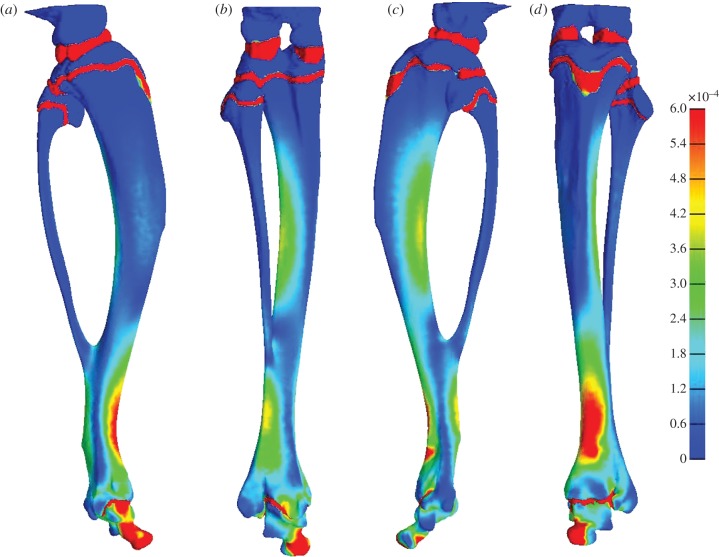
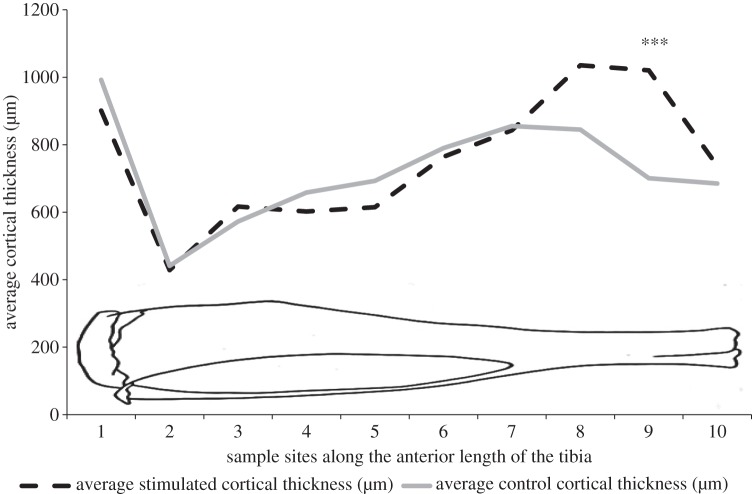
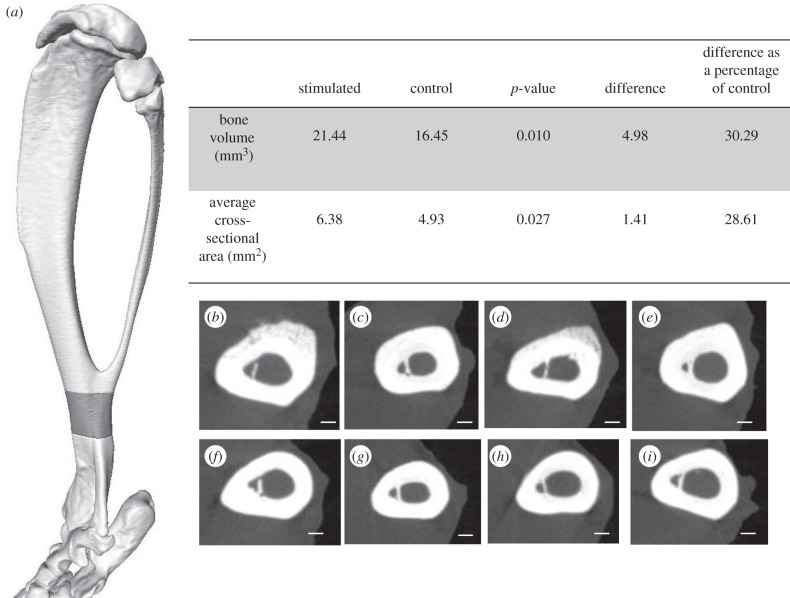
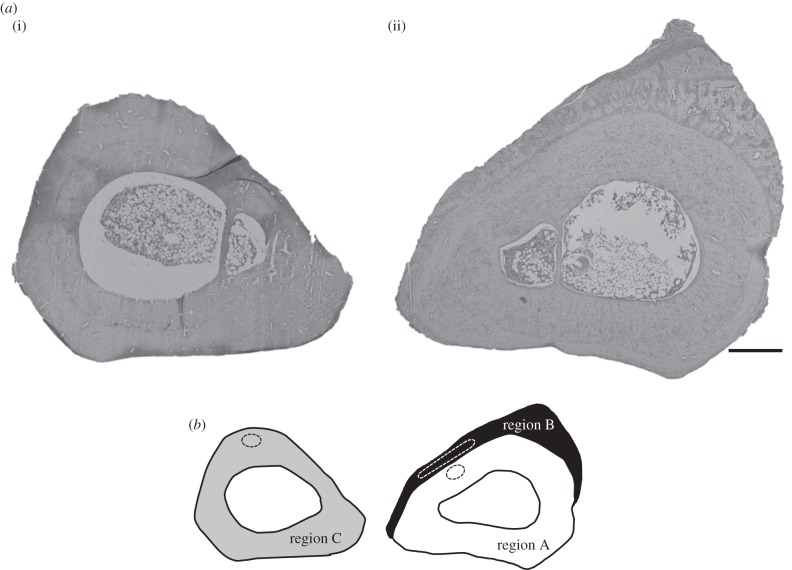
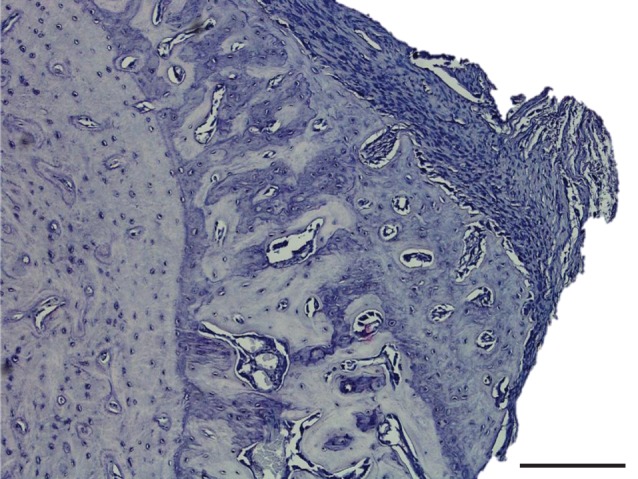
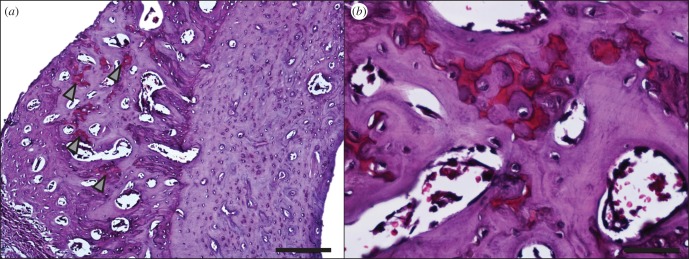
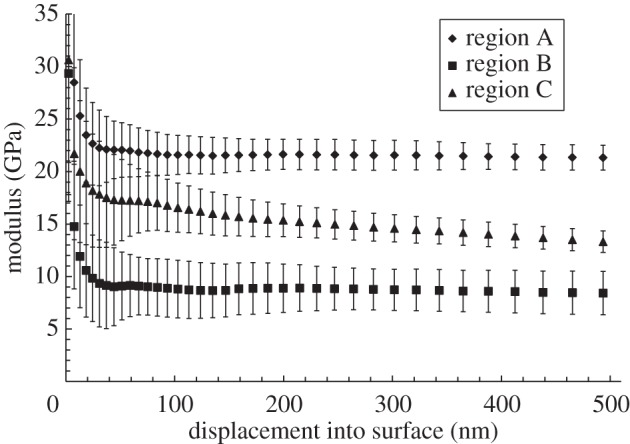
Muscular contraction plays a pivotal role in the mechanical environment of bone, but controlled muscular contractions are rarely used to study the response of bone to mechanical stimuli. Here, we use implantable stimulators to elicit programmed contractions of the rat tibialis anterior (TA) muscle. Miniature stimulators were implanted in Wistar rats (n = 9) to induce contraction of the left TA every 30 s for 28 days. The right limb was used as a contralateral control. Hindlimbs were imaged using microCT. Image data were used for bone measurements, and to construct a finite-element (FE) model simulation of TA forces propagating through the bone. This simulation was used to target subsequent bone histology and measurement of micromechanical properties to areas of high strain. FE mapping of simulated strains revealed peak values in the anterodistal region of the tibia (640 µε ± 30.4 µε). This region showed significant increases in cross-sectional area (28.61%, p < 0.05) and bone volume (30.29%, p < 0.05) in the stimulated limb. Histology revealed a large region of new bone, containing clusters of chondrocytes, indicative of endochondral ossification. The new bone region had a lower elastic modulus (8.8 ± 2.2 GPa) when compared with established bone (20 ± 1.4 GPa). Our study provides compelling new evidence of the interplay between muscle and bone.
Keywords: bone; loading; mechanotransduction; muscle electrical stimulation.
© 2014 The Author(s) Published by the Royal Society. All rights reserved.
Figures
Similar articles
-
Low amplitude, high frequency strains imposed by electrically stimulated skeletal muscle retards the development of osteopenia in the tibiae of hindlimb suspended rats.Med Eng Phys. 2005 May;27(4):285-93. doi: 10.1016/j.medengphy.2004.12.014. Med Eng Phys. 2005. PMID: 15823469
-
SpillOver stimulation: A novel hypertrophy model using co-contraction of the plantar-flexors to load the tibial anterior muscle in rats.PLoS One. 2018 Nov 20;13(11):e0207886. doi: 10.1371/journal.pone.0207886. eCollection 2018. PLoS One. 2018. PMID: 30458051 Free PMC article.
-
An Integrated Musculoskeletal-Finite-Element Model to Evaluate Effects of Load Carriage on the Tibia During Walking.J Biomech Eng. 2016 Oct 1;138(10). doi: 10.1115/1.4034216. J Biomech Eng. 2016. PMID: 27437640
-
In-situ measurements of tensile forces in the tibialis anterior tendon of the rat in concentric, isometric, and resisted co-contractions.Physiol Rep. 2017 Apr;5(8):e13245. doi: 10.14814/phy2.13245. Physiol Rep. 2017. PMID: 28420761 Free PMC article.
-
Principles of determination and verification of muscle forces in the human musculoskeletal system: Muscle forces to minimise bending stress.J Biomech. 2010 Feb 10;43(3):387-96. doi: 10.1016/j.jbiomech.2009.09.049. Epub 2009 Oct 31. J Biomech. 2010. PMID: 19880120 Review.
Cited by
-
Patient-Specific Bone Multiscale Modelling, Fracture Simulation and Risk Analysis-A Survey.Materials (Basel). 2019 Dec 24;13(1):106. doi: 10.3390/ma13010106. Materials (Basel). 2019. PMID: 31878356 Free PMC article. Review.
-
A novel miniature in-line load-cell to measure in-situ tensile forces in the tibialis anterior tendon of rats.PLoS One. 2017 Sep 21;12(9):e0185209. doi: 10.1371/journal.pone.0185209. eCollection 2017. PLoS One. 2017. PMID: 28934327 Free PMC article.
-
MiniVStimA: A miniaturized easy to use implantable electrical stimulator for small laboratory animals.PLoS One. 2020 Oct 30;15(10):e0241638. doi: 10.1371/journal.pone.0241638. eCollection 2020. PLoS One. 2020. PMID: 33125415 Free PMC article.
-
Diffusible iodine-based contrast-enhanced computed tomography (diceCT): an emerging tool for rapid, high-resolution, 3-D imaging of metazoan soft tissues.J Anat. 2016 Jun;228(6):889-909. doi: 10.1111/joa.12449. Epub 2016 Mar 11. J Anat. 2016. PMID: 26970556 Free PMC article. Review.
-
Experimental evidence that physical activity affects the multivariate associations among muscle attachments (entheses).J Exp Biol. 2019 Dec 10;222(Pt 23):jeb213058. doi: 10.1242/jeb.213058. J Exp Biol. 2019. PMID: 31712353 Free PMC article.
References
-
- Wolff J. 1892. Das gesetz der transformation der knochen. Deutsche Medizinische Wochenschrift 19, 1222–1224. (10.1055/s-0028-1144106) - DOI
Publication types
MeSH terms
LinkOut - more resources
Full Text Sources
Other Literature Sources
