. 2014 Sep 5;289(36):25186-98.
doi: 10.1074/jbc.M113.537746. Epub 2014 Jun 25.

Antiviral responses in mouse embryonic stem cells: differential development of cellular mechanisms in type I interferon production and response

Affiliations

Antiviral responses in mouse embryonic stem cells: differential development of cellular mechanisms in type I interferon production and response

Ruoxing Wang et al. J Biol Chem. .

Abstract

We have recently reported that mouse embryonic stem cells (mESCs) are deficient in expressing type I interferons (IFNs) in response to viral infection and synthetic viral RNA analogs (Wang, R., Wang, J., Paul, A. M., Acharya, D., Bai, F., Huang, F., and Guo, Y. L. (2013) J. Biol. Chem. 288, 15926-15936). Here, we report that mESCs are able to respond to type I IFNs, express IFN-stimulated genes, and mediate the antiviral effect of type I IFNs against La Crosse virus and chikungunya virus. The major signaling components in the IFN pathway are expressed in mESCs. Therefore, the basic molecular mechanisms that mediate the effects of type I IFNs are functional in mESCs; however, these mechanisms may not yet be fully developed as mESCs express lower levels of IFN-stimulated genes and display weaker antiviral activity in response to type I IFNs when compared with fibroblasts. Further analysis demonstrated that type I IFNs do not affect the stem cell state of mESCs. We conclude that mESCs are deficient in type I IFN expression, but they can respond to and mediate the cellular effects of type I IFNs. These findings represent unique and uncharacterized properties of mESCs and are important for understanding innate immunity development and ESC physiology.

Keywords: Antiviral Response; Double-stranded RNA (dsRNA); Embryonic Stem Cell; Innate Immunity; Interferon; Interferon-stimulated Genes; Viral Replication.


Figures

FIGURE 1.
FIGURE 1.
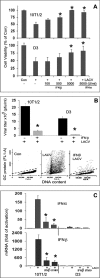
IFNβ and IFNω protect 10T1/2 cells and mESCs from LACV-induced cell death. A, 10T1/2 and D3 cells were pretreated with IFNβ or IFNω for 24 h or left untreated and then infected with LACV at m.o.i. of 1 and 10, respectively. Viable cells were determined at 48 h post-infection. The control (Con) represents cells without viral infection. B, cells were pretreated with 5000 units/ml IFNβ for 24 h followed by infection with LACV for an additional 24 h under the conditions described in A. Graph shows LACV titers in the culture medium of infected cells as measured by plaque assay. Flow cytometry profile shows the cells that express LACV Gc protein (the populations above the dashed lines). Con represents cells without viral infection. C, induction of IFNα and IFNβ mRNA by LACV infection (under the conditions described in B) was determined at 12 h post-infection. The mRNA level in control is designated as 1. *, p < 0.05, compared with virus-infected cells without IFN pretreatment.
FIGURE 2.
FIGURE 2.
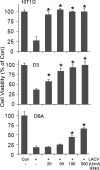
IFNα protects 10T1/2 cells and mESCs from LACV-induced cell death. Cells were pretreated with IFNα for 24 h or left untreated, followed by LACV infection at m.o.i. of 5. Viable cells were determined at 55 h post-infection. The control (Con) represents cells without viral infection. *, p < 0.05, compared with LACV-infected cells without IFN pretreatment.
FIGURE 3.
FIGURE 3.
IFNα protects 10T1/2 and mESCs from CHIKV-induced cell death. A, 10T1/2 cells and mESCs (D3 and DBA) were pretreated with different concentrations of IFNα for 24 h or left untreated. The cells were then infected with CHIKV at an m.o.i. of 2. Viable cells were determined at 48 h post-infection. The control (Con) represents cells without viral infection. B, IFNα represses CHIKV replication in 10T1/2 and D3 cells. The cells were pretreated with 500 units/ml IFNα for 24 h followed by infection with CHIKV for an additional 24 h under the conditions described in A. The CHIKV titers in the culture medium of infected cells were measured by plaque assay. *, p < 0.05, compared with CHIKV-infected cells without IFN pretreatment.
FIGURE 4.
FIGURE 4.
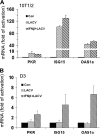
LACV infection-induced antiviral molecules and the effects of IFNβ. 10T1/2 cells (A) and D3 cells (B) were infected with LACV at m.o.i. of 1 and 10, respectively, or they were pretreated with 5000 units/ml IFNβ for 24 h followed by LACV infection (IFNβ + LACV) for 12 h. The results are expressed as fold-activation where the mRNA level in control cells (Con, cells without viral infection) is designated as 1.
FIGURE 5.
FIGURE 5.
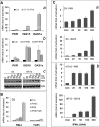
IFNβ- and IFNα-induced ISG expression in 10T1/2 cells and mESCs. A, 10T1/2 cells (panel a) mESCs (D3 and DBA) (panel b) were treated with 5000 units/ml IFNβ for 12 h. The mRNA levels of PKR, ISG15, and OAS1a are expressed as fold-activation where the mRNA level in control cells (Con, cells without IFNβ treatment) is designated as 1. IFNβ-induced PKR was analyzed by Western blot. β-Actin was used as a control for protein loading (panel c). B, D3 cells were transfected with poly(I-C) (300 ng/ml), or treated with IFNβ (5000 units/ml) separately, or pretreated with IFNβ for 24 h followed by poly(I-C) transfection. The mRNA levels of RIG-I and TLR3 were determined at 12-h incubation, and are expressed as fold-activation where the mRNA level in control is designated as 1. C, D3 and 10T1/2 cells were treated with different concentrations of IFNα for 12 h. The mRNA levels of PKR and ISG15 are expressed as fold-activation where the mRNA level in control cells (Con) is designated as 1.
FIGURE 6.
FIGURE 6.
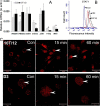
Expression of type I IFN signaling molecules and activation of STAT1 in 10T1/2 cells and mESCs. A, relative mRNA level of each gene in untreated D3 and 10T1/2 cells was compared after normalization to β-actin mRNA in each cell type. *, p < 0.05, the same gene compared in the two cell types. B, expression of STAT1 in untreated D3 and 10T1/2 cells analyzed by flow cytometry. The control (Con) represents cells without STAT1antibodies. C, immunodetection of STAT1 nuclear translocation. 10T12 cells and D3 cells were treated with IFNα (500 units/ml) for 15 and 60 min. The cellular location of pSTAT1 was detected by its antibody under an LSM 510 laser-scanning confocal microscope. The control (Con) represents cells without IFNα treatment. In 10T1/2 cells, an arrowhead denotes the nucleus of a single cell (upper panels). In D3 cells, an arrowhead denotes the nucleus of a cell within a colony (lower panels).
FIGURE 7.
FIGURE 7.
Expression patterns of ISGs in 10T1/2 and mESCs. D3 and 10T1/2 cells were treated with 5000 units/ml IFNβ for the indicated time points. A–C, relative mRNA levels of the three indicated genes were analyzed by RT-qPCR. The results are expressed as fold-activation where the mRNA level in control cells is designated as 1. The gel insets in C are PCR products of SOCS1 analyzed by agarose gel electrophoresis. The control (Con) represents cells without IFNβ treatment. D, D3 cells were transfected with siRNA targeting SOCS1 or with control siRNA (Con). After 24 h, the cells were treated with IFNβ for 4 or 24 h. The mRNA levels of ISG15 and SOCS1 were determined by RT-qPCR. The mRNA in the control cells was expressed as 100%.
FIGURE 8.
FIGURE 8.
IFNβ potentiates poly(I-C)-inhibited proliferation of mESC. A, D3 cells were transfected with 300 ng/ml poly(I-C) alone (PolyIC) or pretreated with IFNβ (5000 units/ml) for 24 h followed by poly(I-C) transfection (IFNβ/PolyIC). The cells with phosphorylated eIF2α (p-eIF2α) were quantified by flow cytometry at 6 and 24 h after poly(I-C) transfection (boxed areas, white slash lines were used to help identify the bottom sides of the boxes). B, cells treated under the condition described in A at 24 h were analyzed for cell cycle by flow cytometry. The change in G2/M phase cells is indicated by the arrow. C, numbers of viable cells in the samples described in B were determined by toluidine blue cell staining. The control (Con) represents cells without any treatment. *, p < 0.05, compared with the cells treated with poly(I-C) alone.
FIGURE 9.
FIGURE 9.
Type I IFNs do not affect the stem cell state of mESCs. D3 cells were treated with IFNβ or IFNω (5000 units/ml) for 24 or 48 h. The cells were then analyzed for the following. A, cell cycle progression by flow cytometry; B, cell proliferation by toluidine blue cell staining (24-h treatment); C, cell/colony morphology analysis by microscopy (48 h treatment); D and E, mRNA levels of pluripotency markers by RT-qPCR in the cells that were treated with IFNβ for 48 h once (D) or twice (two times for 48 h) (E). PKR was used as a positive control. The control (Con) represents cells without IFNβ treatment.
FIGURE 10.
FIGURE 10.
mESC-FB differentiation and response to IFNs. A, morphology of undifferentiated DBA mESCs (DBA), RA differentiated cells (10dRA), purified fibroblasts (DBA-FBs), and 10T1/2 cells. The images were acquired from live cells (DBA and 10dRA) and toluidine blue-stained cells (DBA-FBs and 10T1/2 cells) under a phase contrast microscope. B, cell marker expression in DBA-FBs and 10T1/2 cells. The cells were immunostained with antibodies against indicated cell markers and detected with rhodamine- (red) or FITC (green)-labeled secondary antibodies. The images were acquired with an LSM 510 laser-scanning confocal microscope (Zeiss). Scale bar, 20 μm. C, IFN-induced ISG expression in 10T1/2 cells and mESC-FBs. Cells were treated with IFNα (500 units/ml) or IFNβ (5000 units/ml) for 12 h. The mRNA levels of ISG15 are expressed as fold-activation where the mRNA level in their respective control cells (without IFN treatment) is designated as 1 (data not shown). D, IFNα protects mESC-FBs from CHIKV-induced cell death. DBA-FBs and D3-FBs were pretreated with the indicated concentrations of IFNα for 24 h or left untreated (0 units/ml). The cells were then infected with CHIKV at m.o.i. of 1. Viable cells were determined at 24 h post-infection. Control (Con) represents cells without viral infection. *, p < 0.05, compared with CHIKV-infected cells without IFN pretreatment.

Similar articles

Cited by

References

    1. Niwa H. (2007) How is pluripotency determined and maintained? Development 134, 635–646 - PubMed
    1. Wobus A. M., Boheler K. R. (2005) Embryonic stem cells: prospects for developmental biology and cell therapy. Physiol. Rev. 85, 635–678 - PubMed
    1. Földes G., Liu A., Badiger R., Paul-Clark M., Moreno L., Lendvai Z., Wright J. S., Ali N. N., Harding S. E., Mitchell J. A. (2010) innate immunity in human embryonic stem cells: comparison with adult human endothelial cells. PLoS ONE 5, e10501. - PMC - PubMed
    1. Zampetaki A., Xiao Q., Zeng L., Hu Y., Xu Q. (2006) TLR4 expression in mouse embryonic stem cells and in stem cell-derived vascular cells is regulated by epigenetic modifications. Biochem. Biophys. Res. Commun. 347, 89–99 - PubMed
    1. Glaser D. E., Gower R. M., Lauer N. E., Tam K., Blancas A. A., Shih A. J., Simon S. I., McCloskey K. E. (2011) Functional characterization of embryonic stem cell-derived endothelial cells. J. Vasc. Res. 48, 415–428 - PMC - PubMed

Publication types

MeSH terms

LinkOut - more resources