. 2014 Jun 25;34(26):8837-44.
doi: 10.1523/JNEUROSCI.5265-13.2014.

Low-level image properties of visual objects predict patterns of neural response across category-selective regions of the ventral visual pathway

Affiliations

Low-level image properties of visual objects predict patterns of neural response across category-selective regions of the ventral visual pathway

Grace E Rice et al. J Neurosci. .

Erratum in

  • J Neurosci. 2014 Sep 10:34(37):12616

Abstract

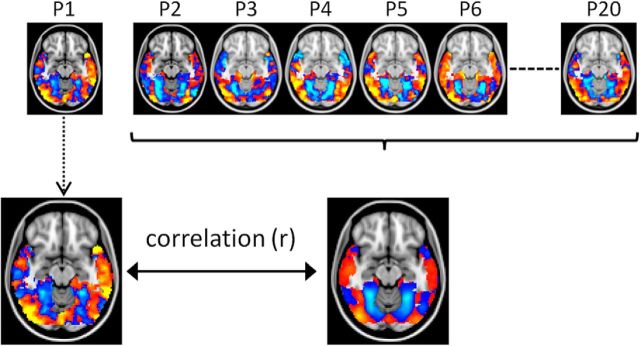
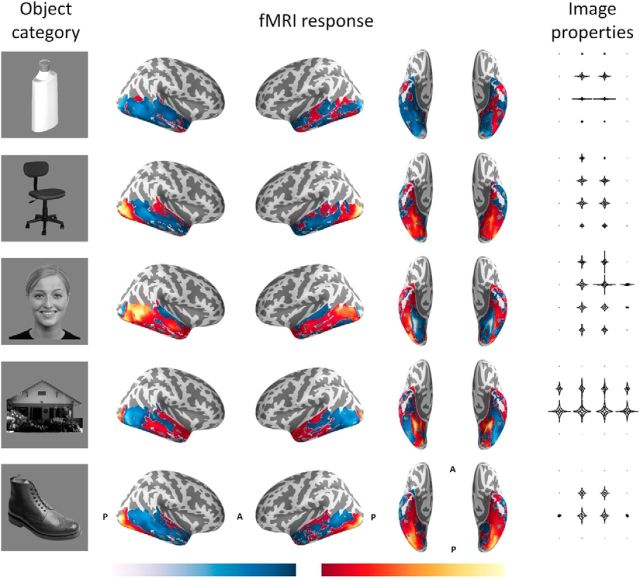
Neuroimaging studies have revealed strong selectivity for object categories in high-level regions of the human visual system. However, it is unknown whether this selectivity is truly based on object category, or whether it reflects tuning for low-level features that are common to images from a particular category. To address this issue, we measured the neural response to different object categories across the ventral visual pathway. Each object category elicited a distinct neural pattern of response. Next, we compared the patterns of neural response between object categories. We found a strong positive correlation between the neural patterns and the underlying low-level image properties. Importantly, this correlation was still evident when the within-category correlations were removed from the analysis. Next, we asked whether basic image properties could also explain variation in the pattern of response to different exemplars from one object category (faces). A significant correlation was also evident between the similarity of neural patterns of response and the low-level properties of different faces, particularly in regions associated with face processing. These results suggest that the appearance of category-selective regions at this coarse scale of representation may be explained by the systematic convergence of responses to low-level features that are characteristic of each category.

Keywords: MVPA; category; fMRI; faces; object.


Figures

Figure 1.
Figure 1.
Examples of images from the different object categories: bottles, chairs, faces, houses, and shoes.
Figure 2.
Figure 2.
Schematic diagram of pattern analysis procedure. A LOPO method was used to measure patterns of response to different stimulus conditions. In this analysis, the pattern of response elicited by one participant is compared with the pattern generated by a group analysis of all remaining participants. This procedure is repeated for all combinations of stimulus conditions and participants. This example shows the response to faces from an individual participant and the group. This cross-validation analysis was used to ask whether the patterns of response to different object categories are consistent across participants.
Figure 3.
Figure 3.
Location of regional masks in the ventral visual pathway. The ventral stream mask was based on a concatenation of the individual anatomical masks.
Figure 4.
Figure 4.
Schematic illustration of the calculation of a GIST descriptor for an example image. A series of Gabor filters across eight orientations and four spatial frequencies are applied to the image. Each of the resulting 32 filtered images is then windowed along a 4 × 4 grid to give a final GIST descriptor of 512 values (right).
Figure 5.
Figure 5.
Topographic patterns of response to different object categories (left) in the ventral visual pathway. Red/yellow and blue/light blue colors represent positive and negative fMRI responses relative to the mean response across all objects. The patterns or response are restricted to the combined ventral visual pathway mask (see Fig. 3). Average image properties from each object category were described by contour plots of the Fourier power spectra across different spatial locations in the image.
Figure 6.
Figure 6.
Relationship between fMRI response and low-level image properties. Correlation matrices showing the within-category and between-category correlations in (A) fMRI response across the ventral visual pathway and (B) the image properties of different object categories. C, Scatter plot showing a strong positive correlation (r = 0.79) between the correlation matrices in A and B, demonstrating that patterns of fMRI response are closely linked to low-level image properties.
Figure 7.
Figure 7.
Correlation between fMRI response to different object categories and GIST description across subregions of the ventral visual pathway. The scatter plots show variation in the way that low-level image properties described by the GIST can explain the pattern of response across the ventral visual pathway.
Figure 8.
Figure 8.
Relationship between fMRI response and low-level image properties of exemplars from one category (faces). Correlation matrices showing the within-category and between-category correlations in (A) the fMRI response across the ventral visual pathway and (B) the image properties of different faces. C, Scatter plot showing the correlation between the correlation matrices in A and B. These results show that the low-level image properties are able to predict the topographic pattern of response to exemplars of a single object category (r = 0.44), although the relationship is not as strong when compared with exemplars from different object categories (Fig. 6).
Figure 9.
Figure 9.
Correlation between fMRI response to different faces and GIST description across subregions of the ventral visual pathway. The scatter plots show variation in the way that low-level image properties described by the GIST can explain the pattern of response to different faces across the ventral visual pathway. It is interesting to note that significant positive correlations were only evident in the Fusiform (Temporal–Occipital, Occipital) and Lingual gyri.

Comment in

References

    1. Arcaro MJ, McMains SA, Singer BD, Kastner S. Retinotopic organization of human ventral visual cortex. J Neurosci. 2009;29:10638–10652. doi: 10.1523/JNEUROSCI.2807-09.2009. - DOI - PMC - PubMed
    1. Baldassi C, Alemi-Neissi A, Pagan M, Dicarlo JJ, Zecchina R, Zoccolan D. Shape similarity, better than semantic membership, accounts for the structure of visual object representations in a population of monkey inferotemporal neurons. PLoS Comput Biol. 2013;9:e1003167. doi: 10.1371/journal.pcbi.1003167. - DOI - PMC - PubMed
    1. Brewer AA, Liu J, Wade AR, Wandell BA. Visual field maps and stimulus selectivity in human ventral occipital cortex. Nat Neurosci. 2005;8:1102–1109. doi: 10.1038/nn1507. - DOI - PubMed
    1. Chao LL, Haxby JV, Martin A. Attribute-based neural substrates in temporal cortex for perceiving and knowing about objects. Nat Neurosci. 1999;2:913–919. doi: 10.1038/13217. - DOI - PubMed
    1. Cohen L, Dehaene S, Naccache L, Lehéricy S, Dehaene-Lambertz G, Hénaff MA, Michel F. The visual word form area: spatial and temporal characterization of an initial stage of reading in normal subjects and posterior split-brain patients. Brain. 2000;123:291–307. doi: 10.1093/brain/123.2.291. - DOI - PubMed

Publication types