

Bias atlases for segmentation-based PET attenuation correction using PET-CT and MR
- PMID: 24966415
- PMCID: PMC4067048
- DOI: 10.1109/TNS.2013.2278624
Bias atlases for segmentation-based PET attenuation correction using PET-CT and MR
Abstract
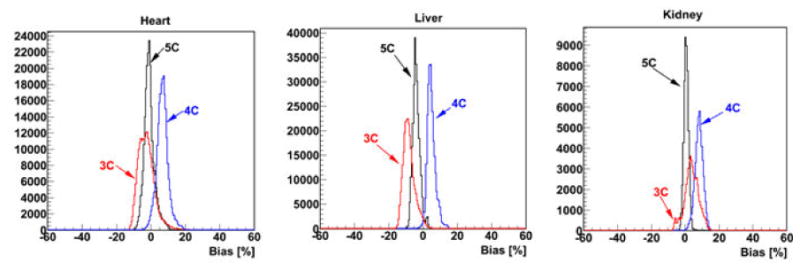
This study was to obtain voxel-wise PET accuracy and precision using tissue-segmentation for attenuation correction. We applied multiple thresholds to the CTs of 23 patients to classify tissues. For six of the 23 patients, MR images were also acquired. The MR fat/in-phase ratio images were used for fat segmentation. Segmented tissue classes were used to create attenuation maps, which were used for attenuation correction in PET reconstruction. PET bias images were then computed using the PET reconstructed with the original CT as the reference. We registered the CTs for all the patients and transformed the corresponding bias images accordingly. We then obtained the mean and standard deviation bias atlas using all the registered bias images. Our CT-based study shows that four-class segmentation (air, lungs, fat, other tissues), which is available on most PET-MR scanners, yields 15.1%, 4.1%, 6.6%, and 12.9% RMSE bias in lungs, fat, non-fat soft-tissues, and bones, respectively. An accurate fat identification is achievable using fat/in-phase MR images. Furthermore, we have found that three-class segmentation (air, lungs, other tissues) yields less than 5% standard deviation of bias within the heart, liver, and kidneys. This implies that three-class segmentation can be sufficient to achieve small variation of bias for imaging these three organs. Finally, we have found that inter- and intra-patient lung density variations contribute almost equally to the overall standard deviation of bias within the lungs.
Keywords: PET-MR; attenuation correction.
Figures


References
-
- Judenhofer MS, Wehrl HF, Newport DF, et al. Simultaneous PET-MRI: a new approach for functional and morphological imaging. Nat Med. 2008;14(no. 4):459–465. - PubMed
-
- Rota Kops E, Herzog H. Alternative methods for attenuation correction for PET images in MR-PET scanners. Conf Rec, IEEE Nucl Sci Symp. 2007:4327–4330.
-
- Rota Kops E, Qin P, Müller-Veggian M, Herzog H. MRI based attenuation correction for brain PET images. Springer Proc Phy. 2007;114:93–97.
-
- Beyer T, Weigert M, Quick HH, et al. MR-based attenuation correction for torso-PET/MR imaging: pitfalls in mapping MR to CT data. Eur J Nucl Med Mol Imaging. 2008;35(no. 6):1142–1146. - PubMed
-
- Hofmann M, Steinke F, Scheel V, et al. MRI-Based attenuation correction for PET/MRI: a novel approach combining pattern recognition and atlas registration. J Nucl Med. 2008;49(no. 11):1875–1883. - PubMed
Grants and funding
LinkOut - more resources
Full Text Sources
Other Literature Sources
Research Materials