

Radiologic evaluation of nonalcoholic fatty liver disease
- PMID: 24966609
- PMCID: PMC4064084
- DOI: 10.3748/wjg.v20.i23.7392
Radiologic evaluation of nonalcoholic fatty liver disease
Abstract
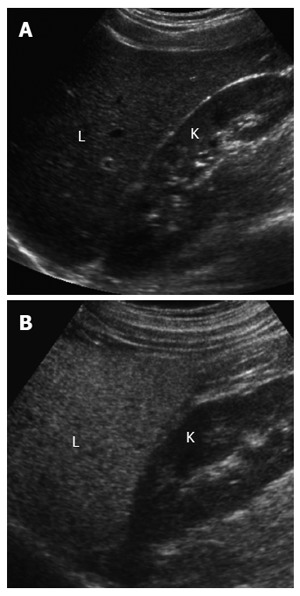
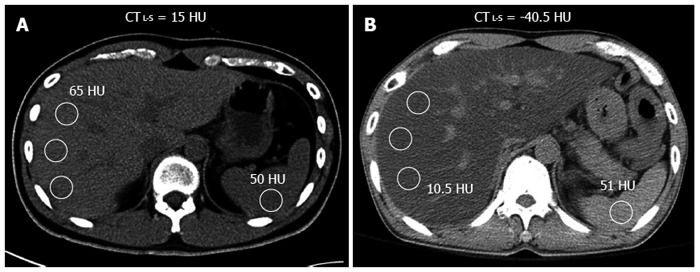
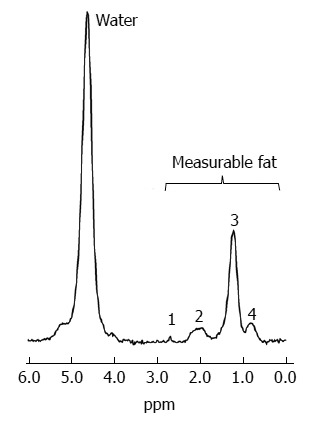
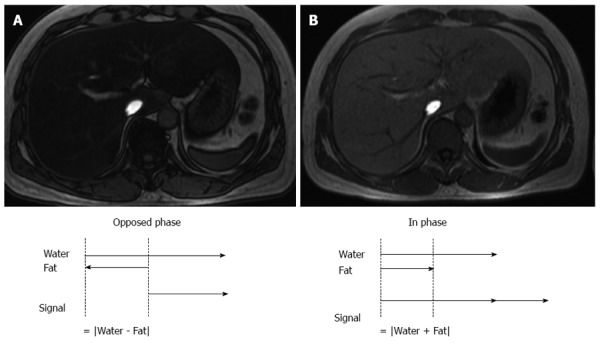
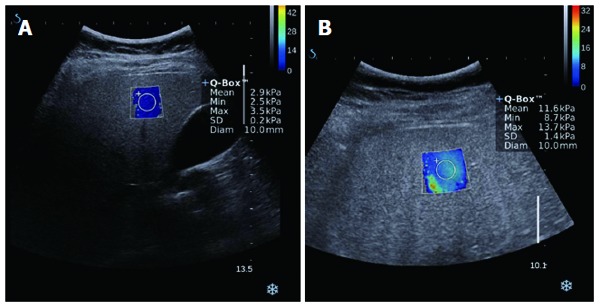
Nonalcoholic fatty liver disease (NAFLD) is a frequent cause of chronic liver diseases, ranging from simple steatosis to nonalcoholic steatohepatitis (NASH)-related liver cirrhosis. Although liver biopsy is still the gold standard for the diagnosis of NAFLD, especially for the diagnosis of NASH, imaging methods have been increasingly accepted as noninvasive alternatives to liver biopsy. Ultrasonography is a well-established and cost-effective imaging technique for the diagnosis of hepatic steatosis, especially for screening a large population at risk of NAFLD. Ultrasonography has a reasonable accuracy in detecting moderate-to-severe hepatic steatosis although it is less accurate for detecting mild hepatic steatosis, operator-dependent, and rather qualitative. Computed tomography is not appropriate for general population assessment of hepatic steatosis given its inaccuracy in detecting mild hepatic steatosis and potential radiation hazard. However, computed tomography may be effective in specific clinical situations, such as evaluation of donor candidates for hepatic transplantation. Magnetic resonance spectroscopy and magnetic resonance imaging are now regarded as the most accurate practical methods of measuring liver fat in clinical practice, especially for longitudinal follow-up of patients with NAFLD. Ultrasound elastography and magnetic resonance elastography are increasingly used to evaluate the degree of liver fibrosis in patients with NAFLD and to differentiate NASH from simple steatosis. This article will review current imaging methods used to evaluate hepatic steatosis, including the diagnostic accuracy, limitations, and practical applicability of each method. It will also briefly describe the potential role of elastography techniques in the evaluation of patients with NAFLD.
Keywords: Computed tomography; Elastography; Liver steatosis; Magnetic resonance imaging; Magnetic resonance spectroscopy; Nonalcoholic fatty liver disease; Nonalcoholic steatohepatitis; Ultrasonography.
Figures
References
-
- Szczepaniak LS, Nurenberg P, Leonard D, Browning JD, Reingold JS, Grundy S, Hobbs HH, Dobbins RL. Magnetic resonance spectroscopy to measure hepatic triglyceride content: prevalence of hepatic steatosis in the general population. Am J Physiol Endocrinol Metab. 2005;288:E462–E468. - PubMed
-
- Vernon G, Baranova A, Younossi ZM. Systematic review: the epidemiology and natural history of non-alcoholic fatty liver disease and non-alcoholic steatohepatitis in adults. Aliment Pharmacol Ther. 2011;34:274–285. - PubMed
-
- Farrell GC, Larter CZ. Nonalcoholic fatty liver disease: from steatosis to cirrhosis. Hepatology. 2006;43:S99–S112. - PubMed
-
- de Alwis NM, Day CP. Non-alcoholic fatty liver disease: the mist gradually clears. J Hepatol. 2008;48 Suppl 1:S104–S112. - PubMed
-
- Fierbinteanu-Braticevici C, Negreanu L, Tarantino G. Is fatty liver always benign and should not consequently be treated? J Physiol Pharmacol. 2013;64:3–9. - PubMed
Publication types
MeSH terms
Grants and funding
LinkOut - more resources
Full Text Sources
Other Literature Sources
Medical
