

Differential effects of dry eye disorders on metabolomic profile by 1H nuclear magnetic resonance spectroscopy
- PMID: 24967377
- PMCID: PMC4055474
- DOI: 10.1155/2014/542549
Differential effects of dry eye disorders on metabolomic profile by 1H nuclear magnetic resonance spectroscopy
Abstract
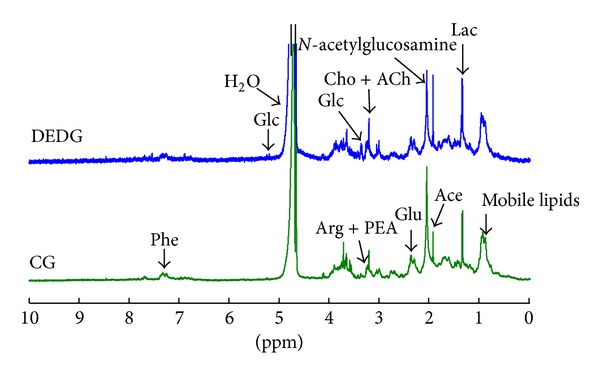
We used (1)H NMR spectroscopy to analyze the metabolomic profile of reflex tears from patients with dry eye disorders (DEDs). 90 subjects were divided into 2 groups: (1) patients with DEDs (DEDG; n = 55) and (2) healthy subjects (CG; n = 35). Additionally, the DEDG was subdivided into 2 subgroups based on DED severity: mild-to-moderate and moderate (n = 22 and n = 33, resp.). Personal interviews and systematized ophthalmologic examinations were carried out. Reflex tears (20-30 μL) were collected by gently rubbing in the inferior meniscus of both eyelids with a microglass pipette and stored at -80°C until analysis. NMR spectra were acquired using a standard one-dimensional pulse sequence with water suppression. Data were processed and transferred to MATLAB for further chemometric analysis. Main differences in tear composition between DEDG and CG were found in cholesterol, N-acetylglucosamine, glutamate, creatine, amino-n-butyrate, choline, acetylcholine, arginine, phosphoethanolamine, glucose, and phenylalanine levels. This metabolic fingerprint helped also to discriminate between the three additional subgroups of DEDG. Our results suggest that tear metabolic differences between DEDG and CG identified by NMR could be useful in understanding ocular surface pathogenesis and improving biotherapy.
Figures


Similar articles
-
A metabolomic approach to dry eye disorders. The role of oral supplements with antioxidants and omega 3 fatty acids.Mol Vis. 2015 May 11;21:555-67. eCollection 2015. Mol Vis. 2015. PMID: 25999682 Free PMC article.
-
Effects of a nutraceutical formulation based on the combination of antioxidants and ω-3 essential fatty acids in the expression of inflammation and immune response mediators in tears from patients with dry eye disorders.Clin Interv Aging. 2013;8:139-48. doi: 10.2147/CIA.S40640. Epub 2013 Feb 11. Clin Interv Aging. 2013. PMID: 23430672 Free PMC article. Clinical Trial.
-
Tear 1H Nuclear Magnetic Resonance-Based Metabolomics Application to the Molecular Diagnosis of Aqueous Tear Deficiency and Meibomian Gland Dysfunction.Ophthalmic Res. 2021;64(2):297-309. doi: 10.1159/000510211. Epub 2020 Jul 16. Ophthalmic Res. 2021. PMID: 32674101
-
The ocular surface and tear film and their dysfunction in dry eye disease.Surv Ophthalmol. 2001 Mar;45 Suppl 2:S203-10. doi: 10.1016/s0039-6257(00)00203-4. Surv Ophthalmol. 2001. PMID: 11587144 Review.
-
The correlation between the tear film lipid layer and dry eye disease.Surv Ophthalmol. 2007 Jul-Aug;52(4):369-74. doi: 10.1016/j.survophthal.2007.04.009. Surv Ophthalmol. 2007. PMID: 17574063 Review.
Cited by
-
LC-MS-Based Metabolic Fingerprinting of Aqueous Humor.J Anal Methods Chem. 2017;2017:6745932. doi: 10.1155/2017/6745932. Epub 2017 Jan 5. J Anal Methods Chem. 2017. PMID: 28154769 Free PMC article.
-
Ocular Surface and Tear Film Changes in Older Women Working with Computers.Biomed Res Int. 2015;2015:467039. doi: 10.1155/2015/467039. Epub 2015 Oct 18. Biomed Res Int. 2015. PMID: 26557673 Free PMC article.
-
Searching for the Antioxidant, Anti-Inflammatory, and Neuroprotective Potential of Natural Food and Nutritional Supplements for Ocular Health in the Mediterranean Population.Foods. 2021 May 28;10(6):1231. doi: 10.3390/foods10061231. Foods. 2021. PMID: 34071459 Free PMC article. Review.
-
A Metabolome-Wide Study of Dry Eye Disease Reveals Serum Androgens as Biomarkers.Ophthalmology. 2017 Apr;124(4):505-511. doi: 10.1016/j.ophtha.2016.12.011. Epub 2017 Jan 28. Ophthalmology. 2017. PMID: 28139245 Free PMC article.
-
Using NMR in saliva to identify possible biomarkers of glioblastoma and chronic periodontitis.PLoS One. 2018 Feb 6;13(2):e0188710. doi: 10.1371/journal.pone.0188710. eCollection 2018. PLoS One. 2018. PMID: 29408884 Free PMC article.
References
-
- Rolando M, Zierhut M. The ocular surface and tear film and their dysfunction in dry eye disease. Survey of Ophthalmology. 2001;45(2):S203–S210. - PubMed
-
- The definition and classification of dry eye disease: report of the definition and classification subcommittee of the international dry eye workshop (2007) Ocular Surface. 2007;5(2):75–92. - PubMed
-
- Murube J. Andrew de Roetth (1893—1981): dacryologist who introduced the term dry eye. Ocular Surface. 2004;2(4):225–227. - PubMed
-
- Foulks GN. Pharmacological management of dry eye in the elderly patient. Drugs and Aging. 2008;25(2):105–118. - PubMed
Publication types
MeSH terms
LinkOut - more resources
Full Text Sources
Other Literature Sources
Medical
