. 2014:2014:719853.
doi: 10.1155/2014/719853. Epub 2014 May 25.

Development of a murine model of early sepsis in diet-induced obesity

Affiliations

Development of a murine model of early sepsis in diet-induced obesity

Momina Khan et al. Biomed Res Int. 2014.

Abstract

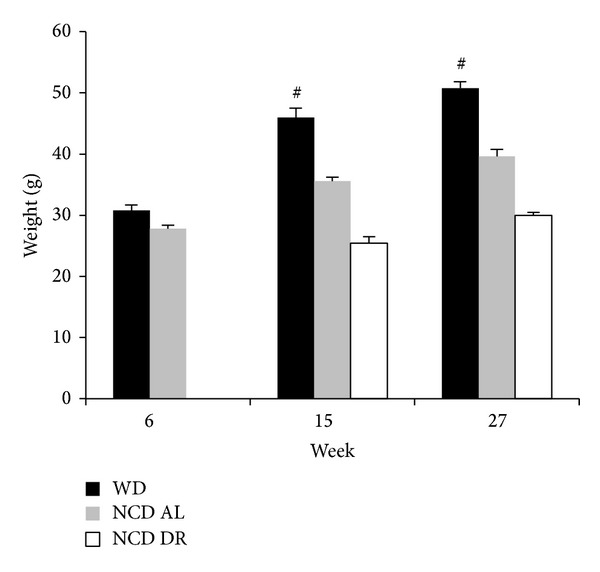
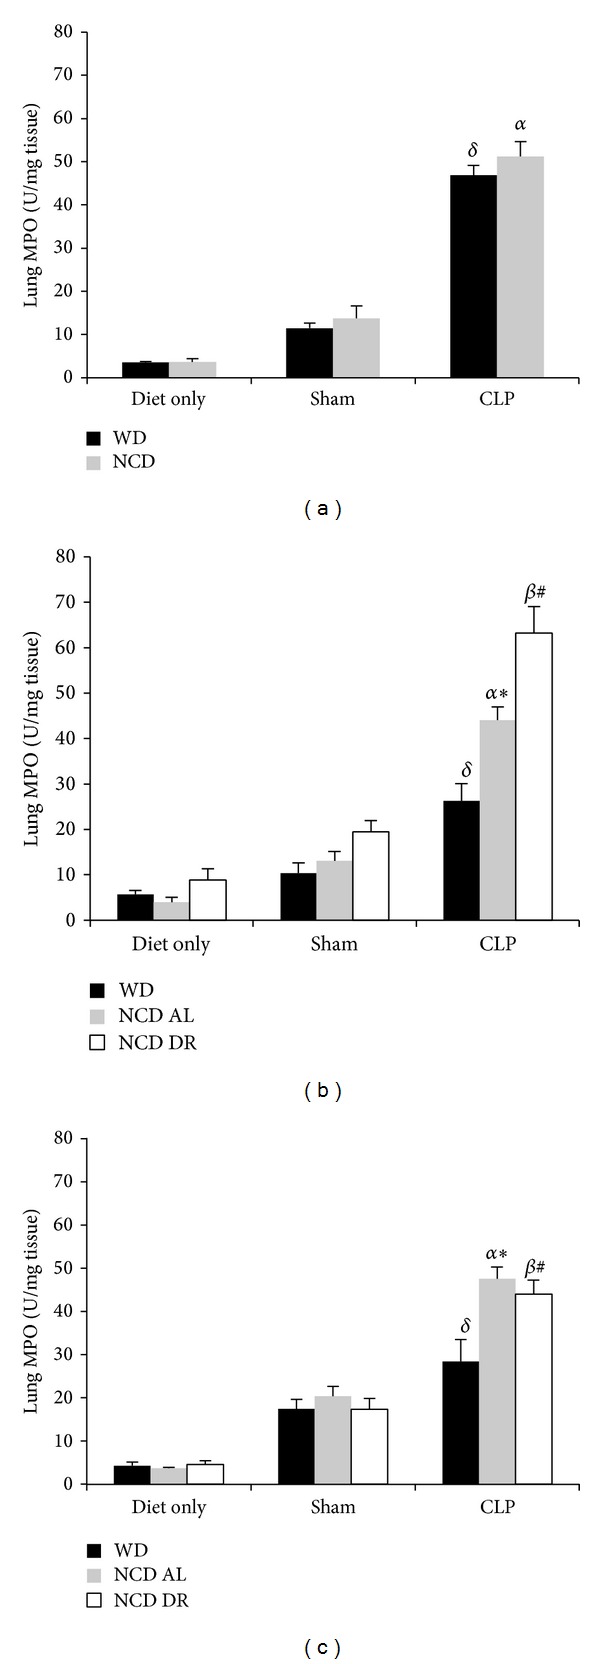
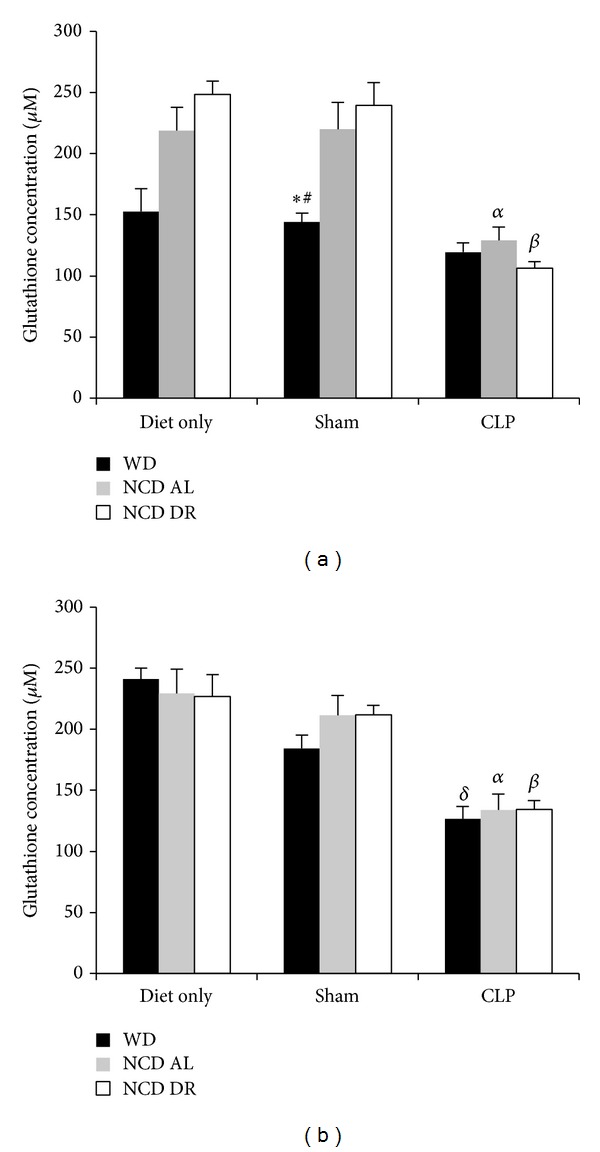
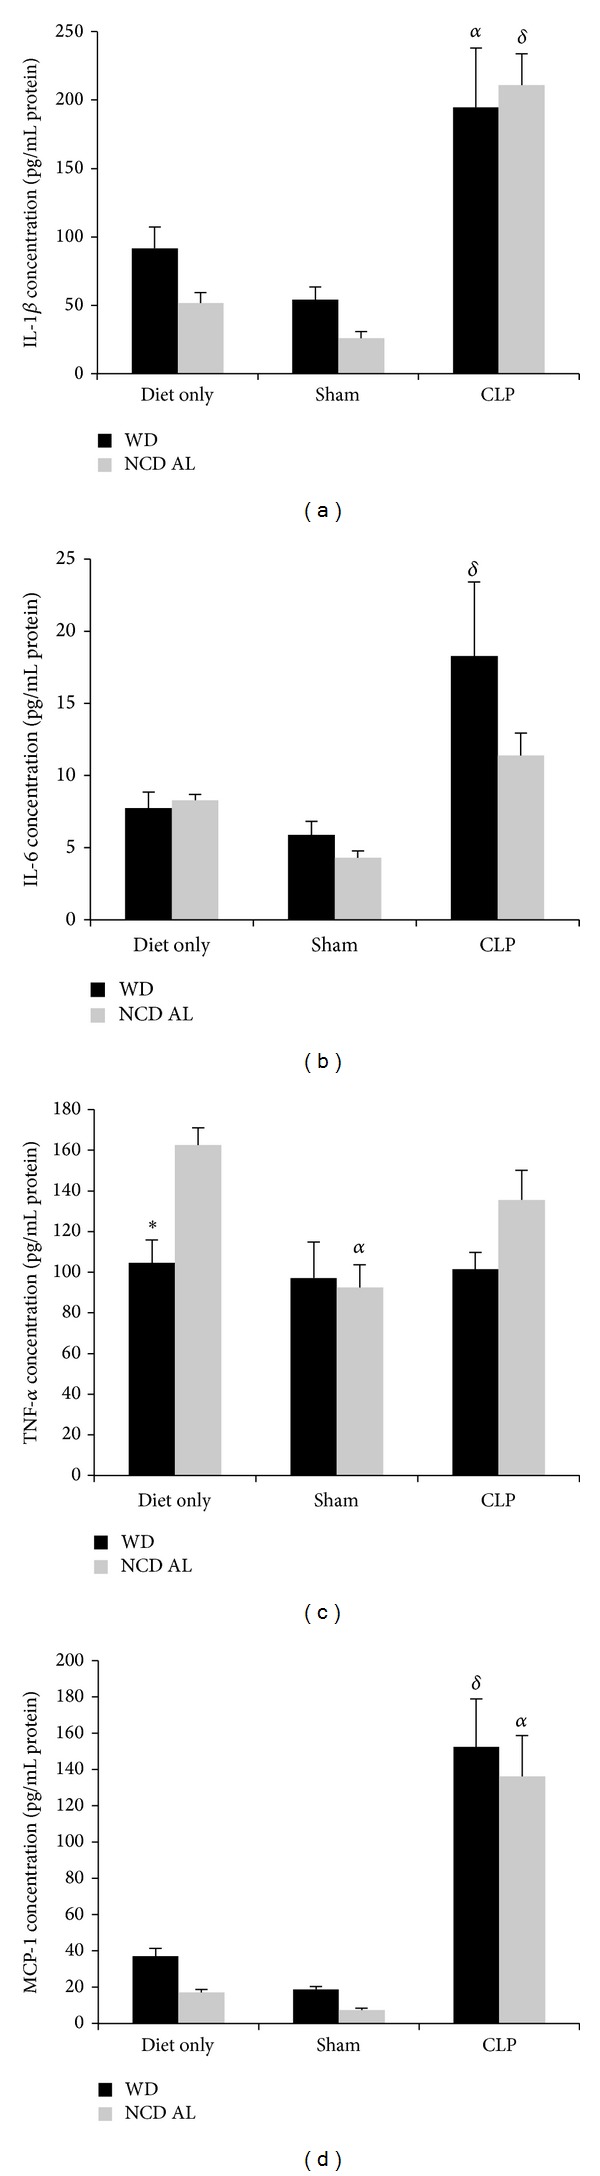
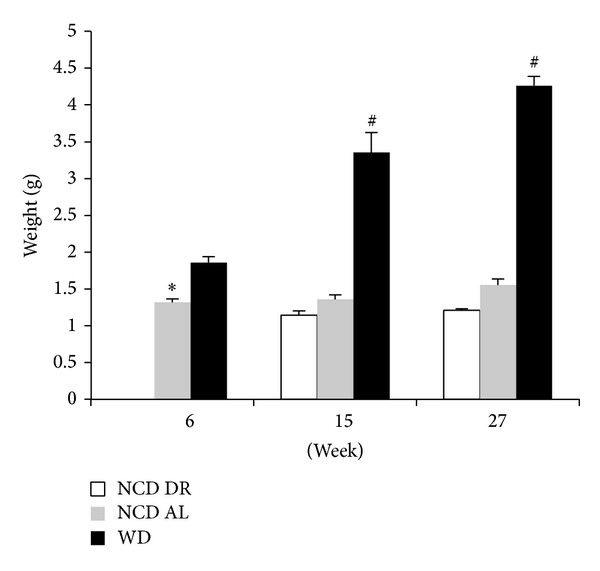
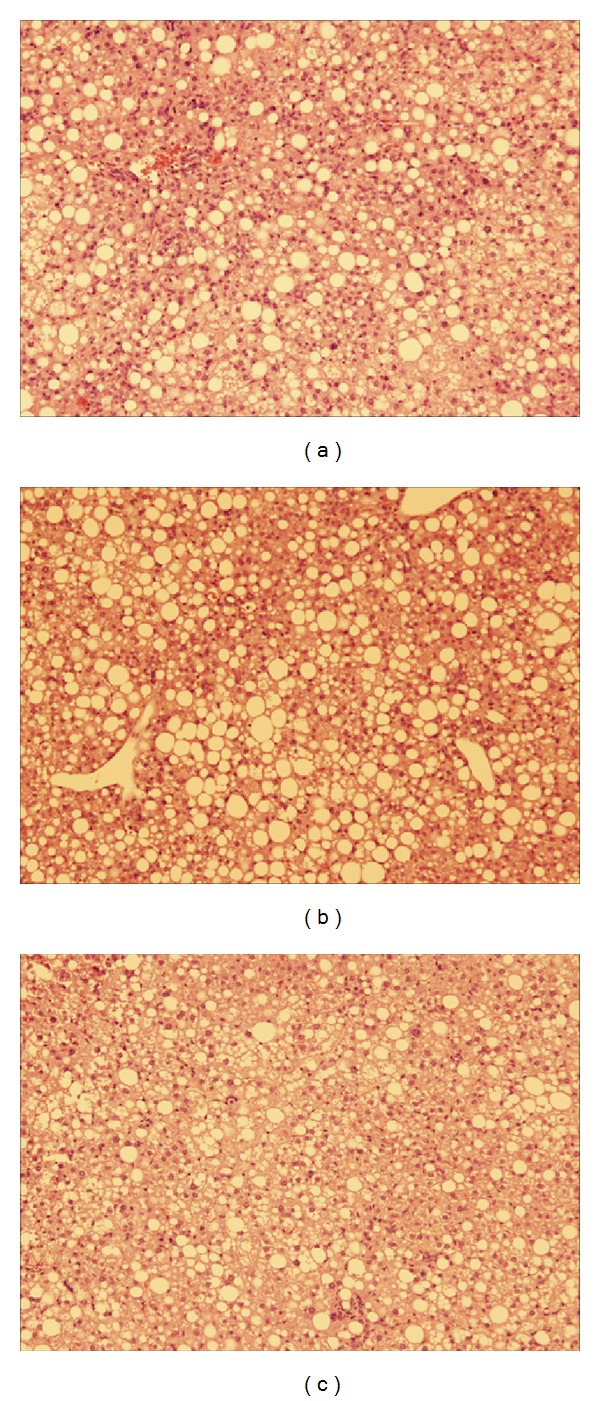
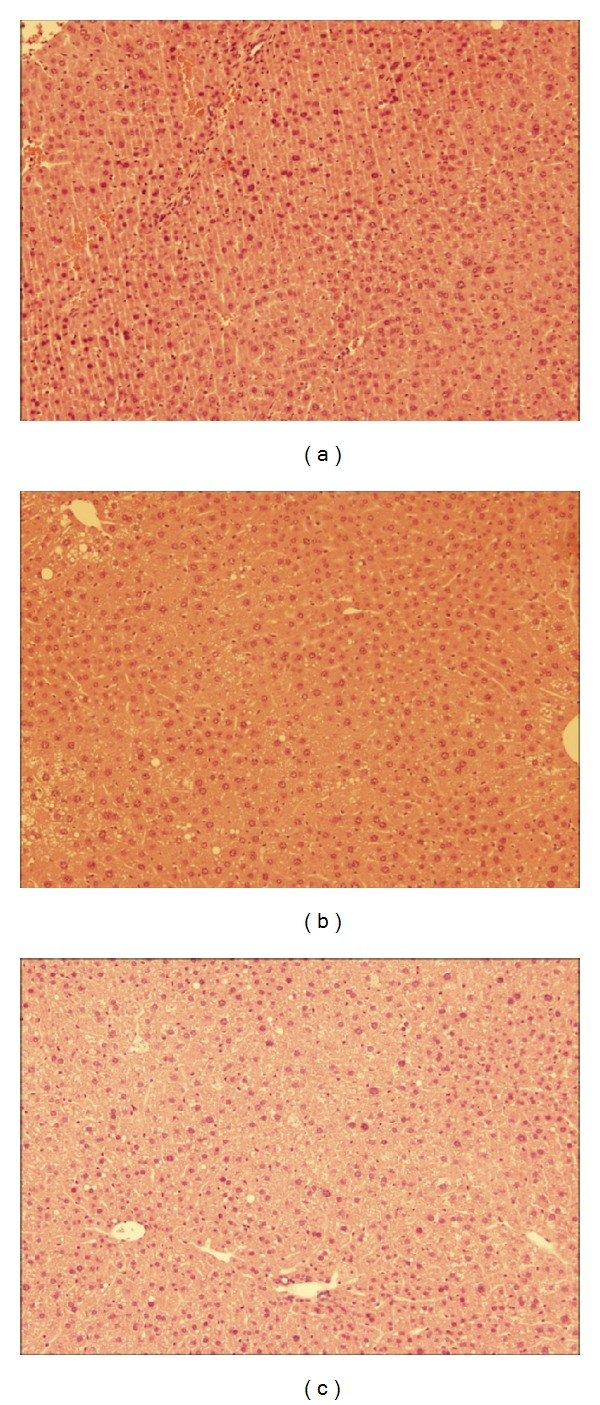
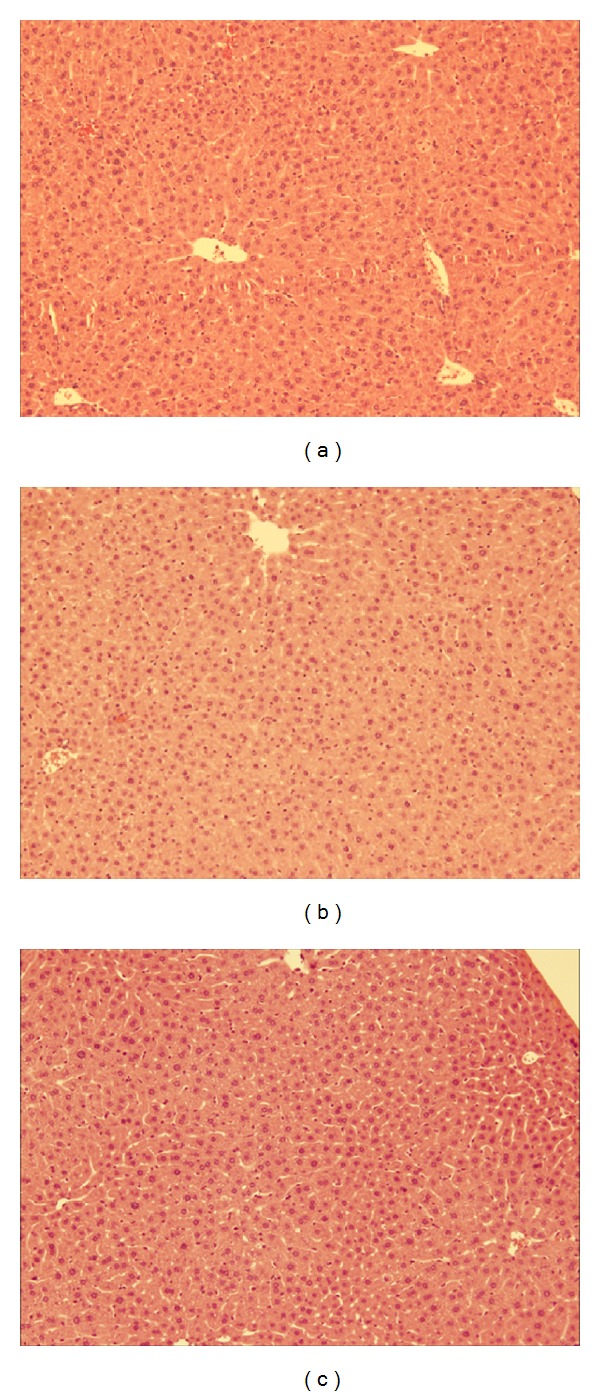
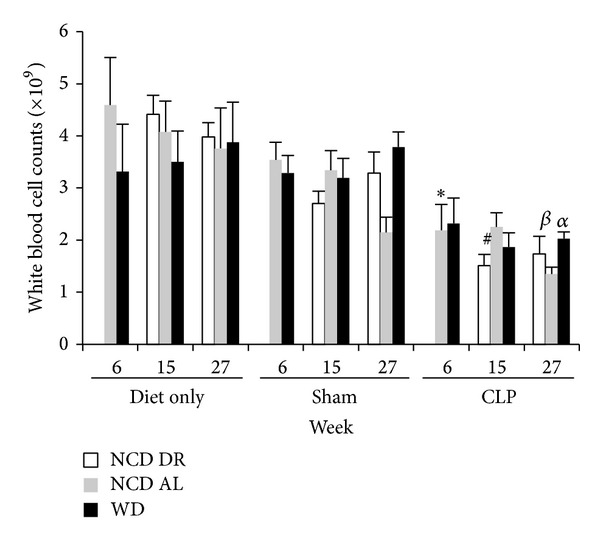
Sepsis, a global health issue, is the most common cause of mortality in the intensive care unit. The aim of this study was to develop a new model of sepsis that investigates the impact of prolonged western diet (WD) induced obesity on the response to early sepsis. Male C57BL/6 mice were fed either a high fat WD or normal chow diet (NCD) for 6, 15, or 27 weeks. Septic obese mice at 15 and 27 weeks had significantly lower levels of lung myeloperoxidase (26.3 ± 3.80 U/mg tissue) compared to age matched ad lib (44.1 ± 2.86 U/mg tissue) and diet restricted (63.2 ± 5.60 U/mg tissue) controls. Low levels of lung inflammation were not associated with changes in hepatic cytokines and oxidative stress levels. Obese mice had significantly (P < 0.0001) larger livers compared to controls. Histological examination of the livers demonstrated that WD fed mice had increased inflammation with pronounced fat infiltration, steatosis, and hepatocyte ballooning. Using this model of prolonged exposure to high fat diet we have data that agree with recent clinical observations suggesting obese individuals are protected from sepsis-induced lung injury. This model will allow us to investigate the links between damage to the hepatic microcirculation, immune response, and lung injury.


Figures

Figure 1
Figure 1
Average weight of each diet group at their respective end points. Data is presented as the mean (SE) (n = 5/group). # P < 0.0001 WD compared to NCD AL and NCD DR. P < 0.0001 NCD AL compared to NCD DR.
Figure 2
Figure 2
Glucose test at 15 weeks (a), glucose tolerance test at 27 weeks (b), and insulin tolerance test at 27 weeks (c). Results are expressed as changes in glucose levels after an I.P challenge of 2 g/kg glucose and 0.75 U/kg insulin. Data is presented as the mean (SE) (n = 5 for NCD AL and NCD DR and n = 15 for WD for glucose tolerance test and n = 5/group for insulin tolerance test). # P < 0.05 for WD compared to NCD AL, *P < 0.05 for WD compared to NCD DR, P < 0.05 NCD AL compared to NCD DR.
Figure 3
Figure 3
Lung MPO levels after 6 weeks (a), 15 weeks (b), and 27 weeks (c). Data is presented as the mean (SE) (n = 5/group). δ P < 0.05 for WD CLP compared to WD sham and diet only. α P < 0.001 for NCD AL CLP compared to NCD diet only and shams. β P < 0.0001 for NCD DR CLP compared to NCD DR sham and diet only. *P < 0.01 for WD CLP compared to NCD AL CLP. # P < 0.01 for WD CLP compared to NCD DR CLP.
Figure 4
Figure 4
Hepatic glutathione levels after 15 weeks (a) and 27 weeks (b). Data is presented as the mean (SE) (n = 4 for naïve and shams and n = 5 for CLP groups). δ P < 0.0001 for WD CLP versus WD diet only. α P < 0.05 for NCD AL CLP compared to NCD AL sham and diet only. β P < 0.01 for NCD DR CLP compared to NCD DR sham and diet only. # P < 0.05 for NCD AL sham compared to WD sham. *P < 0.05 for NCD DR sham compared to WD sham.
Figure 5
Figure 5
Hepatic chemokine and cytokine levels after 27 weeks: IL-1β (a), IL-6 (b), TNF-α (c), and MCP-1 (d). Data is presented as the mean (SE) (n = 6/group). δ P < 0.05 for WD CLP compared to WD sham and diet only. α P < 0.01 for NCD AL CLP compared to NCD AL diet only and shams. ∗   P < 0.05 for NCD AL diet only compared to WD diet only.
Figure 6
Figure 6
Liver weights of each diet group at their respective end points. Data is presented as the mean (SE) (n = 15/group). # P < 0.0001 for WD compared to NCD AL and NCD DR. *P < 0.01 for WD compared to NCD AL at 6 weeks.
Figure 7
Figure 7
Hepatic histology of obese mice at 27 weeks: (a) induced with sepsis, (b) sham group, and (c) diet only group. H&E staining of the liver ×100 magnification.
Figure 8
Figure 8
Hepatic histology of NCD AL control group at 27 weeks: (a) induced with sepsis, (b) sham group, and (c) diet only group. H&E staining of the liver ×100 magnification.
Figure 9
Figure 9
Hepatic histology of NCD DR control group at 27 weeks: (a) induced with sepsis, (b) sham group, and (c) diet only group. H&E staining of the liver ×100 magnification.
Figure 10
Figure 10
White blood cell counts for all diet groups at their respective end points. Data is presented as the mean (SE) (n = 5/group). *P < 0.05 for NCD AL diet only versus NCD AL CLP at 6 weeks. # P < 0.0001 for NCD DR diet only versus NCD DR CLP at 15 weeks. α P < 0.01 for NCD AL diet only versus NCD AL CLP at 27 weeks. β P < 0.05 for NCD DR diet only versus NCD DR CLP at 27 weeks.

References

    1. Fantuzzi G. Adipose tissue, adipokines, and inflammation. Journal of Allergy and Clinical Immunology. 2005;115(5):911–920. - PubMed
    1. Martyn JAJ, Kaneki M, Yasuhara S. Obesity-induced insulin resistance and hyperglycemia: etiologic factors and molecular mechanisms. Anesthesiology. 2008;109(1):137–148. - PMC - PubMed
    1. Hotamisligil GS, Shargill NS, Spiegelman BM. Adipose expression of tumor necrosis factor-α: direct role in obesity-linked insulin resistance. Science. 1993;259(5091):87–91. - PubMed
    1. Lundgren CH, Brown SL, Nordt TK, Sobel BE, Fujii S. Elaboration of type-1 plasminogen activator inhibitor from adipocytes : a potential pathogenetic link between obesity and cardiovascular disease. Circulation. 1996;93:106–110. - PubMed
    1. Mohamed-Ali V, Goodrick S, Rawesh A, et al. Subcutaneous adipose tissue releases interleukin-6, but not tumor necrosis factor-α, in vivo. Journal of Clinical Endocrinology & Metabolism. 1997;82:4196–4200. - PubMed

Publication types

MeSH terms