. 2014 Jun 26;10(6):e1004409.
doi: 10.1371/journal.pgen.1004409. eCollection 2014 Jun.

Aberrant autolysosomal regulation is linked to the induction of embryonic senescence: differential roles of Beclin 1 and p53 in vertebrate Spns1 deficiency

Affiliations

Aberrant autolysosomal regulation is linked to the induction of embryonic senescence: differential roles of Beclin 1 and p53 in vertebrate Spns1 deficiency

Tomoyuki Sasaki et al. PLoS Genet. .

Abstract

Spinster (Spin) in Drosophila or Spinster homolog 1 (Spns1) in vertebrates is a putative lysosomal H+-carbohydrate transporter, which functions at a late stage of autophagy. The Spin/Spns1 defect induces aberrant autolysosome formation that leads to embryonic senescence and accelerated aging symptoms, but little is known about the mechanisms leading to the pathogenesis in vivo. Beclin 1 and p53 are two pivotal tumor suppressors that are critically involved in the autophagic process and its regulation. Using zebrafish as a genetic model, we show that Beclin 1 suppression ameliorates Spns1 loss-mediated senescence as well as autophagic impairment, whereas unexpectedly p53 deficit exacerbates both of these characteristics. We demonstrate that 'basal p53' activity plays a certain protective role(s) against the Spns1 defect-induced senescence via suppressing autophagy, lysosomal biogenesis, and subsequent autolysosomal formation and maturation, and that p53 loss can counteract the effect of Beclin 1 suppression to rescue the Spns1 defect. By contrast, in response to DNA damage, 'activated p53' showed an apparent enhancement of the Spns1-deficient phenotype, by inducing both autophagy and apoptosis. Moreover, we found that a chemical and genetic blockage of lysosomal acidification and biogenesis mediated by the vacuolar-type H+-ATPase, as well as of subsequent autophagosome-lysosome fusion, prevents the appearance of the hallmarks caused by the Spns1 deficiency, irrespective of the basal p53 state. Thus, these results provide evidence that Spns1 operates during autophagy and senescence differentially with Beclin 1 and p53.


Conflict of interest statement

The authors have declared that no competing interests exist.

Figures

Figure 1
Figure 1. Aberrant autophagosome and autolysosome formation in spns1-mutant zebrafish.
(A) Yolk opaqueness and LC3 puncta formation in spns1-mutant zebrafish embryos. For EGFP-LC3 transgenic spns1-mutant [Tg(CMV:EGFP-LC3);spns1hi891/hi891] fish siblings, bright-field and fluorescence images of wild-type (wt) control (upper) and spns1 mutant (spns1−/−) (lower) embryos at 84 hpf are shown. The black arrow indicates the yolk-opaqueness phenotype in the spns1 mutant. The gross expression of EGFP-LC3 at head and trunk in the spns1-mutant animal is relatively stronger than in the wt animal. Occasionally, however, a high intensity signal can be observed at the liver region in the mutant (as seen in D). Scale bar, 250 µm. (B) EGFP-LC3 punctate compartments in the liver cells of the spns1 mutant. Through high magnification (×600) confocal microscopy, intracellular EGFP-LC3 puncta were visualized in live animals at 84 hpf. Nuclei were counterstained with Hoechest 33342 (blue), and peri-nuclear EGFP-LC3 puncta were evident in the spns1 mutant, but not in wt animals. Scale bar, 10 µm. (C) Immunoblotting to detect the conversion of LC3-I to LC-II. Using an anti-LC3 antibody, both endogenous LC3 and transgenic (exogenous) EGFP-LC3 expression was detected and an increase of LC3-II conversion/accumulation was seen in the spns1 mutant compared with wt fish at 84 hpf. (DF) Identification of autophagosome and autolysosome/lysosome formation in the spns1 mutant. (D, E) LysoTracker (DND-99; red) staining of EGFP-LC3 transgenic spns1-mutant [Tg(CMV:EGFP-LC3); spns1hi891/hi891] embryos was performed at 84 hpf. At the whole animal levels (D), the EGFP-LC3 signal is relatively higher throughout in the spns1 mutant than in wild type, and a particularly strong signal can be seen in the liver, as shown in (A). In the head and trunk portions of the animals (D), a distinctive increase in the intensity of LysoTracker can be observed in the spns1 mutant. At the intracellular level (E), several small LC3 spots and largely diffuse green signal in the cells and cytosolic LysoTracker staining is seen. A number of enlarged LC3- and LysoTracker-positive yellow punctate structures can be seen in the spns1 mutant by confocal microscopy at a higher magnification (inset; enlarged from dotted square area). (F) EGFP-LC3 and mCherry-LC3 double-transgenic [Tg(EGFP-LC3:mCherry-LC3)] zebrafish were used to monitor autolysosome formation in spns1 MO-injected embryos at 84 hpf. A number of enlarged yellow LC3 puncta were detected in the spns1 morphant, while only small yellow LC3 spots can be seen in control-injected embryos. Nuclei were counterstained with 4′, 6-diamidino-2-phenylindole, dihydrochloride (DAPI). Scale bar, 250 µm in (D). Scale bar, 10 µm in (E, F). Quantification of data presented in D (n = 12), E (n = 6), and F (n = 6) is shown in the right graph; the number (n) of animals is for each genotype. Three independent areas (periderm or basal epidermal cells above the eye) were selected from individual animals. (G) Transgenic expression of mCherry-Lamp1 in wt [Tg(CMV:EGFP-LC3)] and spns1-mutant [Tg(CMV:EGFP-LC3);spns1hi891/hi891] animals 84 hpf. Scale bar, 10 µm. (H) Transgenic expression of EGFP-Vector (vector), EGFP-wild-type Spns1 (spns1 WT), or EGFP-mutant Spns1 (spns1 E153K) in [Tg(CMV:mCherry-LC3);spns1hi891/hi891] animals at 84 hpf. Scale bar, 10 µm. Quantification of data presented in H is shown for ratio of yolk opaqueness phenotype (n = 48), mCherry intensity (red) (n = 6), and merge intensity of EGFP and mCherry (yellow) (n = 6) in the right graphs; the number (n) of animals is for each genotype. Three independent areas (periderm or basal epidermal cells above the eye) were selected from individual animals. Error bars represent the mean ± standard deviation (S.D.), *p<0.005; ns, not significant.
Figure 2
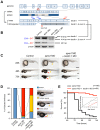
Figure 2. Knockdown of beclin 1 suppresses the Spns1 deficiency in zebrafish.
(A) Schematic representation of the zebrafish beclin 1 (zbeclin 1) gene, its mRNA and protein products. A splice-blocking beclin 1 MO was designed to overlap the intron-exon boundary at the 5′-splice junction of exon 4 in the zebrafish beclin 1 gene. To detect aberrantly spliced RNA products, two forward primers were designed for exon 3 (EX3 primer) and exon 4 (EX4 primer), and one reverse primer was designed for exon 7 (EX7 primer) within the beclin 1 gene. The zebrafish beclin 1 gene has a total of 11 exons having three unique domains [BH3 domain, coiled-coil (CCD) domain, and evolutionarily conserved (ECD) domain], and the beclin 1 MO was anticipated to disrupt the BH3 domain encoded by exon 4 and exon 5. (B) Splicing detection of zbeclin 1 mRNA by RT-PCR. Amplified PCR fragments show the intact sizes of the two amplicons for EX3-EX7 and EX4-EX7 following control (water) injection or only spns1 MO injection. Either beclin 1 MO (12 ng/embryo) injection or coinjection of spns1 MO (4 ng/embryo) and beclin 1 MO (12 ng/embryo) generated a skipping of exon 4 (beclin 1Δexon4). This was detected by the presence of an altered EX3-EX7 amplicon and undetectable EX4-EX7 product. The deletion of exon 4 was confirmed by sequencing. Injected embryos were harvested for total RNA isolation at 54 hpf. (C and D) Rescue of the spns1 morphant by beclin 1 knockdown. (C) The yolk opaqueness phenotype appearance in control-injected (water), spns1 MO-injected, and spns1 and beclin 1 MOs-coinjected embryos was followed through 72 hpf. At 24 hpf, opaqueness commenced from the yolk extension region, which had almost disappeared or was severely damaged (more than 95% of spns1 MO-injected animals) with an extension of opacity to the entire yolk at 48 hpf. By 72 hpf, yolk opaqueness became highly dense throughout most of the spns1 MO-injected embryos, which usually died within another 24 h. Scale bar, 250 µm. (D) Clarification of the yolk opaqueness phenotype in spns1 morphants at 72 hpf. As described in (C), more than 95% of the spns1 MO-injected embryos showed a ‘mostly opaque’ yolk at 48 hpf, and such embryos subsequently died. Animals showing a ‘partially opaque’ yolk could sometimes be recovered and subsequently survived 96 h and beyond. beclin 1 MO coinjection dramatically increased (more than 10 times) the animal numbers with the partial yolk opaque phenotype. (E) Survival curve for spns1 morphant and spns1;beclin 1-double morphant larvae (log rank test: χ2 = 162.5 on one degree of freedom; p<0.0001).
Figure 3
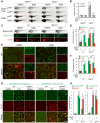
Figure 3. Knockdown of beclin 1 suppresses abnormal autolysosomal puncta formation and embryonic senescence caused by Spns1 deficiency in zebrafish.
(A) Effect of beclin 1 knockdown on EGFP-LC3 puncta formation in spns1-depleted zebrafish embryos. Injection of control (water) injection, spns1 MO (4 ng/embryo) or coinjection of spns1 MO (4 ng/embryo) and beclin 1 MO (12 ng/embryo) into Tg(CMV:EGFP-LC3) fish was performed to assess whether the beclin 1 knockdown reduces or eliminates aggregated LC3 puncta induced by Spns1 depletion at 84 hpf. Scale bar, 10 µm. Quantification of data presented in panel A (n = 12) is shown in the right graph; the number (n) of animals is for each morphant or water-injected control. Three independent areas (periderm or basal epidermal cells above the eye) were selected from individual animals. (B) Effect of beclin 1 knockdown on EGFP-GABARAP as well as mCherry-LC3 puncta formation in spns1-depleted zebrafish embryos. Injection of control (water), spns1 MO or coinjection of spns1 MO and beclin 1 MO into Tg(CMV:EGFP-GABARAP;mCherry-LC3) fish was performed to evaluate whether the beclin 1 knockdown reduces or eliminates the aggregation of GFP-GABARAP puncta in comparison with those of LC3 caused by the Spns1 depletion at 84 hpf. Scale bar, 10 µm. Quantification of data presented in the top row (green; EGFP) (n = 9), middle row (red; mCherry) (n = 12), and bottom row (yellow; merge of EGFP and mCherry) (n = 9) in panel B is shown in the right graphs; the number (n) of animals is for each morphant or water-injected control. Three independent areas (periderm or basal epidermal cells above the eye) were selected from individual animals. (C) Effect of beclin 1 knockdown on embryonic senescence in spns1 morphant. By using the same injection samples [injection of control (water), spns1 MO or coinjection of spns1 MO and beclin 1 MO into Tg(CMV:EGFP-GABARAP;mCherry-LC3) fish], SA-β-gal staining was performed to assess whether the beclin 1 knockdown has any impact on the embryonic senescence caused by Spns1 depletion at 84 hpf. Representative images of individual fish by bright field (BF, live samples) and SA-β-gal (SABG) staining are shown in the upper and middle panels, respectively. Scale bar, 250 µm. Lower panels are larger magnification images of corresponding SA-β-gal samples shown in the middle panels and the fluorescence images of nuclei counterstained with DAPI. Scale bar, 10 µm. Quantification of data presented in the middle row (SABG) in panel C (n = 12) is shown in the right graph; the number (n) of animals is for each morphant or water-injected control. Error bars represent the mean ± S.D., *p<0.005.
Figure 4
Figure 4. p53 depletion does not suppress but rather exacerbates Spns1 deficiency.
(A) Effect of p53 knockdown on embryonic senescence and autolysosome formation in spns1 morphants. The impact of transient p53 knockdown on SA-β-gal (SABG) induction, as well as on EGFP-LC3 and LysoTracker (LysoT) puncta, was determined in spns1 morphants at 84 hpf, followed by the MO (4 ng/embryo) injections. Inverse-sequence p53 MO (inv. p53 MO) was used as a negative control for the original p53 MO. Scale bar, 250 µm in the SABG images. Scale bar, 10 µm in the fluorescence images. (B) Quantification of the SA-β-gal intensities in MO-injected animals, as shown for the SABG images in (A). Quantification of data presented in the top row (SABG) in B (n = 12) is shown; the number (n) of animals is for each morphant. (C) Quantification of EGFP-LC3 and LysoTracker puncta in MO-injected animals shown in (A) (n = 9); the number (n) of animals is for each morphant. Three independent areas (periderm or basal epidermal cells above the eye) were selected from individual animals. (D) Effect of a p53 mutation on embryonic SA-β-gal activity in the spns1 mutant. The heritable impact of p53 and Spns1 on SA-β-gal induction was tested in each single gene mutant [spns1hi891/hi891 (spns1−/−) or tp53zdf1/zdf1 (p53m/m)] and double mutant spns1hi891/hi891;tp53zdf1/zdf1 (spns1−/−;p53m/m) compared with wild-type (wt) animals at 84 hpf. Scale bar, 250 µm. (E) Quantification of the SA-β-gal intensities in wt, tp53zdf1/zdf1, spns1hi891/hi891 and spns1hi891/hi891;tp53zdf1/zdf1 animals, shown in (D). Quantification of data presented in panel D (n = 12) is shown; the number (n) of animals is for each genotype. (F) Quantitative RT-PCR analyses of senescence marker and/or mediator expression as well as p53-downstream target genes in wt, tp53zdf1/zdf1, spns1hi891/hi891 and spns1hi891/hi891;tp53zdf1/zdf1 at 72 hpf. Data are mean ±SD [n = 4 samples (3 embryos/sample) per genotype]. Asterisks denote significant changes compared to wt values. *p<0.05. (G) LC3 conversions in p53 and spns1-mutant animals. Protein detection for the conversion/accumulation of LC3-I to LC-II was performed in the described mutant background animals in comparison with wt fish at 84 hpf. Western blot analysis using anti-LC3 antibody shows endogenous LC3 protein levels, which can confirm an increase of the total amount of LC3 in the p53 mutant compared with wt fish. Increased LC3-II conversion/accumulation was detected in p53 and spns1 double-mutants as well as in spns1 single-mutant fish. (H) The blotting band intensities of LC3-I, LC3-II and β-actin were quantified (n = 6), and the relative ratios between LC3-II/actin and LC3-I/actin are shown in the bar graph; the number (n) of animals is for each genotype. (I) wt, tp53zdf1/zdf1, spns1hi891/hi891 and spns1hi891/hi891;tp53zdf1/zdf1 embryos injected with beclin 1 MO or control MO (12 ng/embryo) were assayed for SA-β-gal at 84 hpf. beclin 1 MO-mediated suppression of SA-β-gal in spns1hi891/hi891 animals was attenuated in the p53 mutant background. Scale bar, 250 µm. (J) Quantification of the SA-β-gal intensities shown in (I). Quantification of data presented in H (n = 12) is shown; the number (n) of animals is for each genotype with MO. Error bars represent the mean ± S.D., *p<0.005; ns, not significant.
Figure 5
Figure 5. Acidity-dependent lysosomal biogenesis is rate limiting in spns1-mutant zebrafish.
(A) Effect of bafilomycin A1 (BafA) on the yolk opaque phenotype (BF; bright field) and embryonic senescence (SABG; SA-β-gal) in the spns1 mutant in the presence or absence of p53 at 48 hpf. Normal wild-type (spns1+/+;p53+/+), tp53zdf1/zdf1 (p53m/m), spns1hi891/hi891 (spns1−/−) and spns1hi891/hi891;tp53zdf1/zdf1 (spns1−/−;p53m/m) embryos at 36 hpf were incubated with BafA (200 nM) for 12 h, and stained with LysoTracker at 48 hpf, followed by SA-β-gal staining at 60 hpf. Scale bar, 250 µm. (B) Quantification of the SA-β-gal intensities shown in (A). Quantification of data presented in panel A (n = 12) is shown; the number (n) of animals is for each genotype with DMSO or BafA. (C) Gross morphology, EGFP-LC3 and LysoTracker intensities in wild-type (wt) and spns1-mutant animals treated with BafA shown at 48 hpf (12 h treatment starting at 36 hpf). Scale bar, 250 µm. (D) Quantification of the EGFP-LC3 and LysoTracker fluorescence intensities shown in (C). Quantification of data presented in the middle and bottom rows (green; EGFP, red; mCherry) in panel C (n = 12) is shown; the number (n) of animals is for each genotype with DMSO or BafA. (E) Intracellular autolysosome formation and lysosomal biogenesis in the BafA-treated spns1 mutant. The samples analyzed in (C) were observed by using confocal microscopy at high magnification (×600). Scale bar, 10 µm. (F) Quantification of the EGFP-LC3 and LysoTracker fluorescence intensities shown in (E). Quantification of data presented for EGFP (green) and mCherry (red) signals in panel E (n = 6) is shown; the number (n) of animals is for each genotype with DMSO or BafA. Three independent areas (periderm or basal epidermal cells above the eye) were selected from individual animals. (G) Insufficient intracellular acidity constituent in the spns1 mutants. Using two different acidic-sensitive probes, LysoSensor 189 and neutral-sensitive LysoSensor 153 (green), in combination with LysoTracker (red), wt and spns1-mutant animals showed detectable signals when stained at 72 hpf. In spns1-mutant animals, autolysosomal and/or lysosomal compartments were more prominently detectable by LysoSensor 153 than by LysoSensor 189, at the cellular level with enhanced signal intensity of these enlarged compartments. In stark contrast, the cellular compartments in wt fish treated with pepstatin A and E-64-d (P/E) (12 h treatment from 60 hpf through 72 hpf) were more prominently detectable by LysoSensor 189 than by LysoSensor 153 under the identical LysoTracker staining conditions. Of note, these autolysosomal and lysosomal compartments in spns1 mutants, as well as in wt animals treated with pepstatin A and E-64-d, may still retain some weak (higher pH) and strong (lower pH) acidity, respectively, as short-term BafA treatment (for 1 h between 71 and 72 hpf) can abolish the acidic compartments stained by both LysoSensor and LysoTracker (Figure S17C and D). Scale bar, 10 µm. (H) Quantification of the LysoSensor (189 and 153) and LysoTracker fluorescence intensities shown in (G). Quantification of data presented for LysoSensor (green) and LysoTracker (red) signals in panel G (n = 6) is shown; the number (n) of animals is for each genotype with DMSO or pepstatin A and E-64-d (P/E). Three independent areas (periderm or basal epidermal cells above the eye) were selected from individual animals. Error bars represent the mean ± S.D., *p<0.005; ns, not significant.
Figure 6
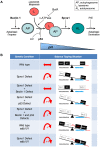
Figure 6. Schematic model for Spns1 function under the control of the network module of autophagy-senescence signaling cascades differentially regulated through Beclin 1 and p53.
(A) Beclin 1 is essential for the early stage of autophagy and its depletion suppresses the Spns1 defect by blocking the ‘autophagic process’ and its progression. BafA can decelerate ‘lysosomal biogenesis’, which subsequently presumably prevents autophagosome-lysosome fusion, through the inhibition of the v-ATPase, and contributes to amelioration of the Spns1 defect at least temporarily. Basal p53 activity may suppress the intersection between the ‘autophagic progress’ and ‘lysosomal biogenesis’ where the Beclin 1 depletion was not sufficient, but the v-ATPase inhibition was still effective enough, to compete with the p53 loss to suppress the Spns1 deficiency. By switching the basal p53 state to the activated version with UV irradiation, p53 can promote autophagy. Spns1 might be a gatekeeper of autolysosomal maturation followed by lysosomal biogenesis. It remains unknown how p53 can mechanistically be linked to the lysosomal ‘efflux’ function of Spns1 as well as the lysosomal ‘influx’ function of v-ATPase, and further investigations will be required to explore this connection. (B) Roles of Spns1, p53 and Beclin 1 in senescence equilibrium. Loss of Spns1 leads to an imbalance in homeostasis and increased senescence. This effect can be ameliorated by concurrent knockdown of Beclin 1. p53 has a comparatively less dramatic impact on Spns1-loss-induced embryonic senescence. When in the “basal” state, p53 helps retain equilibrium. When p53 is “activated” by UV irradiation, a modest increase in senescence is observed. The higher level of senescence is seen during loss of Spns1 in the absence of basal p53 or in the presence of activated p53. During loss/knockdown of all three genes (spns1, p53 and beclin 1), a state of moderate senescence is observed. An increase in senescence is accompanied by a p53-dependent decrease in cellular proliferation.

Similar articles

Cited by

  • Ultraspecific live imaging of the dynamics of zebrafish neutrophil granules by a histopermeable fluorogenic benzochalcone probe.
    Colucci-Guyon E, Batista AS, Oliveira SDS, Blaud M, Bellettini IC, Marteyn BS, Leblanc K, Herbomel P, Duval R. Colucci-Guyon E, et al. Chem Sci. 2019 Feb 14;10(12):3654-3670. doi: 10.1039/c8sc05593a. eCollection 2019 Mar 28. Chem Sci. 2019. PMID: 30996961 Free PMC article.
  • Molecular characterization of Beclin 1 in rare minnow (Gobiocypris rarus) and its expression after waterborne cadmium exposure.
    Liu XH, Wang ZJ, Chen DM, Chen MF, Jin XX, Huang J, Zhang YG. Liu XH, et al. Fish Physiol Biochem. 2016 Feb;42(1):111-23. doi: 10.1007/s10695-015-0122-1. Epub 2015 Sep 7. Fish Physiol Biochem. 2016. PMID: 26347097
  • Carbofuran accelerates the cellular senescence and declines the life span of spns1 mutant zebrafish.
    Khan A, Fahad TM, Akther T, Zaman T, Hasan MF, Islam Khan MR, Islam MS, Kishi S. Khan A, et al. J Cell Mol Med. 2021 Jan;25(2):1048-1059. doi: 10.1111/jcmm.16171. Epub 2020 Dec 4. J Cell Mol Med. 2021. PMID: 33277797 Free PMC article.
  • Guidelines for the use and interpretation of assays for monitoring autophagy (3rd edition).
    Klionsky DJ, Abdelmohsen K, Abe A, Abedin MJ, Abeliovich H, Acevedo Arozena A, Adachi H, Adams CM, Adams PD, Adeli K, Adhihetty PJ, Adler SG, Agam G, Agarwal R, Aghi MK, Agnello M, Agostinis P, Aguilar PV, Aguirre-Ghiso J, Airoldi EM, Ait-Si-Ali S, Akematsu T, Akporiaye ET, Al-Rubeai M, Albaiceta GM, Albanese C, Albani D, Albert ML, Aldudo J, Algül H, Alirezaei M, Alloza I, Almasan A, Almonte-Beceril M, Alnemri ES, Alonso C, Altan-Bonnet N, Altieri DC, Alvarez S, Alvarez-Erviti L, Alves S, Amadoro G, Amano A, Amantini C, Ambrosio S, Amelio I, Amer AO, Amessou M, Amon A, An Z, Anania FA, Andersen SU, Andley UP, Andreadi CK, Andrieu-Abadie N, Anel A, Ann DK, Anoopkumar-Dukie S, Antonioli M, Aoki H, Apostolova N, Aquila S, Aquilano K, Araki K, Arama E, Aranda A, Araya J, Arcaro A, Arias E, Arimoto H, Ariosa AR, Armstrong JL, Arnould T, Arsov I, Asanuma K, Askanas V, Asselin E, Atarashi R, Atherton SS, Atkin JD, Attardi LD, Auberger P, Auburger G, Aurelian L, Autelli R, Avagliano L, Avantaggiati ML, Avrahami L, Awale S, Azad N, Bachetti T, Backer JM, Bae DH, Bae JS, Bae ON, Bae SH, Baehrecke EH, Baek SH, Baghdiguian S, Bagniewska-Zadworna A, Bai H, Bai J, Bai XY, Bailly Y, Balaji KN, … See abstract for full author list ➔ Klionsky DJ, et al. Autophagy. 2016;12(1):1-222. doi: 10.1080/15548627.2015.1100356. Autophagy. 2016. PMID: 26799652 Free PMC article. No abstract available.
  • Seeing is believing: methods to monitor vertebrate autophagy in vivo.
    Lopez A, Fleming A, Rubinsztein DC. Lopez A, et al. Open Biol. 2018 Oct 24;8(10):180106. doi: 10.1098/rsob.180106. Open Biol. 2018. PMID: 30355753 Free PMC article. Review.

References

    1. He C, Klionsky DJ (2009) Regulation mechanisms and signaling pathways of autophagy. Annu Rev Genet 43: 67–93. - PMC - PubMed
    1. Vellai T, Takacs-Vellai K, Sass M, Klionsky DJ (2009) The regulation of aging: does autophagy underlie longevity? Trends Cell Biol 19: 487–494. - PMC - PubMed
    1. Choi AM, Ryter SW, Levine B (2013) Autophagy in human health and disease. N Engl J Med 368: 651–662. - PubMed
    1. Dooley K, Zon LI (2000) Zebrafish: a model system for the study of human disease. Curr Opin Genet Dev 10: 252–256. - PubMed
    1. Dimri GP, Lee X, Basile G, Acosta M, Scott G, et al. (1995) A biomarker that identifies senescent human cells in culture and in aging skin in vivo. Proc Natl Acad Sci U S A 92: 9363–9367. - PMC - PubMed

Publication types

MeSH terms