

Integrating diverse datasets improves developmental enhancer prediction
- PMID: 24967590
- PMCID: PMC4072507
- DOI: 10.1371/journal.pcbi.1003677
Integrating diverse datasets improves developmental enhancer prediction
Abstract
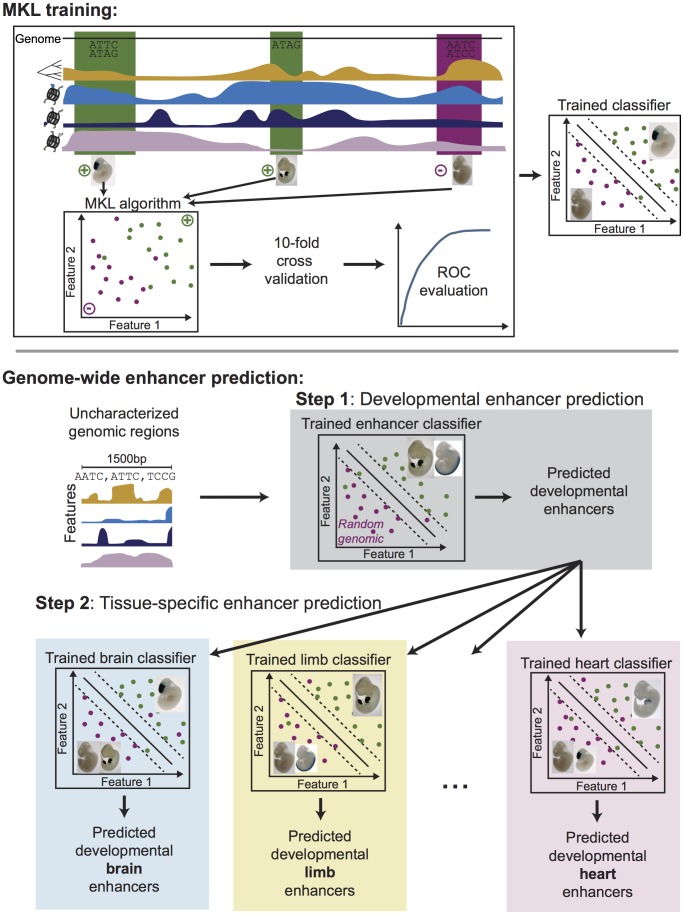
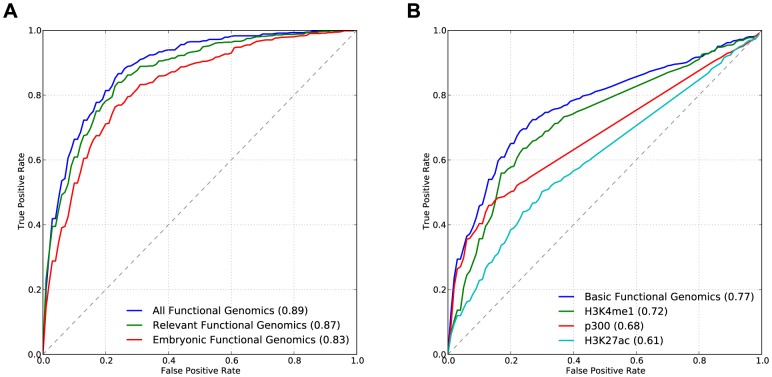
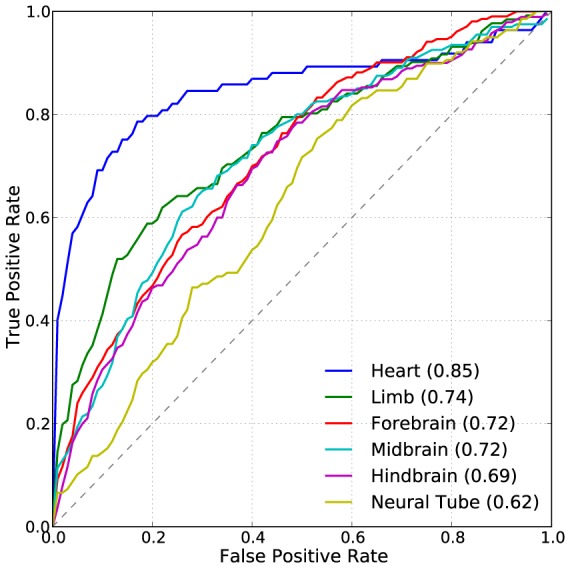
Gene-regulatory enhancers have been identified using various approaches, including evolutionary conservation, regulatory protein binding, chromatin modifications, and DNA sequence motifs. To integrate these different approaches, we developed EnhancerFinder, a two-step method for distinguishing developmental enhancers from the genomic background and then predicting their tissue specificity. EnhancerFinder uses a multiple kernel learning approach to integrate DNA sequence motifs, evolutionary patterns, and diverse functional genomics datasets from a variety of cell types. In contrast with prediction approaches that define enhancers based on histone marks or p300 sites from a single cell line, we trained EnhancerFinder on hundreds of experimentally verified human developmental enhancers from the VISTA Enhancer Browser. We comprehensively evaluated EnhancerFinder using cross validation and found that our integrative method improves the identification of enhancers over approaches that consider a single type of data, such as sequence motifs, evolutionary conservation, or the binding of enhancer-associated proteins. We find that VISTA enhancers active in embryonic heart are easier to identify than enhancers active in several other embryonic tissues, likely due to their uniquely high GC content. We applied EnhancerFinder to the entire human genome and predicted 84,301 developmental enhancers and their tissue specificity. These predictions provide specific functional annotations for large amounts of human non-coding DNA, and are significantly enriched near genes with annotated roles in their predicted tissues and lead SNPs from genome-wide association studies. We demonstrate the utility of EnhancerFinder predictions through in vivo validation of novel embryonic gene regulatory enhancers from three developmental transcription factor loci. Our genome-wide developmental enhancer predictions are freely available as a UCSC Genome Browser track, which we hope will enable researchers to further investigate questions in developmental biology.
Conflict of interest statement
The authors have declared that no competing interests exist.
Figures


Similar articles
-
Taking promoters out of enhancers in sequence based predictions of tissue-specific mammalian enhancers.BMC Med Genomics. 2017 May 24;10(Suppl 1):34. doi: 10.1186/s12920-017-0264-3. BMC Med Genomics. 2017. PMID: 28589862 Free PMC article.
-
Predicting genome-wide tissue-specific enhancers via combinatorial transcription factor genomic occupancy analysis.FEBS Lett. 2025 Jan;599(1):100-119. doi: 10.1002/1873-3468.15030. Epub 2024 Oct 4. FEBS Lett. 2025. PMID: 39367524
-
Extrapolating histone marks across developmental stages, tissues, and species: an enhancer prediction case study.BMC Genomics. 2015 Feb 21;16(1):104. doi: 10.1186/s12864-015-1264-3. BMC Genomics. 2015. PMID: 25765133 Free PMC article.
-
Enhancer target prediction: state-of-the-art approaches and future prospects.Biochem Soc Trans. 2023 Oct 31;51(5):1975-1988. doi: 10.1042/BST20230917. Biochem Soc Trans. 2023. PMID: 37830459 Review.
-
Progress and challenges in bioinformatics approaches for enhancer identification.Brief Bioinform. 2016 Nov;17(6):967-979. doi: 10.1093/bib/bbv101. Epub 2015 Dec 3. Brief Bioinform. 2016. PMID: 26634919 Free PMC article. Review.
Cited by
-
eRFSVM: a hybrid classifier to predict enhancers-integrating random forests with support vector machines.Hereditas. 2016 Jun 30;153:6. doi: 10.1186/s41065-016-0012-2. eCollection 2016. Hereditas. 2016. PMID: 28096768 Free PMC article.
-
Machine and deep learning methods for predicting 3D genome organization.ArXiv [Preprint]. 2024 Mar 4:arXiv:2403.03231v1. ArXiv. 2024. Update in: Methods Mol Biol. 2025;2856:357-400. doi: 10.1007/978-1-0716-4136-1_22. PMID: 38495565 Free PMC article. Updated. Preprint.
-
Limb-Enhancer Genie: An accessible resource of accurate enhancer predictions in the developing limb.PLoS Comput Biol. 2017 Aug 21;13(8):e1005720. doi: 10.1371/journal.pcbi.1005720. eCollection 2017 Aug. PLoS Comput Biol. 2017. PMID: 28827824 Free PMC article.
-
DENdb: database of integrated human enhancers.Database (Oxford). 2015 Sep 5;2015:bav085. doi: 10.1093/database/bav085. Print 2015. Database (Oxford). 2015. PMID: 26342387 Free PMC article.
-
Differential analysis of chromatin accessibility and histone modifications for predicting mouse developmental enhancers.Nucleic Acids Res. 2018 Nov 30;46(21):11184-11201. doi: 10.1093/nar/gky753. Nucleic Acids Res. 2018. PMID: 30137428 Free PMC article.
References
-
- Ahituv N (2012) Gene regulatory sequences and human disease. New York: Springer. x, 283 pages p.
Publication types
MeSH terms
Substances
Grants and funding
- U01 HL098179/HL/NHLBI NIH HHS/United States
- HL098179/HL/NHLBI NIH HHS/United States
- HD059862/HD/NICHD NIH HHS/United States
- R01 GM082901/GM/NIGMS NIH HHS/United States
- U01 HL098188/HL/NHLBI NIH HHS/United States
- UM1 HL098179/HL/NHLBI NIH HHS/United States
- R01 HD059862/HD/NICHD NIH HHS/United States
- DK090382/DK/NIDDK NIH HHS/United States
- GM61390/GM/NIGMS NIH HHS/United States
- R01 NS079231/NS/NINDS NIH HHS/United States
- R01 HG006768/HG/NHGRI NIH HHS/United States
- U19 GM061390/GM/NIGMS NIH HHS/United States
- NS079231/NS/NINDS NIH HHS/United States
- R01 HG005058/HG/NHGRI NIH HHS/United States
- HG005058/HG/NHGRI NIH HHS/United States
- T32 GM067547/GM/NIGMS NIH HHS/United States
- HG006768/HG/NHGRI NIH HHS/United States
- U01 GM061390/GM/NIGMS NIH HHS/United States
- R01 DK090382/DK/NIDDK NIH HHS/United States
- GM082901/GM/NIGMS NIH HHS/United States
LinkOut - more resources
Full Text Sources
Other Literature Sources
Research Materials
Miscellaneous
