

Mycobacteria counteract a TLR-mediated nitrosative defense mechanism in a zebrafish infection model
- PMID: 24967596
- PMCID: PMC4072692
- DOI: 10.1371/journal.pone.0100928
Mycobacteria counteract a TLR-mediated nitrosative defense mechanism in a zebrafish infection model
Abstract
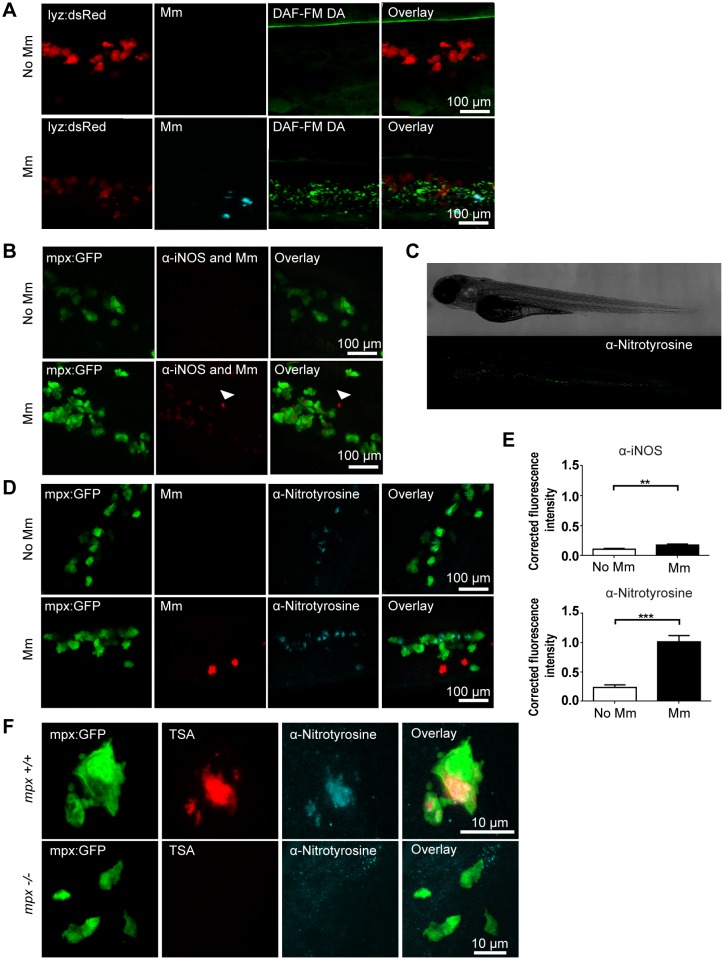
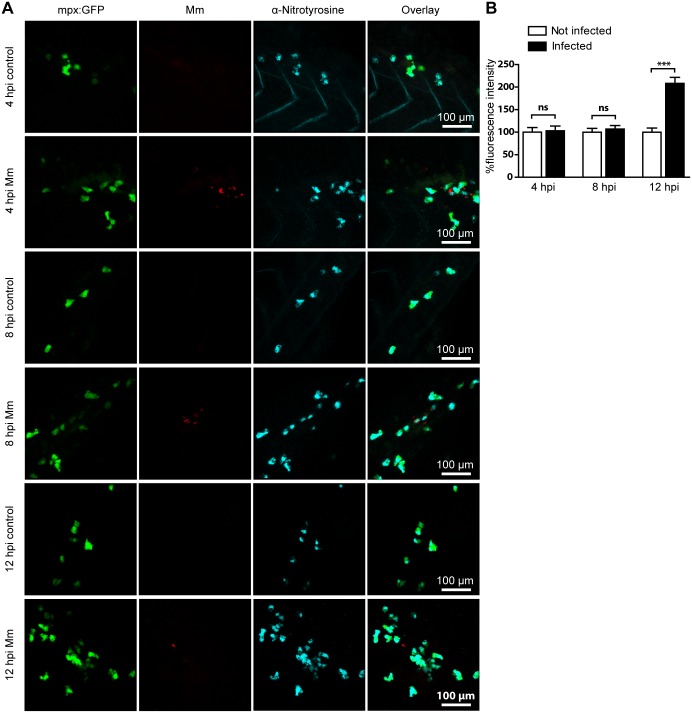
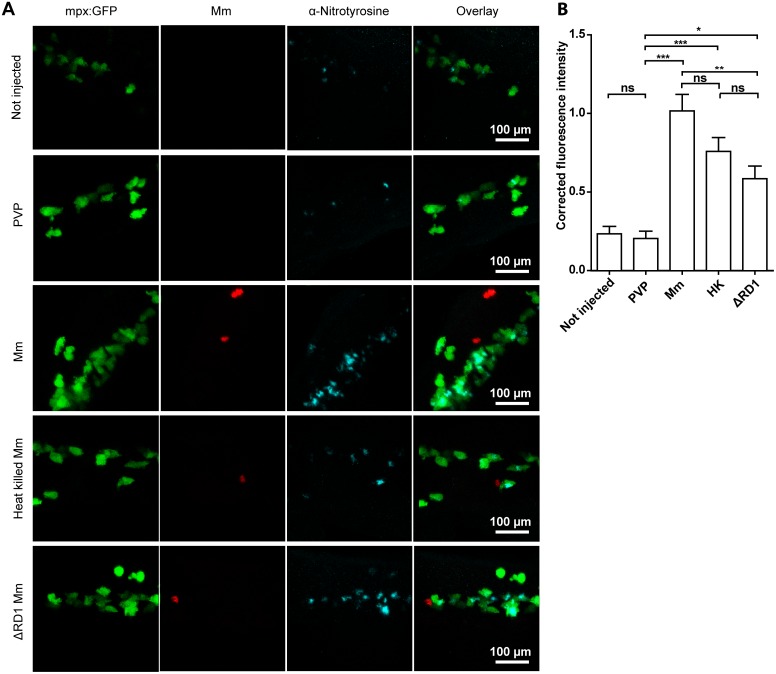
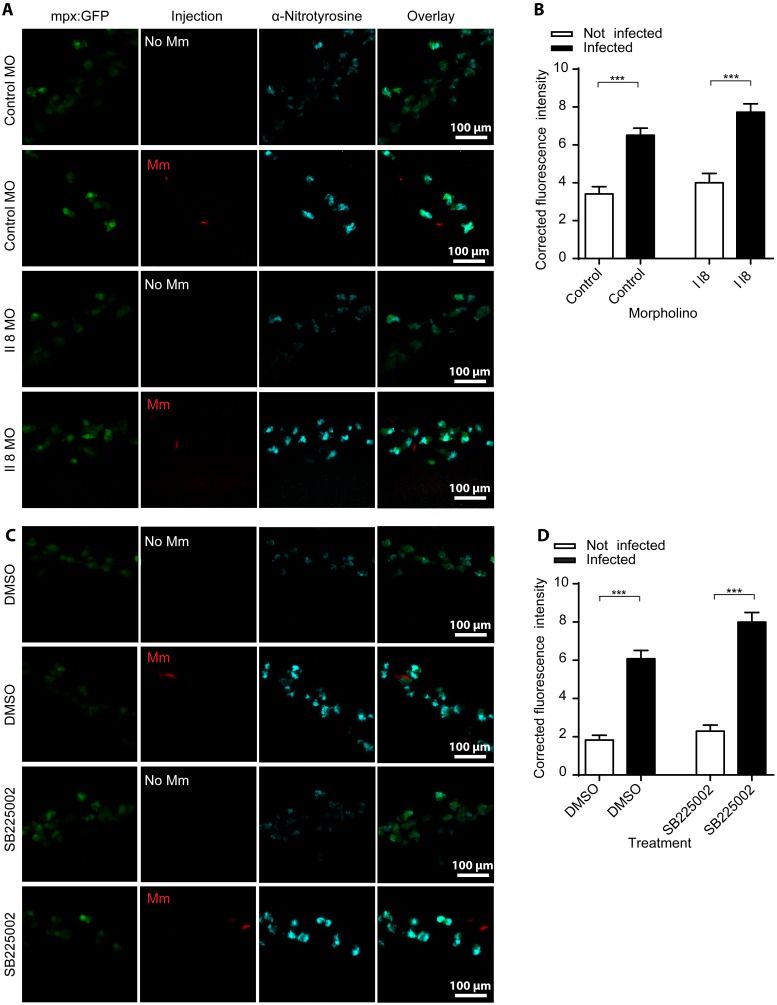
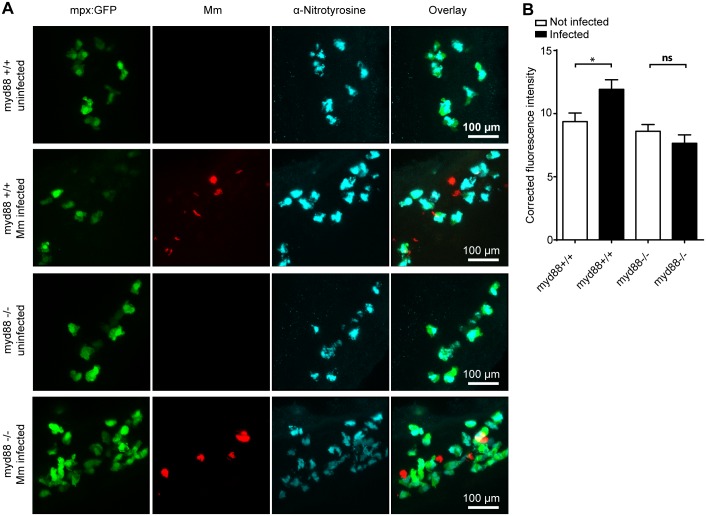
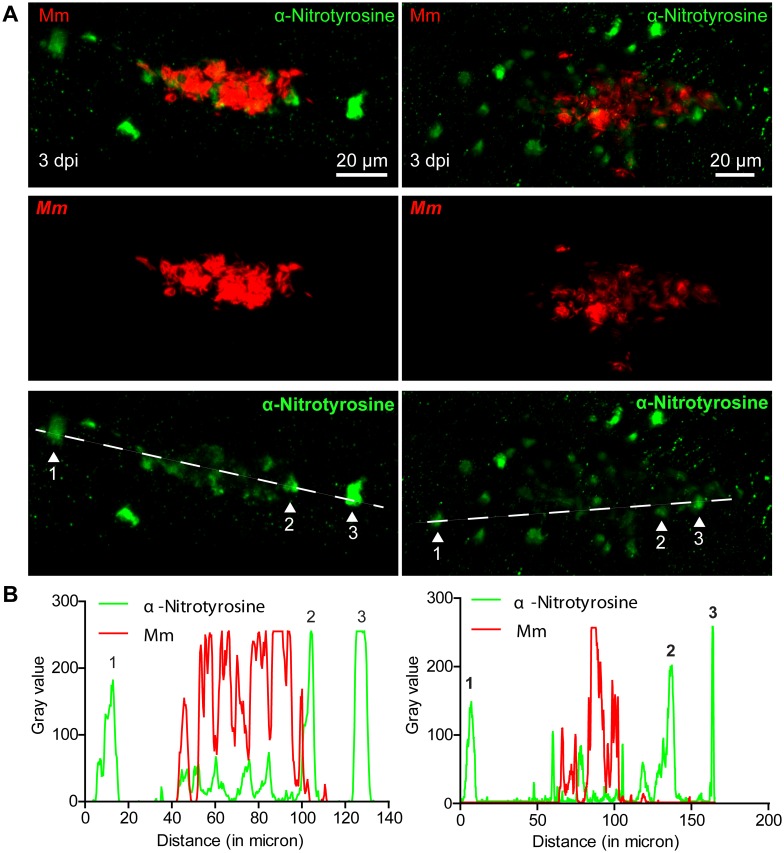
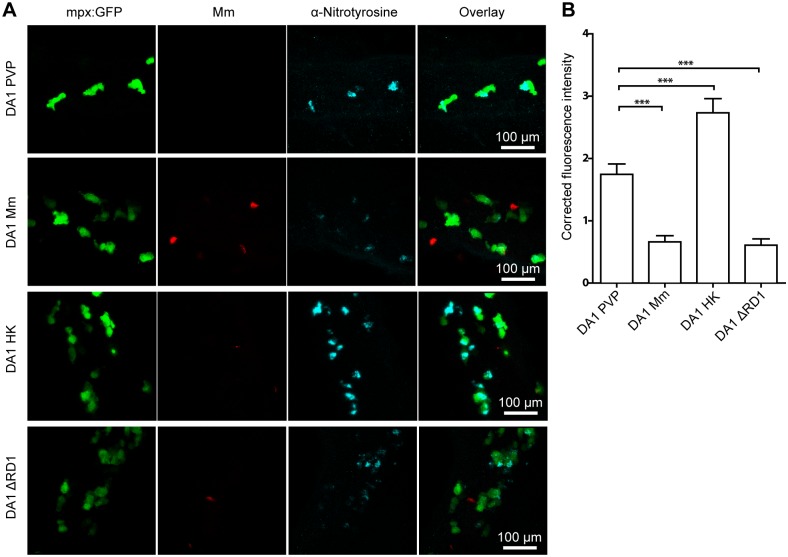
Pulmonary tuberculosis (TB), caused by the intracellular bacterial pathogen Mycobacterium tuberculosis (Mtb), is a major world health problem. The production of reactive nitrogen species (RNS) is a potent cytostatic and cytotoxic defense mechanism against intracellular pathogens. Nevertheless, the protective role of RNS during Mtb infection remains controversial. Here we use an anti-nitrotyrosine antibody as a readout to study nitration output by the zebrafish host during early mycobacterial pathogenesis. We found that recognition of Mycobacterium marinum, a close relative of Mtb, was sufficient to induce a nitrosative defense mechanism in a manner dependent on MyD88, the central adaptor protein in Toll like receptor (TLR) mediated pathogen recognition. However, this host response was attenuated by mycobacteria via a virulence mechanism independent of the well-characterized RD1 virulence locus. Our results indicate a mechanism of pathogenic mycobacteria to circumvent host defense in vivo. Shifting the balance of host-pathogen interactions in favor of the host by targeting this virulence mechanism may help to alleviate the problem of infection with Mtb strains that are resistant to multiple drug treatments.
Conflict of interest statement
Figures
Similar articles
-
The DNA damage-regulated autophagy modulator DRAM1 links mycobacterial recognition via TLR-MYD88 to autophagic defense [corrected].Cell Host Microbe. 2014 Jun 11;15(6):753-67. doi: 10.1016/j.chom.2014.05.005. Cell Host Microbe. 2014. PMID: 24922577
-
[Frontier of mycobacterium research--host vs. mycobacterium].Kekkaku. 2005 Sep;80(9):613-29. Kekkaku. 2005. PMID: 16245793 Japanese.
-
DRAM1 promotes the targeting of mycobacteria to selective autophagy.Autophagy. 2014;10(12):2389-91. doi: 10.4161/15548627.2014.984280. Autophagy. 2014. PMID: 25484076 Free PMC article.
-
Intracellular signalling cascades regulating innate immune responses to Mycobacteria: branching out from Toll-like receptors.Cell Microbiol. 2007 May;9(5):1087-98. doi: 10.1111/j.1462-5822.2007.00914.x. Epub 2007 Mar 13. Cell Microbiol. 2007. PMID: 17359235 Review.
-
A Role of Intracellular Toll-Like Receptors (3, 7, and 9) in Response to Mycobacterium tuberculosis and Co-Infection with HIV.Int J Mol Sci. 2020 Aug 26;21(17):6148. doi: 10.3390/ijms21176148. Int J Mol Sci. 2020. PMID: 32858917 Free PMC article. Review.
Cited by
-
Neutrophils use superoxide to control bacterial infection at a distance.PLoS Pathog. 2018 Jul 17;14(7):e1007157. doi: 10.1371/journal.ppat.1007157. eCollection 2018 Jul. PLoS Pathog. 2018. PMID: 30016370 Free PMC article.
-
Chemokine Receptors and Phagocyte Biology in Zebrafish.Front Immunol. 2020 Feb 25;11:325. doi: 10.3389/fimmu.2020.00325. eCollection 2020. Front Immunol. 2020. PMID: 32161595 Free PMC article. Review.
-
Priming of innate antimycobacterial immunity by heat-killed Listeria monocytogenes induces sterilizing response in the adult zebrafish tuberculosis model.Dis Model Mech. 2018 Jan 29;11(1):dmm031658. doi: 10.1242/dmm.031658. Dis Model Mech. 2018. PMID: 29208761 Free PMC article.
-
Exploring the HIFs, buts and maybes of hypoxia signalling in disease: lessons from zebrafish models.Dis Model Mech. 2015 Nov;8(11):1349-60. doi: 10.1242/dmm.021865. Dis Model Mech. 2015. PMID: 26512123 Free PMC article. Review.
-
Assessing developmental toxicity and non-CYP mediated biotransformation of two anti-epileptics and their human metabolites in zebrafish embryos and larvae.Curr Res Toxicol. 2024 Jul 11;7:100186. doi: 10.1016/j.crtox.2024.100186. eCollection 2024. Curr Res Toxicol. 2024. PMID: 39188273 Free PMC article.
References
-
- Koul A, Arnoult E, Lounis N, Guillemont J, Andries K (2011) The challenge of new drug discovery for tuberculosis. Nature 469: 483–490. - PubMed
-
- Vergne I, Chua J, Singh SB, Deretic V (2004) Cell biology of mycobacterium tuberculosis phagosome. Annu Rev Cell Dev Biol 20: 367–394. - PubMed
-
- Ulrichs T, Kaufmann SH (2006) New insights into the function of granulomas in human tuberculosis. J Pathol 208: 261–269. - PubMed
Publication types
MeSH terms
Substances
LinkOut - more resources
Full Text Sources
Other Literature Sources
Medical
Molecular Biology Databases
