

Recombination accelerates adaptation on a large-scale empirical fitness landscape in HIV-1
- PMID: 24967626
- PMCID: PMC4072600
- DOI: 10.1371/journal.pgen.1004439
Recombination accelerates adaptation on a large-scale empirical fitness landscape in HIV-1
Abstract
Recombination has the potential to facilitate adaptation. In spite of the substantial body of theory on the impact of recombination on the evolutionary dynamics of adapting populations, empirical evidence to test these theories is still scarce. We examined the effect of recombination on adaptation on a large-scale empirical fitness landscape in HIV-1 based on in vitro fitness measurements. Our results indicate that recombination substantially increases the rate of adaptation under a wide range of parameter values for population size, mutation rate and recombination rate. The accelerating effect of recombination is stronger for intermediate mutation rates but increases in a monotonic way with the recombination rates and population sizes that we examined. We also found that both fitness effects of individual mutations and epistatic fitness interactions cause recombination to accelerate adaptation. The estimated epistasis in the adapting populations is significantly negative. Our results highlight the importance of recombination in the evolution of HIV-I.
Conflict of interest statement
The authors have declared that no competing interests exist.
Figures
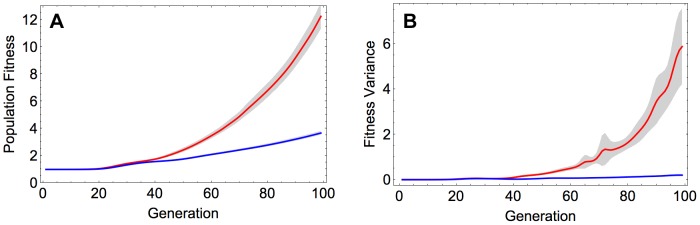
 and
and  .
.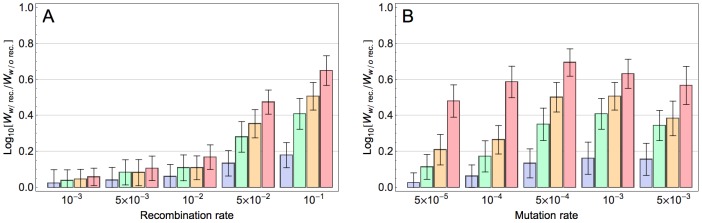
 and
and  , respectively. The error bars show the standard deviation of the difference between two log normal distributions (
 ). A) The effect of recombination rate at different population sizes for mutation rate:
  . B) The effect of mutation rate at different population sizes for recombination rate:
  . (The effect of recombination is still significant for populations larger than 103 with this recombination rate; see Figure S5).
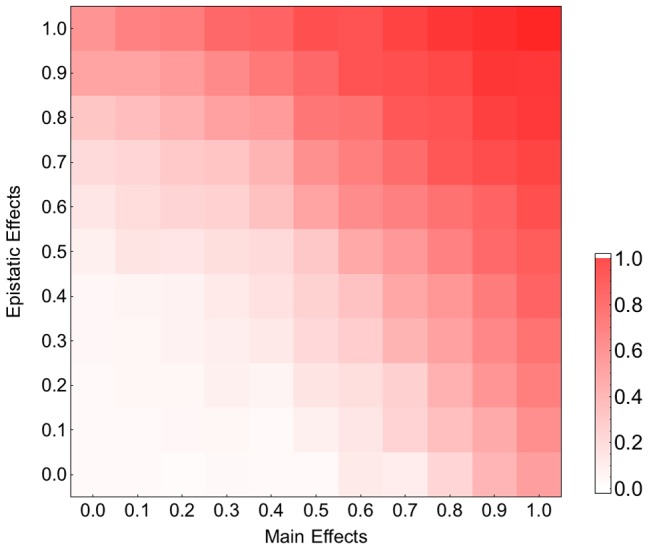
 and
and  .
.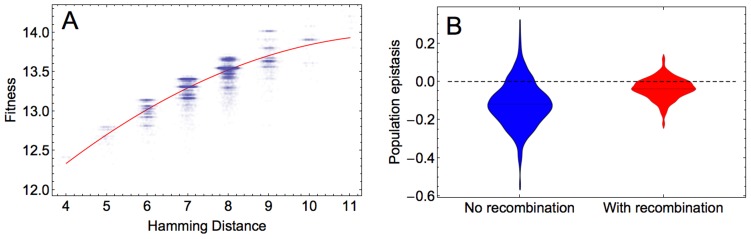
 and
and  .
.References
-
- Weismann A (1904) The evolution theory. London: Edward Arnold.
-
- Otto SP, Gerstein AC (2006) Why have sex? The population genetics of sex and recombination. Biochem Soc Trans 34: 519–522. - PubMed
-
- Barton NH, Charlesworth B (1998) Why sex and recombination? Science 281: 1986–1990. - PubMed
-
- Maynard Smith JM (1988) Selection for recombination in a polygenic model–the mechanism. Genet Res 51: 59–63. - PubMed
Publication types
MeSH terms
LinkOut - more resources
Full Text Sources
Other Literature Sources
