Meta-Analysis
. 2014 Jun 26;9(6):e100789.
doi: 10.1371/journal.pone.0100789. eCollection 2014.

Association between thrombophilia gene polymorphisms and preeclampsia: a meta-analysis

Affiliations
Meta-Analysis

Association between thrombophilia gene polymorphisms and preeclampsia: a meta-analysis

Xi Wang et al. PLoS One. .

Abstract

Objective: To estimate the relationship between the risk of preeclampsia and two thrombophilia gene single-nucleotide polymorphisms (SNPs), the factor V G1691A SNP and the prothrombin G20210A SNP.

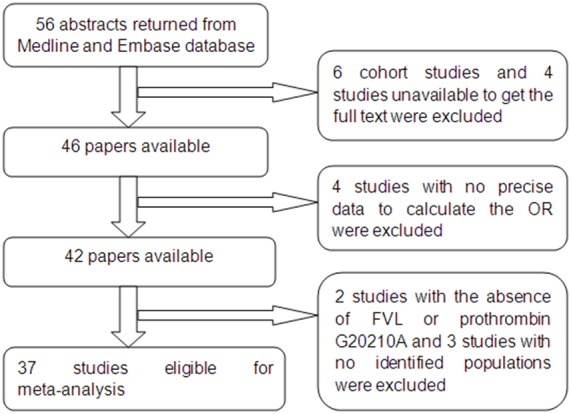
Date sources: A systematic search of the English-language literature up to November 2012 was performed using Medline and EMBASE. Search terms included "preeclampsia," "thrombophilia," "factor V Leiden," "prothrombin gene 20210," and their combinations.

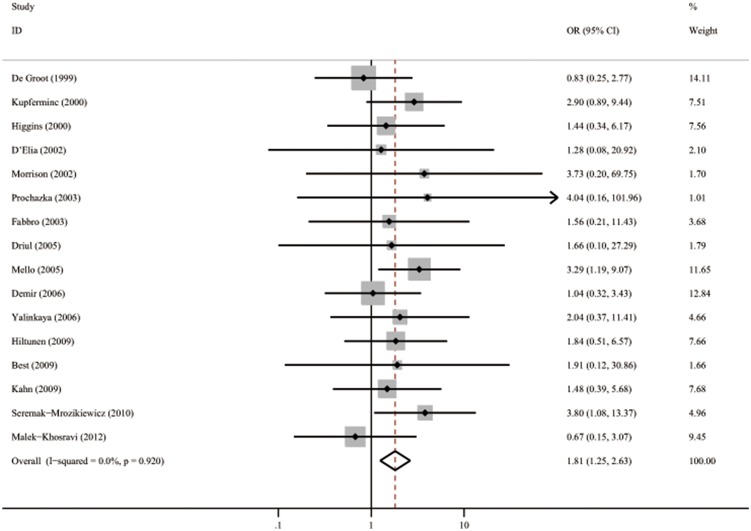
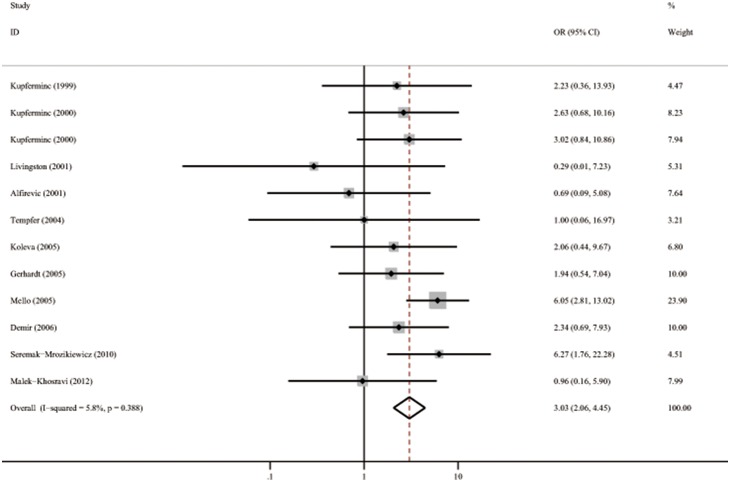
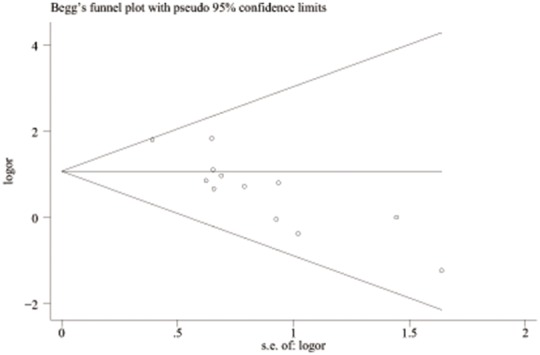
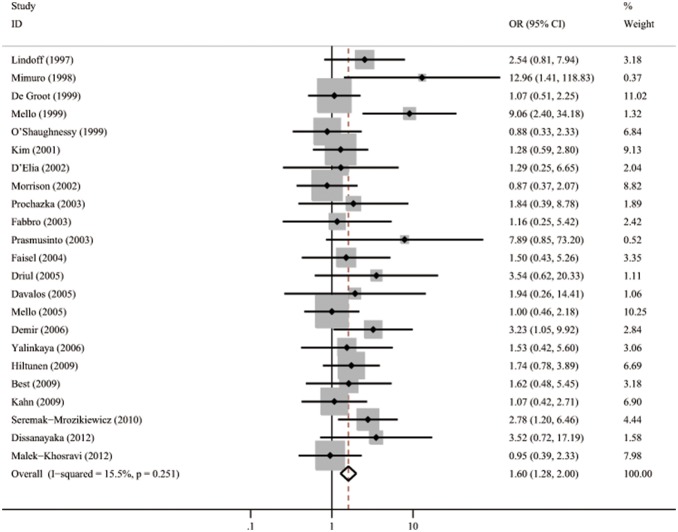
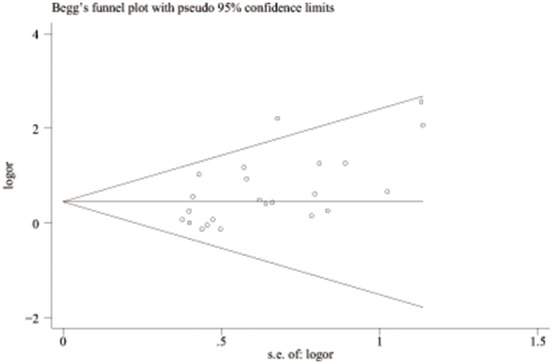
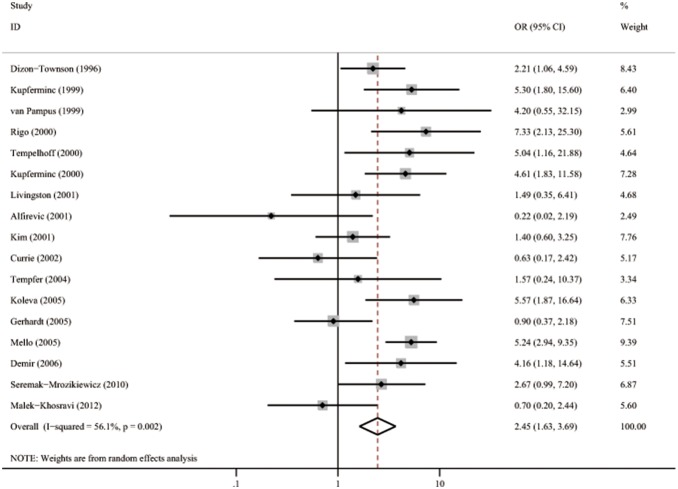
Result(s): Thirty-seven studies with 5048 preeclampsia patients and 6796 controls were included in the meta-analysis. We found that the prothrombin G20210A polymorphism was associated with an increased risk of all preeclampsia (pooled odds ratio (OR) = 1.81, 95% confidence interval (CI) 1.25-2.63) and severe preeclampsia (pooled OR = 3.02, 95%CI 2.06-4.45). Meanwhile, the pooled OR for the association between factor V Leiden and all preeclampsia was 1.60 (95%CI 1.28-2.00) and 2.45 (95%CI 1.63-3.69) for the cases of severe preeclampsia.

Conclusion(s): This meta-analysis supports that the factor V G1691A SNP and the prothrombin G20210A SNP are associated with an increased risk for both preeclampsia overall and severe preeclampsia.


Conflict of interest statement

Competing Interests: The authors have declared that no competing interests exist.

Figures

Figure 1
Figure 1. Flow diagram of meta-analysis literature search results.
Figure 2
Figure 2. Forest plot of OR with 95%CI of all preeclampsia associated with the prothrombin G20210A polymorphism by fixed model.
Black square means value of OR, and the size of the square means inversely proportional to its variance. Horizontal line means 95% confience interval (CI) of OR. Black diamond means pooled results.
Figure 3
Figure 3. Begg’s funnel plot of publication bias test of all preeclampsia associated with the prothrombin G20210A polymorphism. LogOR means nature logarithm of OR (odds ratio).
Horizontal line means the summary estimate, while the sloping lines mean the expected 95% confidence interval.
Figure 4
Figure 4. Forest plots of OR with 95%CI of severe preeclampsia associated with the prothrombin G20210A polymorphism in fixed model.
Black square means value of OR, and the size of the square means inversely proportional to its variance. Horizontal line means 95% confience interval (CI) of OR. Black diamond means pooled results.
Figure 5
Figure 5. Begg’s funnel plot of publication bias test of severe preeclampsia associated with the prothrombin G20210A polymorphism.
LogOR means nature logarithm of OR (odds ratio). Horizontal line means the summary estimate, while the sloping lines mean the expected 95% confidence interval.
Figure 6
Figure 6. Forest plots of OR with 95%CI of all preeclampsia associated with FVL in fixed model.
Black square means value of OR, and the size of the square means inversely proportional to its variance. Horizontal line means 95% confience interval (CI) of OR. Black diamond means pooled result.
Figure 7
Figure 7. Begg’s funnel plot of publication bias test of all preeclampsia associated with FVL.
LogOR means nature logarithm of OR (odds ratio). Horizontal line means the summary estimate, while the sloping lines mean the expected 95% confidence interval.
Figure 8
Figure 8. Forest plots of OR with 95%CI of severe preeclampsia associated with FVL in random model.
Black square means value of OR, and the size of the square means inversely proportional to its variance. Horizontal line means 95% confience interval (CI) of OR. Black diamond means pooled results.
Figure 9
Figure 9. Begg’s funnel plot of publication bias test of severe preeclampsia associated with FVL.
LogOR means nature logarithm of OR (odds ratio). Horizontal line means the summary estimate, while the sloping lines mean the expected 95% confidence interval.

References

    1. Sibai B, Dekker G, Kupferminc M (2005) Pre-eclampsia. Lancet 365: 785–799. - PubMed
    1. Arngrimsson R, Hayward C, Nadaud S, Baldursdottir A, Walker JJ, et al. (1997) Evidence for a familial pregnancy-induced hypertension locus in the eNOS-gene region. Am J Hum Genet 61: 354–362. - PMC - PubMed
    1. Wilson ML, Goodwin TM, Pan VL, Ingles SA (2003) Molecular epidemiology of preeclampsia. Obstet Gynecol Surv 58: 39–66. - PubMed
    1. Preston FE, Rosendaal FR, Walker ID, Briet E, Berntorp E, et al. (1996) Increased fetal loss in women with heritable thrombophilia. Lancet 348: 913–916. - PubMed
    1. Dahlback B (1994) Inherited resistance to activated protein C, a major cause of venous thrombosis, is due to a mutation in the factor V gene. Haemostasis 24: 139–151. - PubMed

Publication types

LinkOut - more resources