. 2014 Jun 26;10(6):e1004080.
doi: 10.1371/journal.ppat.1004080. eCollection 2014 Jun.

Ly6C(high) monocytes become alternatively activated macrophages in schistosome granulomas with help from CD4+ cells

Affiliations

Ly6C(high) monocytes become alternatively activated macrophages in schistosome granulomas with help from CD4+ cells

Natasha M Girgis et al. PLoS Pathog. .

Abstract

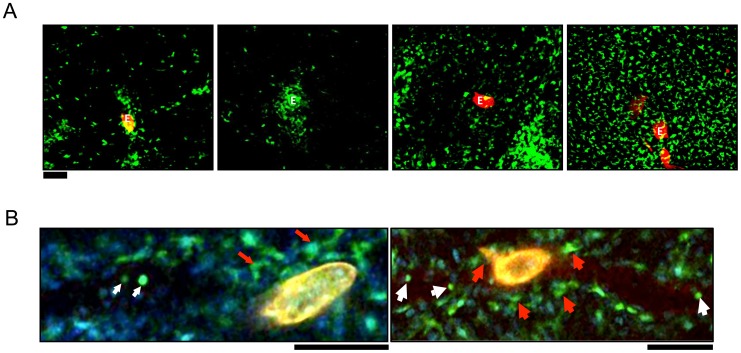
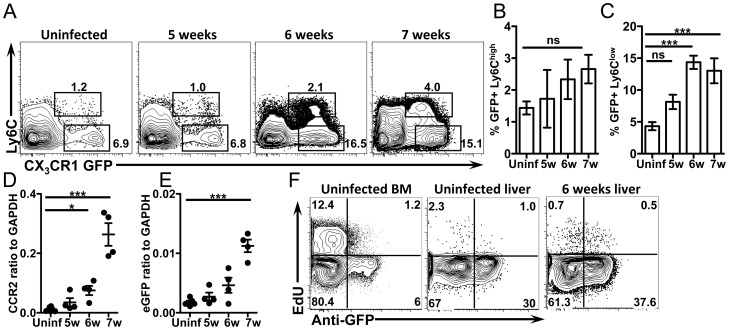
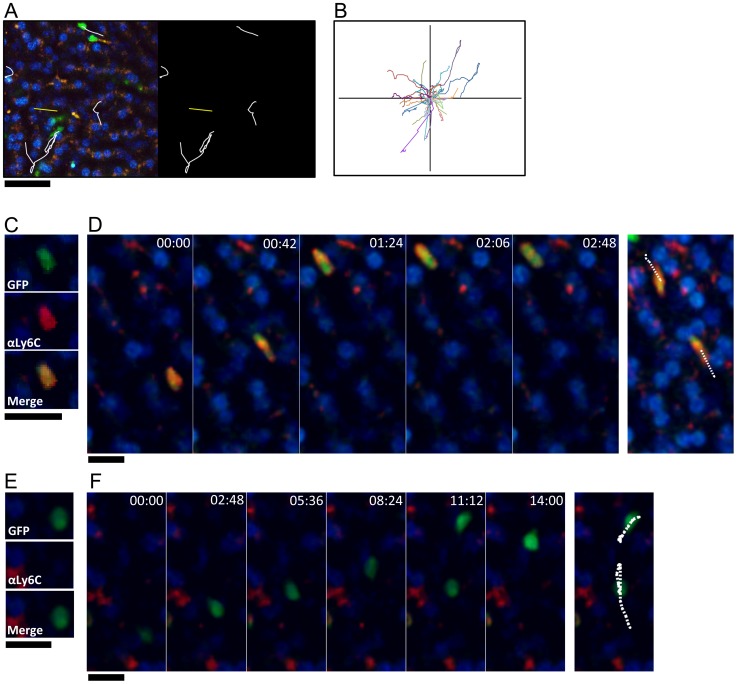
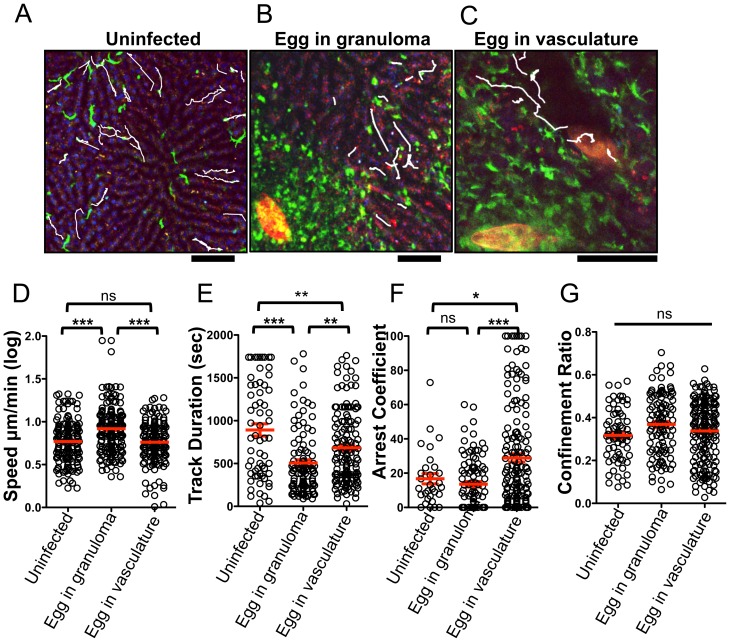
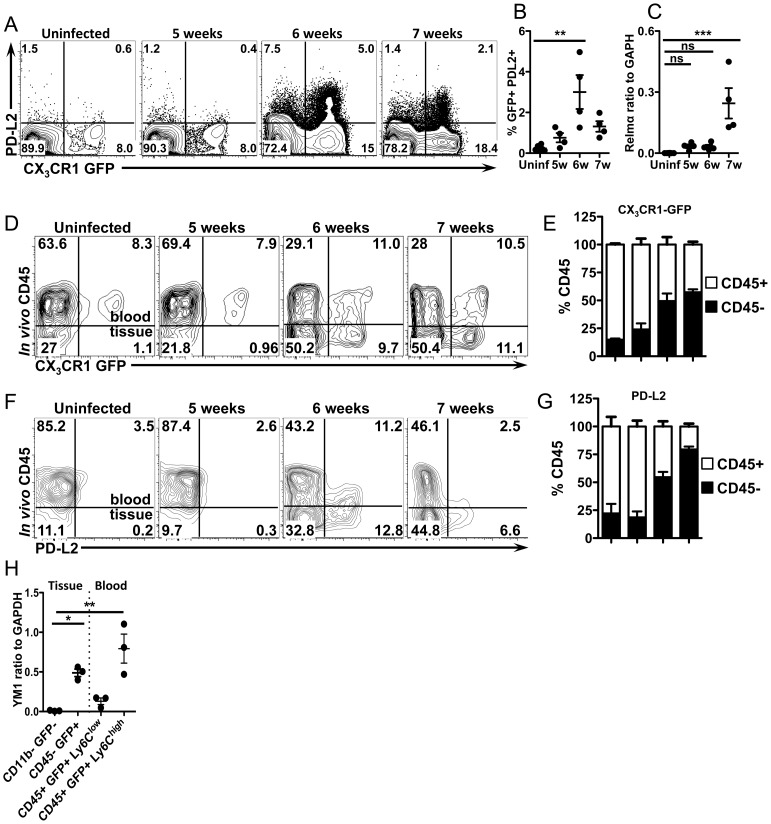
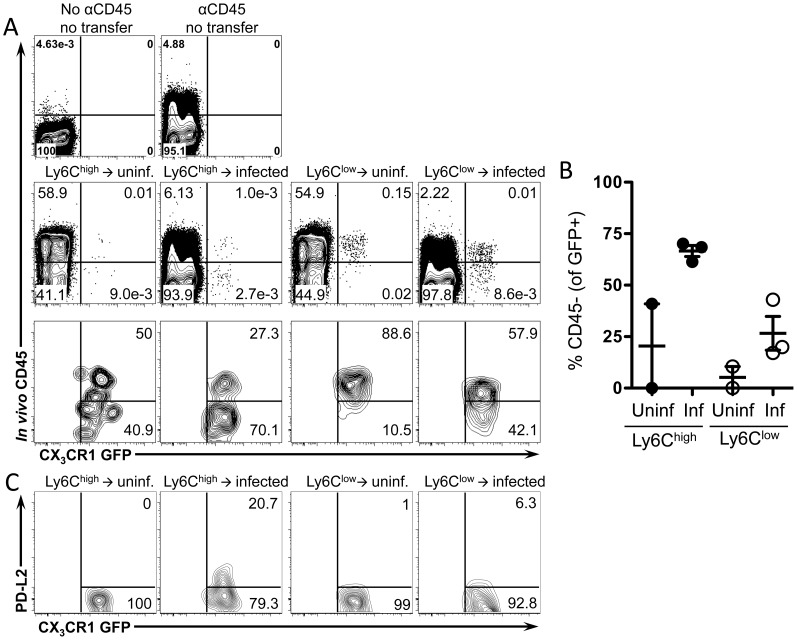
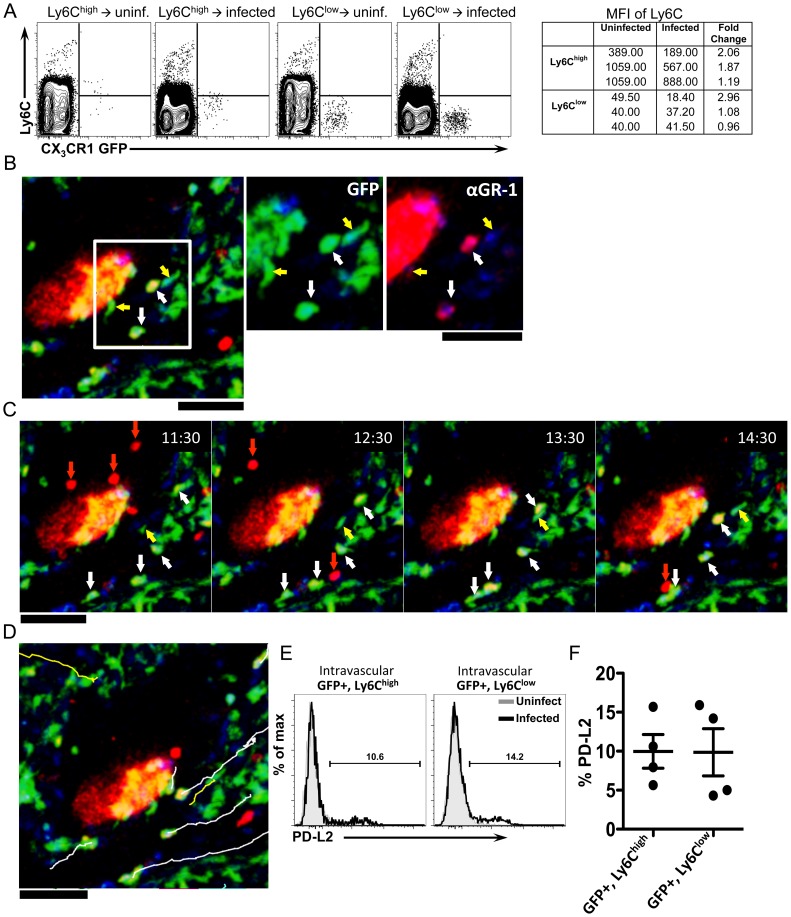
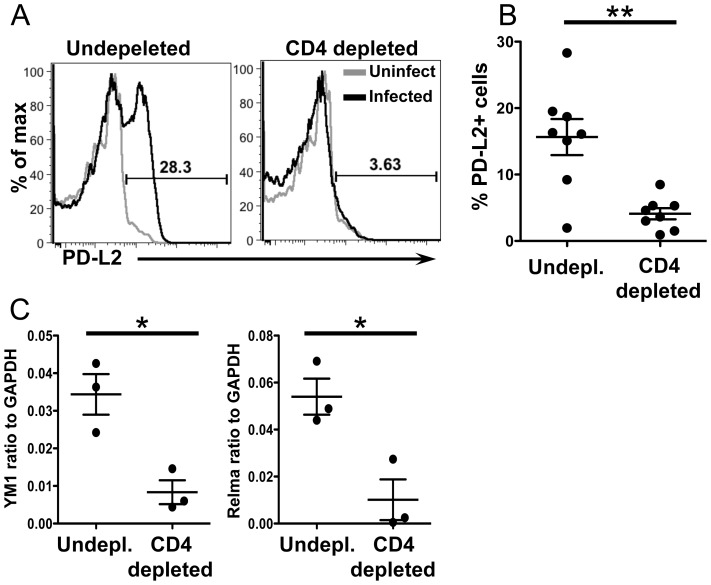
Alternatively activated macrophages (AAM) that accumulate during chronic T helper 2 inflammatory conditions may arise through proliferation of resident macrophages or recruitment of monocyte-derived cells. Liver granulomas that form around eggs of the helminth parasite Schistosoma mansoni require AAM to limit tissue damage. Here, we characterized monocyte and macrophage dynamics in the livers of infected CX3CR1(GFP/+) mice. CX₃CR1-GFP⁺ monocytes and macrophages accumulated around eggs and in granulomas during infection and upregulated PD-L2 expression, indicating differentiation into AAM. Intravital imaging of CX₃CR1-GFP⁺ Ly6C(low) monocytes revealed alterations in patrolling behavior including arrest around eggs that were not encased in granulomas. Differential labeling of CX₃CR1-GFP⁺ cells in the blood and the tissue showed CD4⁺ T cell dependent accumulation of PD-L2⁺ CX₃CR1-GFP⁺ AAM in the tissues as granulomas form. By adoptive transfer of Ly6C(high) and Ly6C(low) monocytes into infected mice, we found that AAM originate primarily from transferred Ly6C(high) monocytes, but that these cells may transition through a Ly6C(low) state and adopt patrolling behavior in the vasculature. Thus, during chronic helminth infection AAM can arise from recruited Ly6C(high) monocytes via help from CD4⁺ T cells.


Conflict of interest statement

The authors have declared that no competing interests exist.

Figures

Figure 1
Figure 1. CX3CR1-GFP+ cells accumulate in the hepatic granulomas around S. mansoni eggs.
(A) Intravital confocal imaging of liver granulomas in S. mansoni-infected CX3CR1GFP/+ mice between 6–8 weeks post-infection Eggs visualized through auto-fluorescence can be seen in the red channel and are labeled “E.” CX3CR1-GFP+ cells are shown in green. Scale bar = 100 µm. (B) Intravital snapshot of an infected CX3CR1GFP/+ mouse showing stationary cells with macrophage-like morphology (red arrows) around a schistosome egg (yellow) and motile intravascular GFP+ cells (white arrows).
Figure 2
Figure 2. CX3CR1-GFP+ monocytes accumulate in the liver when S. mansoni eggs appear without proliferation.
(A–C) Representative flow cytometry plots and graphs display the proportion of GFP+ Ly6Chigh and Ly6Clow monocytes from CX3CR1GFP/+ mice gated on live, single, lineage (CD3, B220, DX5 and Siglec F) negative, SSClow cells. (D–E) qRT-PCR analysis of CCR2 and eGFP expression in the liver. (F) Representative contour plots show in situ EdU labeling of liver leukocytes gated on live, single, lineage negative, CD11b+ cells. Results are representative of two experiments that included n = 3–4 mice/group. Statistical significance was determined by One-way ANOVA with Dunnett's test. * = p<0.05, ** = p<0.001, *** = p<0.0001.
Figure 3
Figure 3. GFP+Ly6Clow monocytes exhibit patrolling behavior, while GFP+Ly6Chigh cells transit rapidly through the sinusoids.
(A) High magnification snapshot showing tracks of GFP+ crawling cells (white) and GFP+ cells that move rapidly through the sinusoids (yellow) in a steady state uninfected liver. Scale bar = 50 µm. (B) Representative tracks of crawling monocytes in steady state uninfected livers. (C and E) Intravital confocal microscopy of an uninfected Cx3cr1gfp/+ mouse showing GFP+ (green) monocytes that are either Ly6Chigh (C) or Ly6Clow (E) after intravenous anti-Ly6C Ab staining (red). (D and F) Time-lapse images from an uninfected Cx3cr1gfp/+ mouse injected with anti-Ly6C Ab showing two GFP+ Ly6Chigh monocytes (D) and two GFP+ Ly6Clow monocytes migrating through the sinusoids (F). GFP is shown in green, anti-Ly6C in red, and nuclei in blue. Snapshots were taken in single z planes. Scale bars = 20 µm. Tracks are shown in white.
Figure 4
Figure 4. The presence of S. mansoni eggs alters the patrolling behavior of CX3CR1-GFP+ monocytes in the liver sinusoids.
(A–C) Maximum projections of Z stacks from the livers of (A) uninfected Cx3cr1gfp/+ mice and S. mansoni-infected Cx3cr1gfp/+ mice with an egg encapsulated in a granuloma (B), or with an egg in the blood vessels (C). Sinusoidal vessels (dark areas) and tissue architecture are visualized by nuclear staining (blue) and auto-fluorescence in the red channel. Parasite eggs are auto-fluorescent and can be seen in red. White tracks showing the paths of individual motile CX3CR1-GFP+ cells (green) are overlayed onto images. Scale bars = 50 µm (D) Log-transformed mean speed (µm/min), (E) track duration of motile GFP+ cells, (F) arrest coefficient (fraction of time cell crawls <2 µm/min) and (G) confinement ratio (Displacement/track length). Motility data is pooled from 3 mice for uninfected mice (n = 68 cells), 5 mice for fully developed granulomas (n = 182 cells). Data for exposed eggs in the vasculature is pooled from 6 mice (n = 143). Scale bars = 100 µm. * = p<0.05, ** = p<0.001, *** = p<0.0001.
Figure 5
Figure 5. CX3CR1-GFP+ cells upregulate PD-L2 as they extravasate and accumulate in liver tissue.
(A and B) Representative contour plots and graphs displaying PD-L2 expression on liver leukocytes isolated from uninfected or infected CX3CR1gfp/+ mice gated on live, single, lineage (CD3, B220, DX5 and Siglec F) negative, SSClow cells. n = 4 mice/group. (C) qRT-PCR analysis of Relmα expression. (D) Representative contour plots show blood/tissue partitioning of GFP+ liver leukocytes from CX3CR1GFP/+ mice using in vivo CD45 staining. Plots display cells gated on single, live, lineage negative cells. (E) The proportion of CD45+ (white) or CD45 (black) cells gated on live single, lineage, GFP+ cells. (F) Contour plots display blood/tissue partitioning of PDL2+, GFP+ cells gated on single, live, lin-, CX3CR1-GFP+ cells. (G) Proportions of GFP+PDL2+ cells that are CD45+ (white) or CD45 (black) as in (E). (H). qRT-PCR analysis of YM1 expression in liver leukocytes sorted from 8 week infected mice using in vivo CD45 staining to isolate CD45−(tissue) GFP+ granuloma macrophages from CD45+ (blood) GFP+, Ly6Chigh and Ly6Clow monocytes. CD11b-GFP− cells from infected mice were used as a negative control. Dots represent individual mice from one of two experiments. Statistical significance was determined by One-way ANOVA with Dunnett's test. ** = p<0.001, *** = p<0.0001. Results are representative of at least two experiments that include n = 3–4 mice/group.
Figure 6
Figure 6. Ly6Chigh monocytes extravasate more efficiently than Ly6Clow monocytes and upregulate PD-L2.
Splenic monocytes were purified from CX3CR1GFP/+ mice. Splenocytes depleted of CD19+ and CD3+ cells were FACS sorted to isolate single, live, CD3−, B220, Ly6G, MHCII, DX5, Siglec F, CD11c, F4/80, CD11b+, GFP+, Ly6Chigh or Ly6Clow monocytes. Transferred monocytes were recovered from the livers of uninfected or 8 week-infected C57BL/6 recipient mice 24 hours after transfer and analyzed by flow cytometry for blood/tissue partitioning of GFP+ cells using in vivo CD45 staining. (A) Representative plots show live, single, lin, CD11b+ cells. Lower panels in (A) are also gated on transferred GFP+ cells. (B) The graph displays the proportion of transferred GFP+ cells that entered the tissue (CD45) and includes mice (n = 3) pooled from two independent experiments. (C) Contour plots display PD-L2 expression on transferred cells gated on live, single, lin, CD11b+, GFP+ cells.
Figure 7
Figure 7. Ly6Chigh monocytes reduce Ly6C expression, exhibit crawling behavior, and upregulate markers of alternative activation after infection.
(A) Contour plots display Ly6C expression on monocytes isolated from CX3CR1GFP/+ mice and transferred into uninfected or infected C57BL/6 mice (as described in Figure 6). Lines serve as guides to show the level of Ly6C expression. (B) Intravital confocal microscopy of an infected Cx3cr1gfp/+ mouse showing crawling GFP+ cells (green) that are either Ly6C+ (white arrows) or Ly6C (yellow arrows) after intravenous anti-GR-1 (Ly6C/G) Ab labeling (red). (C) Time-lapse images from an 8-week infected Cx3cr1gfp/+ mouse injected with anti-Ly6C/Ly6G Ab showing the movement of GFP+ Ly6C+ cells (white arrows), GFP+ Ly6C− cells (yellow arrows) and GFP− GR-1+ neutrophils (red arrows). (D) Tracks of GFP+ Ly6C+ cells (white lines), GFP+ Ly6C− cells (yellow lines) shown in the time lapse. GFP is shown in green, anti-Ly6C (GR-1) in red, and nuclei in blue. Scale bars = 50 µm. Data is representative of experiments from 2 mice. (E–F) Representative histograms (E) and graph (F) display the percentage of PD-L2+GFP+Ly6Chigh and PD-L2+GFP+Ly6Clow cells from the blood (by in vivo CD45 staining) of 6-week infected mice (black) or uninfected mice (gray). Cells are gated on single, live, lineage negative, in vivo CD45+, GFP+ cells. Data is representative of two independent experiments. N = 4 mice/group.
Figure 8
Figure 8. CD4+ T cells are required for upregulation of PD-L2 and alternative activation.
(A) Infected mice were depleted of CD4+ T cells from 5.5–6.5 weeks post-infection. Representative histogram plots display PD-L2 expression on live, single, lin−, CD11b+ GFP+ cells. (B) Percentage of PDL2+ cells in undepleted and depleted mice gated as in (A). (C) qRT-PCR analysis of YM1 and Relmαexpression in whole tissue. CD4 depletion results are pooled from two independent experiments for a total of n = 8. qRT-PCR results are from a single experiment. Error bars represent SEM and statistical significance was determined using the Mann-Whitney test. * = p<0.05, ** = p<0.001.

References

    1. Allen JE, Maizels RM (2011) Diversity and dialogue in immunity to helminths. Nat Rev Immunol 11: 375–388. - PubMed
    1. Gordon S, Martinez FO (2010) Alternative activation of macrophages: mechanism and functions. Immunity 32: 593–604. - PubMed
    1. Van Dyken SJ, Locksley RM (2013) Interleukin-4- and Interleukin-13-Mediated Alternatively Activated Macrophages: Roles in Homeostasis and Disease. Annu Rev Immunol 31: 317–343. - PMC - PubMed
    1. Herbert DR, Holscher C, Mohrs M, Arendse B, Schwegmann A, et al. (2004) Alternative macrophage activation is essential for survival during schistosomiasis and downmodulates T helper 1 responses and immunopathology. Immunity 20: 623–635. - PubMed
    1. Anthony RM, Urban JF Jr, Alem F, Hamed HA, Rozo CT, et al. (2006) Memory T(H)2 cells induce alternatively activated macrophages to mediate protection against nematode parasites. Nature medicine 12: 955–960. - PMC - PubMed

MeSH terms