Review
. 2014;43(20):7132-70.
doi: 10.1039/c4cs00086b.

Structural and functional photoacoustic molecular tomography aided by emerging contrast agents

Affiliations
Review

Structural and functional photoacoustic molecular tomography aided by emerging contrast agents

Liming Nie et al. Chem Soc Rev. 2014.

Abstract

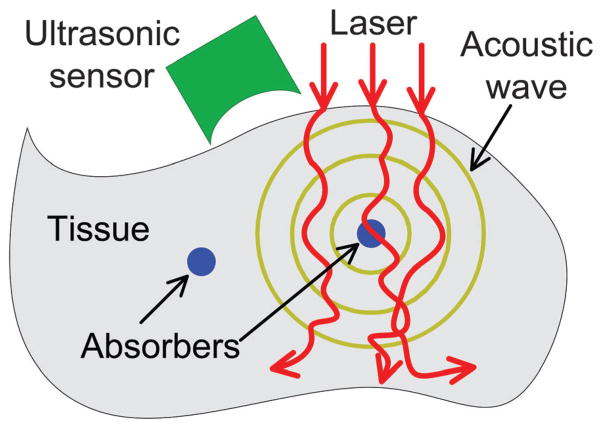
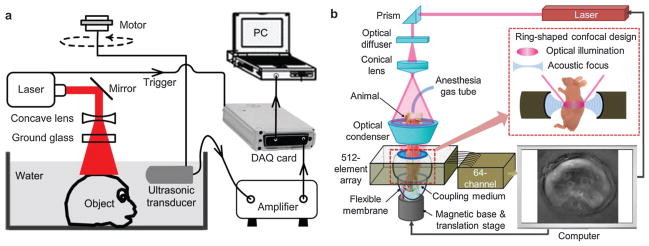
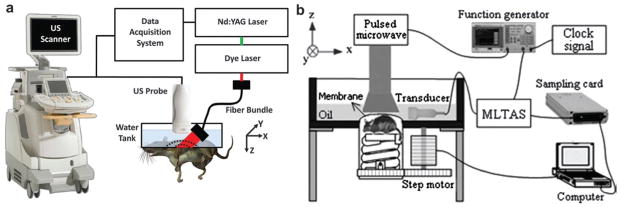
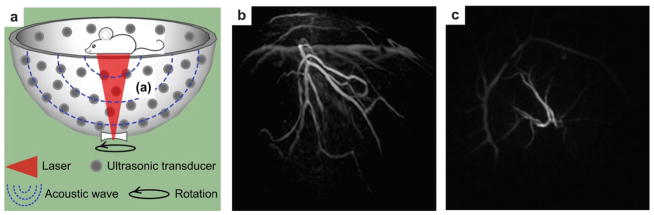
Photoacoustic tomography (PAT) can offer structural, functional and molecular contrasts at scalable observation level. By ultrasonically overcoming the strong optical scattering, this imaging technology can reach centimeters penetration depth while retaining high spatial resolution in biological tissue. Recent extensive research has been focused on developing new contrast agents to improve the imaging sensitivity, specificity and efficiency. These emerging materials have substantially accelerated PAT applications in signal sensing, functional imaging, biomarker labeling and therapy monitoring etc. Here, the potentials of different optical probes as PAT contrast agents were elucidated. We first describe the instrumental embodiments and the measured functional parameters, then focus on emerging contrast agent-based PAT applications, and finally discuss the challenges and prospects.


Figures

Fig. 1
Fig. 1
Schematic illustration of laser-induced PA effect in biological tissue.
Fig. 2
Fig. 2
(a) Circular scanning PAT using single ultrasonic transducer. (b) 512-element full-ring PAT system.
Fig. 3
Fig. 3
(a) Modified B-mode US scanner for dual PAT/US imaging of SLN. (b) Experimental setup of TAT system adapted from a commercial US imaging system.
Fig. 4
Fig. 4
(a) Schematic of 128-element hemisphere array-based PAT. The pulsed laser beam was expanded by a concave lens at the bottom of the imaging bowl, and then irradiated on the object. 128 single transducers were spirally located on the hemispherical surface to collect PA signals. (b) Lateral MIP image of a human breast using hemisphere array PAT. (c) Anterior–posterior MIP image of the human breast using hemisphere array PAT. Image area: ~9 × 9 cm2.
Fig. 5
Fig. 5
Schematic illustration of an AR–PAM system. The optical illumination and ultrasonic detection are in a coaxial confocal configuration for high sensitivity imaging.
Fig. 6
Fig. 6
Schematic illustration of OR–PAM for small capillary imaging.
Fig. 7
Fig. 7
OR–PAM of blood vessels in a living mouse ear with a zoomed region showing capillary structure and individual RBCs moving in a single capillary.
Fig. 8
Fig. 8
Schematic of Fabry–Pérot interferometer used for PAM imaging.
Fig. 9
Fig. 9
Oxygen partial pressure measurement by PA lifetime detection with phosphorescent oxygen sensitive dye.
Fig. 10
Fig. 10
(a) A typical sO2 mapping of a mouse brain cortex through a small craniotomy. Scale bar = 200 μm. (b) Blood glucose levels by glucose meter acquired every 10 min after insulin injection. (c–g) MRO2, CHb, sO2, ∇sO2 and v calculated from single-RBC PA images.
Fig. 11
Fig. 11
GNRs as optical contrast agents for PAT. (a) TEM of GNR with aspect ratio of 3 : 1. (b) PA images of GNR on A, MDA-435S tumor (positive control) B, 2008 C, HEY, and D, SKOV3 ovarian tumor models before (upper panel) and after (lower panel) tail-vein injection of 200 μL of 5.4 nM GNR.
Fig. 12
Fig. 12
Mechanism schematic of the silica coating to the PA signal effect of (a) a bare GNR, (b) a thin silica shell coating GNR, and (c) a very thick silica shell coating GNR.
Fig. 13
Fig. 13
(a) TEM of gold GNCs at size of ~35 nm. (b) Schematic illustrating GNC covered by smart polymers activatable by laser irradiation. Upon exposure to laser, the light is absorbed by GNC and converted into heat, stimulating smart polymer collapse and release of the preloaded drug.
Fig. 14
Fig. 14
PA imaging of B16 melanoma after tail-vein injection of 100 μL GNC solution with a concentration of 10 nM. Pseudo-red denotes blood vessels while pseudo-yellow denotes the melanoma in PA amplitude. (a) MIP PA images of B16 melanomas using [Nle, D-Phe]-α-melanocyte-stimulating hormone conjugated GNCs. (b) MIP PA images of B16 melanomas using only PEG–GNC.
Fig. 15
Fig. 15
GNSs as contrast agents for PA angiography and PTT. (a) TEM of GNSs. (b) Schematic illustration of the RGD–GNS targeting integrin αvβ3 on endothelial cells of neovessels in the tumor. (c) PA angiography monitoring of therapy response of PTT by RGD–GNS and laser irradiation. (d) PA angiography monitoring of tumor therapy response by only laser irradiation.
Fig. 16
Fig. 16
PAT of a rat brain aided by GNSh. MF: median fissure. PAT of rat brain acquired, (a) before, (b) 20 min after the administrations of nanoshells. (c) Differential image that was obtained by subtracting the pre-injection image from the post-injection image. (d) Open skull photograph of the rat brain cortex obtained after the data acquisition for PAT. (e) The averaged PA signals at different time points.
Fig. 17
Fig. 17
Photosensitizer (Ce6)-loaded plasmonic gold vesicles (GVs) for trimodality fluorescence/thermal/photoacoustic imaging guided synergistic photo-thermal/photodynamic cancer therapy.
Fig. 18
Fig. 18
(a) In vivo thermal images of MDA-MB-435 tumor-bearing mice receiving 808 nm laser irradiation for 5 min after the injection of PBS or GNVs. (b) In vivo 2D and 3D PA/US images of tumor before and after the injection of GNV. Obvious PA signal enhancement was observed in the tumor. Arrows indicate the location of GNV accumulation.
Fig. 19
Fig. 19
Gold nanotripods as contrast agents for PAT. (a) Schematic illustrating the structure of Au nanotripods. (b) TEM image of Au nanotripods. (c) The coronal, sagittal and transverse views of PA and US images of nude mice bearing U87MG tumors were obtained before and 1, 2 and 4 h after iv injection of RGD–Au-tripod (2 mg kg−1 of mouse body weight).
Fig. 20
Fig. 20
(a) TEM image of plasmonic pentacle Au–Cu alloy NPs. (b) Photothermal effect of the Au–Cu alloy pentacles. The temperature plot over time was recorded upon irradiation by a 808 nm CW laser (1 W cm−2).
Fig. 21
Fig. 21
(a) Silver nanosystem platform for imaging contrast, drug release and image-guided therapy. (b) TEM of synthesized silver nanoplates for PAT. Scar bar = 100 nm.
Fig. 22
Fig. 22
(a) US imaging of an orthotopic pancreatic tumor in a nude mouse model. (b) PAT of the pancreatic tumor using antibody conjugated Ag nanoplates (yellow), oxygenated blood (red) and deoxygenated blood (blue). Both image sizes are 14.5 mm by 11.8 mm.
Fig. 23
Fig. 23
(a) Quantum dots used for both photothermal and PA detection. (b) Photothermal image from QDs obtained with a single laser pulse at 560 nm with a low laser fluence of 0.6 J cm−2.144 (c) Photothermal image from QDs obtained with a single laser pulse at 560 nm with a high laser fluence of 3.5 J cm−2.144
Fig. 24
Fig. 24
Schematic illustration of CuS–pepitide–BHQ3 as PAT probe for in vivo MMPs detection. In this detection strategy, BHQ3 is conjugated to CuS NPs by a MMP-cleavable peptide linker, which could be dissociated by MMPs in the tumor environment.
Fig. 25
Fig. 25
(a) PAT of a mouse brain at a wavelength of 532 nm without CuS injection. PAT of the mouse brain at 1064 nm (b) 24 h and (c) 7 days after intracranial injection of CuS NPs solution. (d) Photograph of the imaged area of mouse head. Laser light irradiated from the top.
Fig. 26
Fig. 26
(a) Extinction spectrum of a commercial SPIO (Endorem®) solution. (b) PAT and MRI images of excised rat lymph nodes with SPIO injection.
Fig. 27
Fig. 27
Photostability comparison between GNRs and PNSs. (a) Absorption spectra of GNRs before, 5, 10 and 15 min after pulse laser irradiation (left). TEM images of the GNRs before (middle image) and 5 min after (right image) pulsed laser irradiation. (b) Absorption spectra of PNS before and 10 min after laser irradiation (left). TEM images of the PNS before (middle image) and 5 min after (right image) pulsed laser irradiation.
Fig. 28
Fig. 28
PAT and US images of SCC7 tumors on two mice groups acquired at 0, 2, 4, 6, 8 and 24 h after injection of 200 mL of either (a) PBS or (b) 0.8 mg mL−1 PNS, respectively. PAT image is overlapped with US image. Scale bar = 5 mm.
Fig. 29
Fig. 29
(a) Schematic illustrating SWNTs conjugated with RGD peptides for targeted PAT of mouse tumor. (b) B-scan US and PA images of U87MG tumor acquired along a white dotted line aided by SWNTs. The US images (gray) show the skin and tumor boundaries, while PAT images (green) show optical absorption (SWNT–RGD) in the tumor. Differential images were obtained by subtraction of the pre-injection image from the 4 h post-injection image.
Fig. 30
Fig. 30
(a) Schematics of gold coated single wall carbon nanotube for both PAT and PTT in mice. (b) Schematic of endothelial LYVE-1 targeting receptors with antibody–gold nanotube NPs and PA signal (top right) and photothermal (bottom right) signal.
Fig. 31
Fig. 31
(a) Schematic structure of GO loaded HHPH for highly efficient drug delivery. (b) US and PAT of 4T1 tumor-bearing mice before and 24 h after exposure to a 671 nm laser (75 mW cm−2, 20 min). (c) Quantitative oxygen saturation obtained by PAT in the tumor after PDT treatment.
Fig. 32
Fig. 32
SPN as activatable contrast agent for PA detection of ROS. (a) Molecular structures of SP1 and SP2 used for functional SPN preparation. (b) PA ratiometric detection mechanism of ROS at two different wavelengths.
Fig. 33
Fig. 33
In vivo PA detection of ROS generation from a mouse model of acute oedema by SPN. (a) PA/US overlaid images of saline-treated and (b) zymosan-treated regions in the thigh of living mice (n = 3 in each group) at different time points.
Fig. 34
Fig. 34
PPy NPs as contrast agent for in vivo PAT of mouse brain. (a) Molecular structure of PPy. (b) UV-vis-NIR extinction spectrum of PPy at a concentration of 50 mg mL−1. PAT of a mouse brain in vivo using PPy NPs acquired (c) before, (d) 5 min after, and (e) 60 min after the iv injection of PPy NPs. (f) Photograph of the mouse brain before PAT experiment. (g and h) Differential images obtained by subtracting the pre-injection image from the post-injection images (5 and 60 min).
Fig. 35
Fig. 35
Porphysome nanovesicles assembled as optically active contrast agents. (a) Schematic illustration of a pyropheophorbide–lipid porphysome. The phospholipid headgroup and porphyrin were marked in red and blue, respectively. (b) TEM images of negatively stained porphysomes (5% PEG–lipid, 95% pyropheophorbide–lipid).
Fig. 36
Fig. 36
Porphysomes as contrast agents for PAT of lymph node. (a) Photothermal property of porphysomes compared with liposomes and GNRs. (b) PA signal ratio of porphysomes and methylene blue with and without detergent. (c) PA images of tubes filled with porphysomes and PBS measured with and without detergent. (d) PAM images of lymph node using porphysomes on rats before and after intradermal injection of porphysomes (2.3 pmol). Scale bar = 5 mm.
Fig. 37
Fig. 37
(a) Cryogenic TEM image of PFC nanodroplet containing GNRs. Scale bar = 100 nm. (b) Step-by-step diagram illustrating PA and US signal enhancement by PFCnDs attributed to the vaporization phenomenon.
Fig. 38
Fig. 38
In vivo PA signal enhancement in mouse pancreas by PFCnDs (upper panel) and GNRs (lower panel). (a) PA signal change corresponding to the injected PFCnDs in the pancreas indicated by dashed area in (b) and (c). (b, c) Overlapped US and PA images generated from the rapid phase transition of the PFCnDs and expelled GNRs, respectively. (d) PA signal change corresponding to the injected GNRs in the pancreas indicated by dashed area in (e) and (f). The green circles represent the PA signal of the endogenous absorbers while blue circles represent the PA signal from the thermal expansion caused by both the endogenous absorbers and the GNRs. (e, f) Overlapped PA and US images of mouse tissue injected by GNRs immediately after the laser was turned on and at the end of the laser stimulation. Each image size is 12.2 × 10.8 mm2.
Fig. 39
Fig. 39
(a) Molecular structure of ICG. (b) Control PAT image obtained before ICG injection in the axillary region. (c) PAT image obtained 0.2 h after injection in the same region. SLN and lymphatic vessels are clearly visible. (d) 3D PAT image of SLN 0.7 h after injection.
Fig. 40
Fig. 40
In vivo PA imaging of SLN in a rat with MB injection. (a) Molecular structure of MB. (b) Photograph of the imaging area with skin removed after experiments. (c) Control PA image without MB injection. (d) PA image 52 min after MB injection.
Fig. 41
Fig. 41
PAM of capillaries on a mouse ear enhanced by EB. PA image before dye injection acquired at (a) 570 nm and at (b) 610 nm. (c) PA image acquired at 610 nm right after EB (6%, 0.2 mL) injection. (d) PA image acquired at 610 nm 30 min after injection. Transmission microscopic images of the image area (e) before and (f) after EB injection. Arrows in (d), (e) and (f) indicate sebaceous glands.
Fig. 42
Fig. 42
PAT of eGFP distribution in Drosophila melanogaster pupa. PAT images acquired at (a) 488 nm, (b) 498 nm and (c) 508 nm, respectively. (d) Spectrally resolved PAT image of eGFP distribution in an intact pupa. (e) Corresponding histology of DAPI-stained pupa at the same imaging plane (green color corresponds to GFP-expressing salivary glands). (f) Extinction spectra of eGFP (red with absorption peak at 488 nm) along with measured absorption of pupa case (blue) and fat areas (green). (g) Imaging plane of the pupa. (h) Overlaid image of the image at 508 nm (c) and the spectrally resolved image (d).
Fig. 43
Fig. 43
PAT of LacZ reporter gene expression using chromogenic X-gal probe. (a) Staining of X-Gal catalyzed by β-galactosidase for PAT detection. (b) Photograph showing the chromogenic change after addition of X-gal solution into the native lysate of 9 L per lacZ cells.

Similar articles

Cited by

References

    1. Mirza RG, Johnson MW, Jampol LM. Surv Ophthalmol. 2007;52:397–421. - PubMed
    1. Mennella V, Keszthelyi B, McDonald K, Chhun B, Kan F, Rogers G, Huang B, Agard D. Nat Cell Biol. 2012;14:1159–1168. - PMC - PubMed
    1. Juskaitis R, Wilson T, Neil MA, Kozubek M. Nature. 1996;383:804–806. - PubMed
    1. Rice WL, Kaplan DL, Georgakoudi I. PLoS One. 2010;5:e10075. - PMC - PubMed
    1. Habermehl C, Schmitz CH, Steinbrink J. Opt Express. 2011;19:18636–18644. - PMC - PubMed

Publication types