. 2014 Jun 26;10(6):e1004220.
doi: 10.1371/journal.ppat.1004220. eCollection 2014 Jun.

Defining immune engagement thresholds for in vivo control of virus-driven lymphoproliferation

Affiliations

Defining immune engagement thresholds for in vivo control of virus-driven lymphoproliferation

Cristina Godinho-Silva et al. PLoS Pathog. .

Abstract

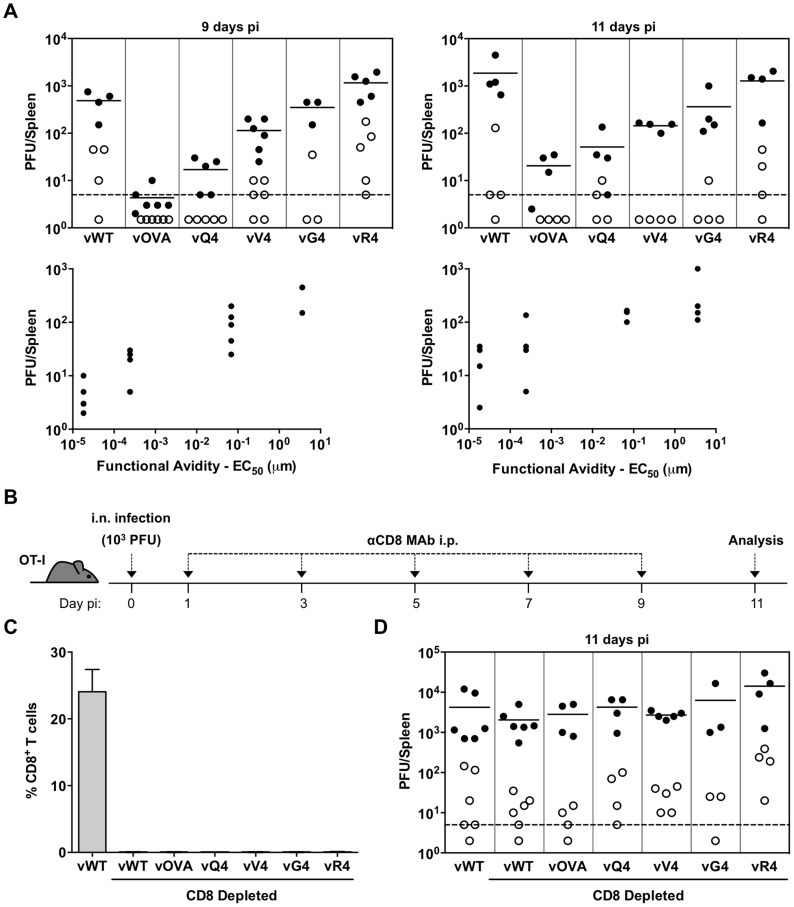
Persistent infections are subject to constant surveillance by CD8+ cytotoxic T cells (CTL). Their control should therefore depend on MHC class I-restricted epitope presentation. Many epitopes are described for γ-herpesviruses and form a basis for prospective immunotherapies and vaccines. However the quantitative requirements of in vivo immune control for epitope presentation and recognition remain poorly defined. We used Murid Herpesvirus-4 (MuHV-4) to determine for a latently expressed viral epitope how MHC class-I binding and CTL functional avidity impact on host colonization. Tracking MuHV-4 recombinants that differed only in epitope presentation, we found little latitude for sub-optimal MHC class I binding before immune control failed. By contrast, control remained effective across a wide range of T cell functional avidities. Thus, we could define critical engagement thresholds for the in vivo immune control of virus-driven B cell proliferation.


Conflict of interest statement

The authors have declared that no competing interests exist.

Figures

Figure 1
Figure 1. Characterization of APLs by MHC class I binding and TcR functional avidity, and generation of MuHV-4 recombinants expressing OVA or APLs linked to M2.
(A) Amino acid sequences used to generate MuHV-4 recombinants. Blue residues denote amino acid alterations introduced into native OVA. (B) Capacity of OVA and APL peptides to stabilize H2Kb on TAP deficient RMA/S cells. Half-maximum effective concentration (EC50) values were calculated from dose-response curves. The experiment was repeated 3 times. (C) Functional avidities of OT-I CTL for OVA and APL peptides were determined by IFNγ production. EC50 and APL/OVA EC50 ratios are shown. This experiment was repeated in duplicates 4 times (D) PCR analysis of recombinant viral DNA to confirm genome integrity in the HinDIII-E region, with schematic representation of the MuHV-4 genome, amplicon genomic co-ordinates and predicted PCR product sizes. (E) Multi-step growth curves of viruses in BHK-21 (0.01 PFU/cell). Virus titres were determined by plaque assay. In vitro lytic replication kinetics of the recombinant viruses were not significant different from vWT (p>0.05, by ordinary one-way ANOVA followed by Dunnett's multiple comparisons test). (F) Virus replication in lungs of i.n. infected C57BL/6 (H2b) mice was quantified by plaque assay. No MuHV-4 recombinant showed a deficit relative to vWT (p>0.05, using ordinary one-way ANOVA followed by Tukey's multiple comparisons test). (G) Latent infection in spleens of BALB/c (H2d) mice was determined by explant co-culture assay (closed symbols) at 14 days post-infection. Pre-formed infectious virus were measured by plaque assay (open symbols). Latent loads of MuHV-4 recombinants expressing OVA or APLs were not significantly different to vWT (p>0.05, by ordinary one-way ANOVA followed by Dunnett's multiple comparisons test). In panels F and G each point shows the titre of 1 mouse, horizontal lines show arithmetic means and dashed horizontal lines indicate the detection limit of the assay.
Figure 2
Figure 2. MHC class I binding by a latency-associated epitope impairs host colonization.
C57BL/6 mice were infected i.n. with 104 PFU of the indicated viruses. (A) The latent load in spleens was determined by explant co-culture assay (closed symbols) and pre-formed infectious virus was quantified by plaque assay (open symbols). Each point shows the titre of 1 mouse, horizontal lines arithmetic means and dashed horizontal line limit of detection of assay. At day 14, vOVA, vQ4, vV4, vG4, vR4 and vE1 latent loads were significantly below vWT (p<0.05, by two-tailed unpaired t-test). vA8 latency loads were not significantly different from vWT (p = 0.07). (B–C) Reciprocal frequencies of viral DNA+ cells in (B) total splenocytes or (C) GC B cells. Bars represent the frequency of viral DNA+ cells with 95% confidence intervals. (D) Representative spleen sections showing dark stained latently infected cells by in situ hybridization. (E) % tetramer positive CD8+ T cells at each time point from spleens (arithmetic mean +/− SEM of 3 independent assays). * p<0.05, ** p<0.01, **** p<0.0001; using a two-tailed unpaired t-test. (F) Functional capacity of splenic CTL determined by intracellular interferon-gamma staining after ex vivo stimulation. Data show % CD8+ T cells responding to each peptide (arithmetic mean +/− SEM of 3 independent assays). * p<0.05, ** p<0.01; using a two-tailed unpaired t-test. (G–H) In vivo CTL activity at 11 days post-infection. (G) At day 10 post-infection 50∶50 mixes consisting of 2×10⁶ unpulsed CD45.1+ CFSElo splenocytes and 2×10⁶ OVA-, E1- or A8-pulsed CD45.1+ CFSEhi splenocytes were transferred intravenously into vOVA, vE1 or vA8 infected C57BL/6 mice. The same mix of cells was transferred into vWT infected mice C57BL/6 as internal control. In the next day, the proportion of CFSEhi and CFSElo cells among CD45.1+ cells recovered from the spleen was analysed by FACS. Representative FACS plots showing % of unpulsed CD45.1+ CFSElo and OVA-, E1, or A8-pulsed CD45.1+ CFSEhi splenocytes. (H) % target cell killing. Three to four mice were analyzed per group, and experiments repeated three times.
Figure 3
Figure 3. CTL functional avidity also determines infection control by latently expressed epitope recognition.
(A) OT-I mice were infected i.n. (103 PFU). Splenocytes were titrated for latent virus by explant co-culture (closed circles) and for pre-formed infectious virus by plaque assay (open circles). At 9 days vOVA, vQ4 and vV4 showed significantly less latent infection compared to vWT (vOVA p = 0.0014, vQ4 p = 0.004, vV4 p = 0.009; by Student's 2-tailed unpaired t-test). vG4 and vR4 latent infections were not significantly different to vWT (vG4 p = 0.46, vR4 p = 0.09). Graphs show the correlation between TcR functional avidity (determined in Figure 1C) and splenic latent load (day 9: p = 0.04, rs = 0.91; day 11 p = 0.05, rs = 0.90; according to Pearson's correlation). (B) CD8 T+ cells were depleted from i.n. infected OT-I mice by intraperitoneal injection of anti-CD8 monoclonal antibody (MAb). (B) Schematic diagram of the experimental setting. (C) Data show the percentage of CD8+ T cells of total splenocytes (arithmetic mean +/− SEM) in control (non-depleted) and depleted mice. (D) Spleens were titrated for latent (closed circles) and lytic (open circles) infection. Latent loads of the epitope recombinants were not significantly different to vWT latent loads in CD8-depleted mice (p>0.05; ordinary one-way ANOVA followed by Dunnett's multiple comparisons test). Data were reproduced in two independent experiments. Each point shows the titre of 1 mouse, horizontal lines arithmetic means and dashed lines the limit of detection of the assay.
Figure 4
Figure 4. vOVA infection of TCRα−/− mice reconstituted with CD4+/OT-I T cells elicits a strong OT-I response and suppression of splenic colonization.
CD4+ T cells from C57BL/6 lymph nodes and OT-I T cells from CD45.1 Rag-1−/− OT-I lymph nodes were intravenously transferred to TcRα−/− mice one day prior to infection with vOVA or vR4 (103 PFU). (A) Schematic diagram of the experimental setting. (B) Kinetics of in vivo OT-I CTL expansion in spleens of mice infected with vOVA (black bars) or vR4 (grey bars) determined by FACS staining of CD45.1+CD8α+ cells (arithmetic mean +/− SEM). (C) Latent infection in spleens was quantified by explant co-culture assay (closed circles) and pre-formed infectious virus by plaque assay (open circles). Each circle shows the titre of 1 mouse. Horizontal bars show arithmetic means. The dashed line shows the limit of detection of the assay.
Figure 5
Figure 5. Suboptimal CTL functional avidity still allows control of virus-driven lymphoproliferation.
Reconstituted TcRα−/− mice (described in Figure 4A). were i.n. infected. (A–D) At 16 days the frequency, phenotype and effector function of transferred OT-I T cells was analyzed by flow cytometry. (A) Representative FACS plots from individual animals show the frequency of OT-I (CD45.1+TcRβ+CD8α+) cells within total CD8+ T cells. vOVA, vQ4 and vV4 induced significant expansion of OT-I cells in comparison with vWT (p<0.0001, p<0.0001, p = 0.002, respectively; by ordinary one-way ANOVA followed by Tukey's multiple comparisons test). vWT, vG4 and vR4 did not significantly increase OT-I cell numbers (p>0.9). (B) The activation phenotype of OT-I cells was determined by staining he CD45.1+TcRβ+CD8α+ population for CD44 and CD62L. vOVA, vQ4 and vV4 induced significantly more OT-I cell activation than vWT (p<0.0001); vG4 and vR4 were not significantly different from vWT (p>0.9). (C–D) The effector function of OT-I cells was determined as % CD45.1+TcRβ+CD8α+ cells producing (C) IFN-γ and (D) granzyme B by intracellular cytokine staining following ex vivo stimulation with OVA or the corresponding APL peptide. Histograms show geometric mean fluorescence intensities of granzyme B staining relative to an antibody isotype control (shaded area). Representative FACS plots from individual animals (left panels) and compiled percentages (right panels) are shown. Each point shows 1 mouse; 4 mice were analyzed per group; the bars shows means. *** p<0.001, **** p<0.0001; using Student's 2-tailed unpaired t-test. (E) At 16 and 21 days, spleens were titrated for latent virus (closed circles) and infectious virus (open circles). Each circle shows the titre of 1 mouse and the horizontal bars show means. The dashed line shows the limit of detection of the assay. At 16 and 21 days vOVA, vQ4 and vV4 showed significantly lower latent loads than vWT (d16: vOVA p = 0.02, vQ4 p = 0.02, vV4 p = 0.03; d21: vOVA p = 0.004, vQ4 p = 0.006, vV4 p = 0.02; by ordinary one-way ANOVA and Dunnett's multiple comparisons test). Latent loads of vG4 and vR4 were not significantly different from vWT (d16: vG4 p = 0.4, vR4 p = 0.4; d21: vG4 p = 0.8, vR4 p = 1.0). (F–G) Reciprocal frequencies of viral DNA+ cells in (F) total splenocytes and (G) purified GC B cells. Bars show frequencies of viral DNA-positive cells with 95% confidence intervals.

Similar articles

Cited by

References

    1. Stevenson PG, Simas JP, Efstathiou S (2009) Immune control of mammalian gamma-herpesviruses: lessons from murid herpesvirus-4. J Gen Virol 90: 2317–2330. - PubMed
    1. Bollard CM, Rooney CM, Heslop HE (2012) T-cell therapy in the treatment of post-transplant lymphoproliferative disease. Nat Rev Clin Oncol 9: 510–519. - PMC - PubMed
    1. Thorley-Lawson DA (2001) Epstein-Barr virus: exploiting the immune system. Nat Rev Immunol 1: 75–82. - PubMed
    1. Simas JP, Efstathiou S (1998) Murine gammaherpesvirus 68: a model for the study of gammaherpesvirus pathogenesis. Trends Microbiol 6: 276–282. - PubMed
    1. Speck SH, Ganem D (2010) Viral latency and its regulation: lessons from the gamma-herpesviruses. Cell Host Microbe 8: 100–115. - PMC - PubMed

Publication types

MeSH terms

LinkOut - more resources