. 2014 Jun 26;9(6):e100943.
doi: 10.1371/journal.pone.0100943. eCollection 2014.

Arp2/3 inhibition induces amoeboid-like protrusions in MCF10A epithelial cells by reduced cytoskeletal-membrane coupling and focal adhesion assembly

Affiliations

Arp2/3 inhibition induces amoeboid-like protrusions in MCF10A epithelial cells by reduced cytoskeletal-membrane coupling and focal adhesion assembly

Yvonne Beckham et al. PLoS One. .

Abstract

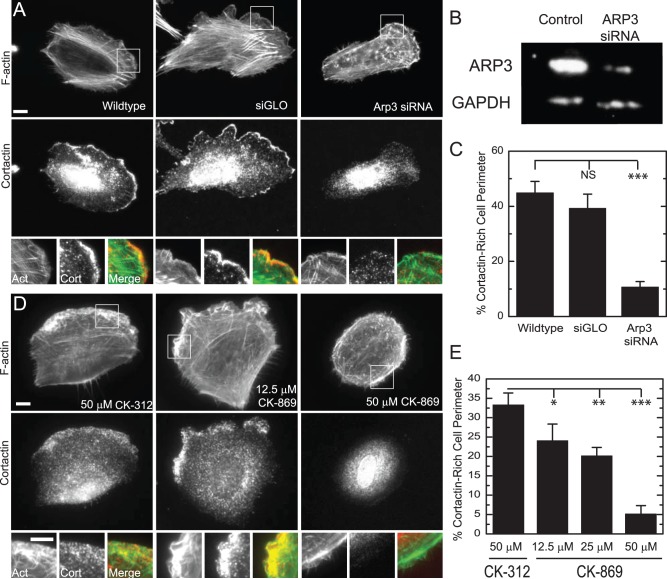
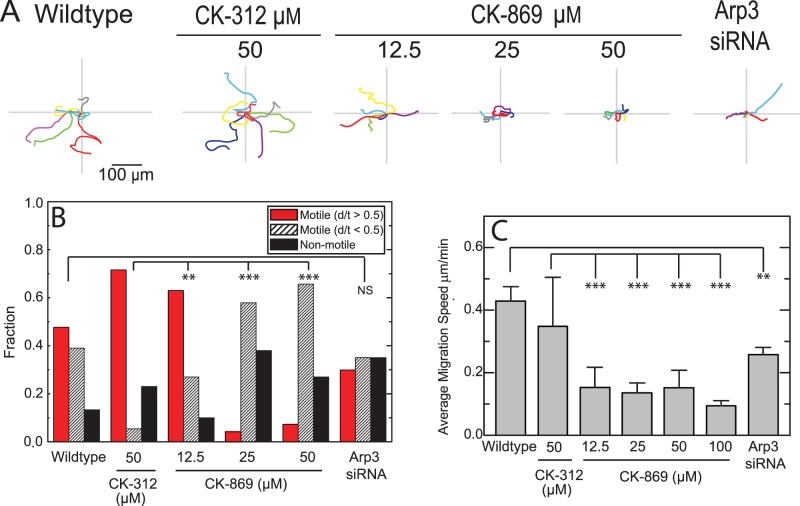
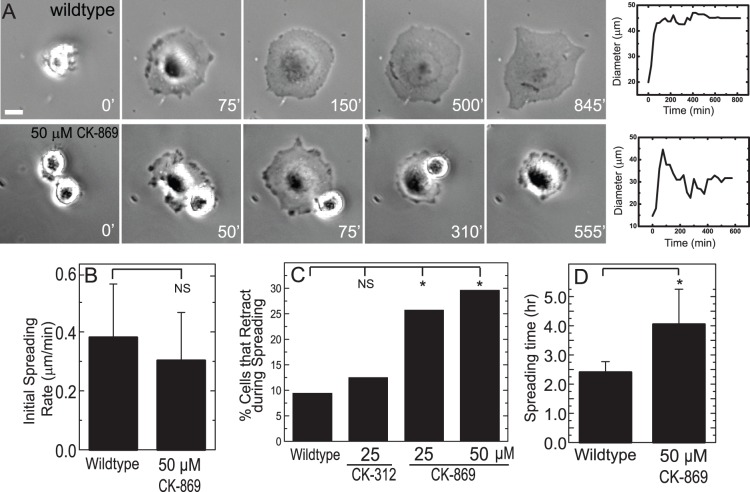
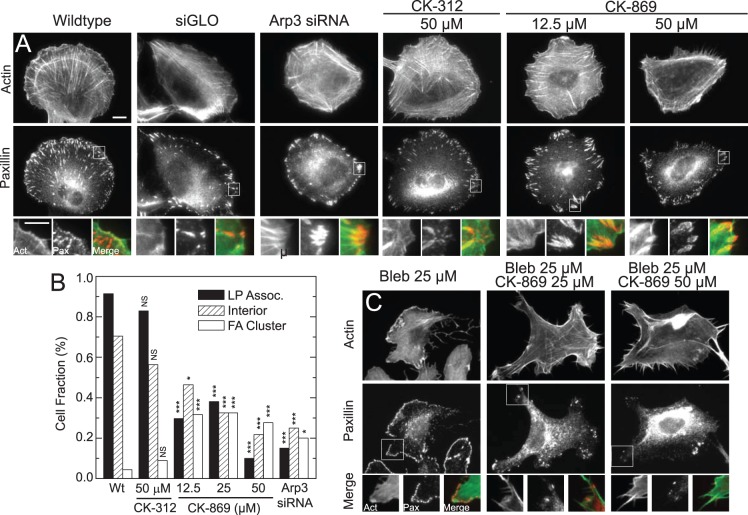
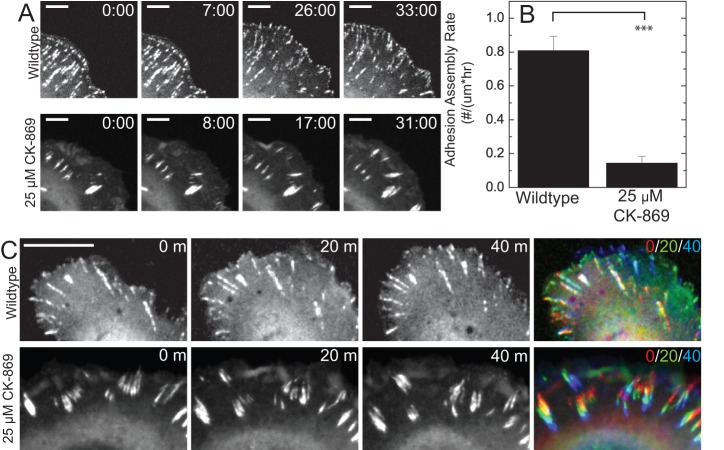
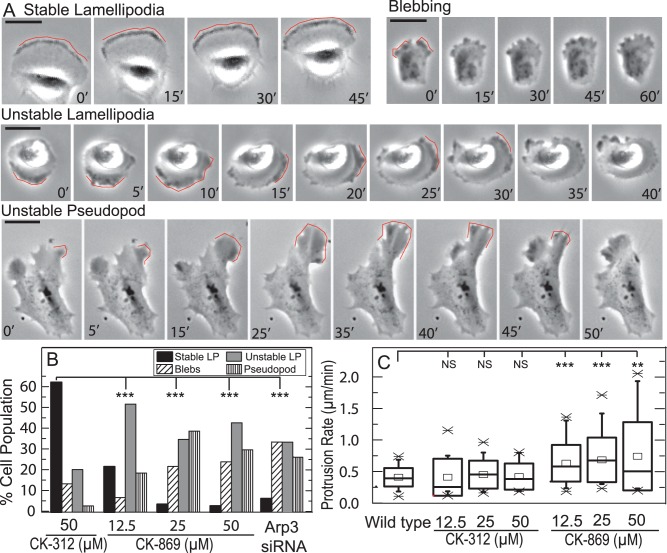
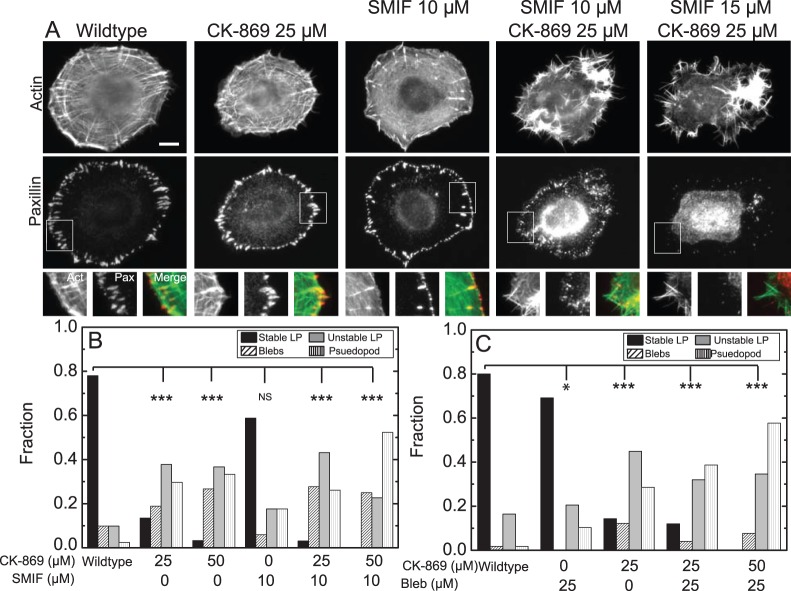
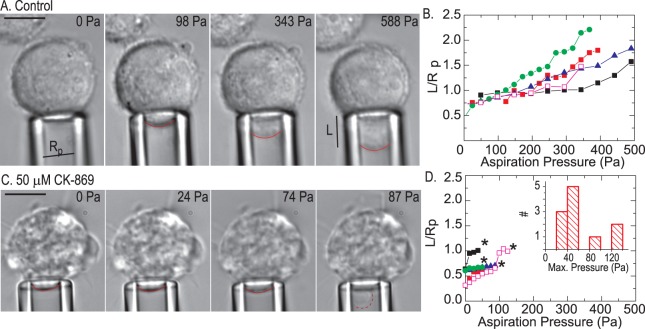
Here we demonstrate that Arp2/3 regulates a transition between mesenchymal and amoeboid protrusions in MCF10A epithelial cells. Using genetic and pharmacological means, we first show Arp2/3 inhibition impairs directed cell migration. Arp2/3 inhibition results in a dramatically impaired cell adhesion, causing deficient cell attachment and spreading to ECM as well as an 8-fold decrease in nascent adhesion assembly at the leading edge. While Arp2/3 does not play a significant role in myosin-dependent adhesion growth, mature focal adhesions undergo large scale movements against the ECM suggesting reduced coupling to the ECM. Cell edge protrusions occur at similar rates when Arp2/3 is inhibited but their morphology is dramatically altered. Persistent lamellipodia are abrogated and we observe a markedly increased incidence of blebbing and unstable pseuodopods. Micropipette-aspiration assays indicate that Arp2/3-inhibited cells have a weak coupling between the cell cortex and the plasma membrane, and suggest a potential mechanism for increased pseudopod and bleb formation. Pseudopods are not sensitive to reduced in formin or myosin II activity. Collectively, these results indicate that Arp2/3 is not necessary for rapid protrusion of the cell edge but plays a crucial role in assembling focal adhesions required for its stabilization.


Conflict of interest statement

Competing Interests: The authors have declared that no competing interests exist.

Figures

Figure 1
Figure 1. Cortactin-rich laµellipodium is eliminated in MCF10A cells treated with CK-869 or siRNA Arp3.
(A) Images of actin visualized by fluorescent phalloidin and cortactin immunofluorescence of MCF10A cells, MCF10A cells transfected with siGLO-red fluorescent oligo or with siGLO-red fluorescent and Arp3 siRNA oligos. Scale Bar = 10 µm. (B) Western Blot demonstrating that Arp3 siRNA knocked down Arp3 levels to less than 30% of wildtype levels. (C) Percentage of cell perimeter containing cortactin staining in MCF10A cells as in A (n = 20, 12 and 35 cells, respectively; error bars = SEM). (D) Images of actin visualized by fluorescent phalloidin and cortactin immunofluorescence in MCF10A cells treated with 50 µM of control compound CK-312 or 12.5 and 50 µM of the Arp2/3 inhibitor CK-869 for 4–10 hours. Scale bar = 10 µm. (E) Percentage of cell perimeter containing cortactin staining in MCF10A cells as in C (n = 10; error bars = SEM). NS, not significant; *, P<0.05; **, P<0.01; ***, P<0.001 with respect to WT or control.
Figure 2
Figure 2. Effect of the Arp 2/3 inhibitor CK-869 and Arp3 knockdown on migration of MCF 10A cells.
(A) Traces of 6 individual trajectories of MCF10A cells plotted after aligning their starting positions for wildtype cells and cells in 12.5, 25 and 50 µM of CK-869 or siRNA Arp3 cells. Scale bar is 100 µm. (B) Fraction of cells that are motile (move greater than 1 cell diameter over 10 hours) or non-motile (move less than 1 cell diameter over 10 hours). Motile cells are segregated into those that have a d/t (d is overall distance traveled; t is total path length) greater or less than 0.5 to identify persistent and non-persistent migration, respectively. (n = 22, 50, 50, 50, 50, 50 and 29 cells respectively).(C) Instantaneous migration speed for motile cells in same conditions described in A. (N = 19, 38, 45, 31, 36, 50 and 19 cells respectively). Error bars = SD. NS, not significant; **, P<0.01; ***, P<0.001 with respect to WT or control.
Figure 3
Figure 3. Arp2/3 inhibited cells show defects in spreading.
(A) Time series of untreated (wild type) cells or cells treated with 50 µM of CK-869; time indicated in minutes. Panels to the right show representative graph of spread area versus time for a cell in the cells presented in A. Scale bar = 10 µm (B) Rates of cell spreading in wildtype MCF10A cells or cells treated with 50 µM CK-869. Rates of spreading were calculated from the slopes of kymographs of the cell edge (n = 22 cells for wild type and 21 cells for CK-869). (C) Fraction of cells that retracted after reaching their maximum spread area. The ratio of the full spread area (FSA) to the smallest spread area (SSA) was calculated and if FSA/SSA >2, the cell was included as a retraction (n = 53 untreated cells, n = 64 for 50 µM control compound (CK-312) and n = 35 and 27 cells for 25 and 50 µM CK-869, respectively). (D) Bar graph of the time in hours to reach maximum spread area for untreated MCF10A cells or cells treated with 50 µM CK-869. NS, not significant; *, P<0.05 with respect to WT or control.
Figure 4
Figure 4. Arp2/3 inhibited cells show fewer nascent focal adhesions, fewer interior focal adhesions, and large focal adhesion clusters.
(A)Top panel consists of images of F-actin visualized by fluorescent phalloidin (top row) and paxillin immunofluorescence (middle row) and enlargements of regions of interest (bottom row) for wild type, siGlo cells, siRNA Arp3 and cells treated for four hours with inidicated concentrations of either control (CK-312) or Arp2/3 inhibitor (CK-869). (B) Plot of focal adhesion phenotypes as a function of inhibitor concentration or siRNA. Cells with lamellipodia-associated adhesions were cells with focal adhesions less than 0.3 µm2 found in lamellipodia. Cells with interior adhesions were cells with focal adhesions found at least 5 µm away from the cell edge. FA cluster are cells containing dense clusters of focal adhesions, as shown in inset of siArp3 and 12.5 µM CK-869 images. All focal adhesions in the cells were counted (n = 43, 32, 45, 38, 48, 19) NS, not significant; *, P<0.05; ***, P<0.001 with respect to WT or control. (C) Images stained as in (A) treated with 25 µM Blebbistatin and the indicated concentration of CK-869.
Figure 5
Figure 5. Arp2/3 inhibition impairs nascent adhesion assembly.
(A) Time-lapse images of paxillin visualized by expression of GFP-paxillin in normal cells and cells treated with 25 µM CK-869. Scale bar is 5 µm. Time indicated is min:sec (B) Plot of the adhesion assembly rate, measured as the number of new focal adhesions formed normalized by length of cell edge and total time of formation (n = 6 and 3 cells; error bars = SEM). ***, P<0.001 with respect to WT. (C) Time-lapse images of GFP-paxillin visualized by expression of GFP-paxillin in wildtype and 25 µM CK-869 cells. The color combined image represents the time series as a color progression from red to green to blue. Scale bar is 10 µm.
Figure 6
Figure 6. Protrusions observed in MCF10A cells at different concentrations of the Arp2/3 inhibitor, CK-869.
(A) Phase contrast images of the protrusion phenotypes observed. A broad lamellipodia that remains stable for ∼1 hr drives persistent migration in wild type cells (Stable LP). Small (1 µm) and dynamic blebs drive local protrusions in cell treated with 50 µM CK-869. Unstable, lamellipodia-like protrusions (Unstable LP) drive local protrusion in cell treated with 50 µM CK-869 over ∼10 min time periods. Protrusions are unstable and appear as a travelling wave along the cell periphery. Large pseudopodial protrusions rapidly extend ∼30 µm over ∼30 min but are unstable and retract shortly thereafter. Red line indicates protrusion of interest for each phenotype. Scale bar is 25 µm. (B) Percentage of cells exhibiting the protrusion phenotype described in A for untreated cells, cells treated with 12.5, 25 and 50 µM of CK-869, 50 µM CK-312 or cells transfected with Arp3 siRNA n = 39, 30, 24, 21 and 27 cells respectively, (C) Box plot of protrusion rate for untreated cells, cells treated with 12.5, 25 and 50 µM of CK 312, and cells treated with 12.5, 25 and 50 µM of CK-869 and imaged for 16 hours. Square  =  mean, X = 1% and 99% quantile. Box is median and SD. n = 39, 13, 14, 17, 30, 24 and 21 cells respectively; NS, not significant; **, P<0.01; ***, P<0.001 with respect to WT or control.
Figure 7
Figure 7. Myosin or Formin Inhibition does not abrogate pseudopodial protrusions in Arp2/3 inhibited cells.
(A) Images of F-actin visualized by fluorescent phalloidin (top row) and paxillin immunofluorescence (middle row) and enlargements of regions of interest (bottom row) indicated by square for wildtype MCF10A cells or cells treated with CK-869 and the formin inhibitor SMIFH2 at the indicated concentrations. (B) Fraction of MCF10A cells treated with indicated concentrations of CK-869 and SMIFH2 displaying the protrusion phenotypes as in Figure 6 (n = 41, 37, 30, 17, 65 and 44 cells respectively). Cells were treated for four hours prior to imaging. (C) Fraction of MCF10A cells treated with indicated concentrations of CK-869 and myosin ATPase inhibitor blebbistatin displaying the protrusion phenotypes as in Figure 6 (n = 55, 39, 49, 75, 26 cells respectively). Cells were treated with CK-869 for four hours prior to imaging and were treated with blebbistatin at the start of imaging. NS, not significant; *, P<0.05; ***, P<0.001 with respect to WT or control.
Figure 8
Figure 8. Arp 2/3 inhibition induces bleb formation at low external pressures.
(A) Phase contrast images of wildtype cells in a micro-pipette aspiration experiment as the aspiration pressure is increased from 0 Pa to 588 Pa. Aspiration pressure indicated in upper right. Scale bar is 3 µm. Cell contour within the micropipette indicated by red line. The pipette radius R and the length L of cell extended into the pipette are indicated in the images. (B) L/Rp as a function of aspiration pressure for wildtype cells; each data series reflects data (C) Phase contrast images of cells treated with the Arp inhibitor CK-869 in an aspiration experiment with cell contour within the pipette indicated. In the highest pressure (87 Pa), a bleb abruptly forms within the pipette, indicated by dashed red line. Scale bar is 3 µm. (D) L/Rp as a function of aspiration pressure for Arp inhibited cells. Note that bleb formation occurs at low pressures (stars), with a mean of 45 Pa. Inset, histogram of pressures at which blebs form.

References

    1. Chang C, Werb Z (2001) The many faces of metalloproteases: cell growth, invasion, angiogenesis and metastasis. Trends Cell Biol 11: S37–43. - PMC - PubMed
    1. Luster AD, Alon R, von Andrian UH (2005) Immune cell migration in inflammation: present and future therapeutic targets. Nature Imm 6: 1182–1190. - PubMed
    1. Parsons JT, Horwitz AR, Schwartz MA (2010) Cell adhesion: integrating cytoskeletal dynamics and cellular tension. Nat Rev Mol Cell Biol 11: 633–643. - PMC - PubMed
    1. Gardel ML, Schneider IC, Aratyn-Schaus Y, Waterman CM (2010) Mechanical Integration of Actin and Adhesion Dynamics in Cell Migration. Annu Rev Cell Dev Biol 26: 3.1–3.19. - PMC - PubMed
    1. Le Clainche C, Carlier M-F (2008) Regulation of Actin Assembly Associated With Protrusion and Adhesion in Cell Migration. Physiol Rev 88: 489–513. - PubMed

Publication types

MeSH terms

LinkOut - more resources