. 2014 Jun 26;9(6):e100896.
doi: 10.1371/journal.pone.0100896. eCollection 2014.

Glycerol-3-phosphate acyltranferase-2 behaves as a cancer testis gene and promotes growth and tumorigenicity of the breast cancer MDA-MB-231 cell line

Affiliations

Glycerol-3-phosphate acyltranferase-2 behaves as a cancer testis gene and promotes growth and tumorigenicity of the breast cancer MDA-MB-231 cell line

Magali Pellon-Maison et al. PLoS One. .

Abstract

The de novo synthesis of glycerolipids in mammalian cells begins with the acylation of glycerol-3-phosphate, catalyzed by glycerol-3-phosphate acyltransferase (GPAT). GPAT2 is a mitochondrial isoform primarily expressed in testis under physiological conditions. Because it is aberrantly expressed in multiple myeloma, it has been proposed as a novel cancer testis gene. Using a bioinformatics approach, we found that GPAT2 is highly expressed in melanoma, lung, prostate and breast cancer, and we validated GPAT2 expression at the protein level in breast cancer by immunohistochemistry. In this case GPAT2 expression correlated with a higher histological grade. 5-Aza-2' deoxycytidine treatment of human cells lines induced GPAT2 expression suggesting epigenetic regulation of gene expression. In order to evaluate the contribution of GPAT2 to the tumor phenotype, we silenced its expression in MDA-MB-231 cells. GPAT2 knockdown diminished cell proliferation, anchorage independent growth, migration and tumorigenicity, and increased staurosporine-induced apoptosis. In contrast, GPAT2 over-expression increased cell proliferation rate and resistance to staurosporine-induced apoptosis. To understand the functional role of GPAT2, we performed a co-expression analysis in mouse and human testis and found a significant association with semantic terms involved in cell cycle, DNA integrity maintenance, piRNA biogenesis and epigenetic regulation. Overall, these results indicate the GPAT2 would be directly associated with the control of cell proliferation. In conclusion, we confirm GPAT2 as a cancer testis gene and that its expression contributes to the tumor phenotype of MDA-MB-231 cells.


Conflict of interest statement

Competing Interests: The authors have declared that no competing interests exist.

Figures

Figure 1
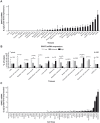
Figure 1. In silico analysis of GPAT2 mRNA expression profile.
A) In silico analysis of GPAT2 expression profile across human normal tissues. B) GPAT2 mRNA expression across different tumor localizations was assessed with a bioinformatics approach, and expression level was classified into low, moderate and high. The percentage of cases in each category (low: light gray, moderate: dark gray, high: black) is displayed in the graph **p<0.01. C) GPAT2 expression profile across human cancer cell lines.
Figure 2
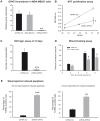
Figure 2. Phenotypic consequences of GPAT2 knock down in MDA-MB-231 cells.
A) Total RNA was extracted from the MDA-MB-231 parent cell line, shRNA-Scr and shRNA-GPAT2 cells, subjected to cDNA synthesis and amplified by quantitative RT-PCR using primers for human GPAT2 gene, normalizing its expression level to that of TBP and β-actin housekeeping genes **p<0.01. B) shRNA-Scr and shRNA-GPAT2 cells were seeded at 10,000 cells/well on MW12 plates and incubated for 24, 48, and 72 h before estimating the cell proliferation rate by MTT proliferation assay *p<0.05. C) 5,000 cells from shRNA-Scr and shRNA-GPAT2 cells were seeded on 35-mm DMEM-agar plates and the number of colonies was quantified by fluorescent microscope after 14 d incubation under normal culture conditions ***p<0.001. D) shRNA-Scr and shRNA-GPAT2 cells were grown to confluence on 10 mm plates and the cell monolayer was wounded six times. The wound width was measured at 0, 2, 6 and 8 h under 100× magnification and the percentage of wound closure was calculated *p<0.05. E) shRNA-Scr and shRNA-GPAT2 cells were treated with apoptosis inducer staurosporine for 30 min or 2 h and the percentage of apoptotic cells was determined by counting the number of apoptotic and non-apoptotic cells using TUNEL assay and haematoxylin staining **p<0.01; ***p<0.001.
Figure 3
Figure 3. GPAT2 knock down in HCT116 cells.
A) Total RNA was extracted from the HCT116 parent cell line, shRNA-Scr and shRNA-GPAT2 cells, subjected to cDNA synthesis and amplified by quantitative RT-PCR using primers for human GPAT2 gene, normalizing its expression level to that of TBP and β-actin housekeeping genes **p<0.01. B) shRNA-Scr and shRNA-GPAT2 cells were seeded at 5000 cells/well on MW12 plates and incubated for 24, 48, 72 and 96 h before estimating the cell proliferation rate by MTT proliferation assay ***p<0.001.
Figure 4
Figure 4. Phenotipic consequences of human and murine GPAT2 overexpression.
A) Total RNA from pCMV6 and pCMV6-GPAT2 cells was extracted, subjected to cDNA synthesis and amplified by quantitative RT-PCR using primers for human GPAT2 gene, normalizing its expression level to that of TBP and β-actin housekeeping genes *** p<0.001. B) pCMV6 and pCMV6-GPAT2 cells were seeded at 10,000 cells/well on MW12 plates and incubated for 24, and 48 h before estimating the cell proliferation rate by MTT proliferation assay ***p<0.001. C) pCMV6 and pCMV6-GPAT2 cells were seeded in coverslips and 24 h later apoptosis was induced by 1 µM staurosporine treatment for 2 and 5 h. The percentage of apoptotic cells was determined by counting the number of apoptotic and non-apoptotic cells using TUNEL assay and haematoxylin staining **p<0.01; ***p<0.001. D) pcDNA3.1 (empty vector) and the cDNA coding for mouse Gpat2 cloned in pcDNA3.1 (pcDNA3.1-Gpat2) were transiently transfected in HeLa, Vero and HEK293 cells. Cell density was estimated 48 h post-transfection by crystal violet assay. ***p<0.001.
Figure 5
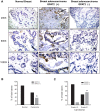
Figure 5. GPAT2 protein expression in human breast carcinomas.
GPAT2 protein expression in human breast tissues was assayed on a tissue microarray (TMA) by immunohistochemistry. A) Representative samples of normal breast (left panel), breast adenocarcinoma positive for GPAT2 stainning (GPAT2 (+)) (middle panel) and breast adenocarcinoma negative for GPAT2 staining (GPAT2(-)) (right panel) are displayed. GPAT2 expression was detected by peroxidase reaction (brown signal, arrows) and nuclei were counterstained with haematoxilin (blue stain). Magnification: 200×, 600× and 1000×. Statistical analysis of GPAT2 protein expression on the TMA: B) frequency of GPAT2 expression between normal breast and breast adenocarcinoma (carcinoma) and C) frequency of GPAT2 expression in adenocarcinoma (carcinoma) samples according to their histological grade (Nottingham scale).
Figure 6
Figure 6. Effect of DAC treatment on mRNA GPAT2 expression in human cell lines.
A) Relative mRNA expression of GPAT2 in human cell lines was assayed by quantitative RT-PCR. B) MCF7, HeLa, HEK-293 and MDA-MB-231 cells were treated with the methyltransferase inhibitor 5-aza-2′-deoxycitidyne 2 µM for 96 h (DAC) or with DMSO (control), and the mRNA relative expression of GPAT2 gene was assessed by quantitative RT-PCR. **p<0.01.
Figure 7
Figure 7. Gene ontology classification of genes co-expressed with GPAT2 in mouse and human testis.
Scatterplot graph of the top 300 GPAT2 co-expressed genes showing the representative functional clusters according to gene ontology terms with a statistical significance of p<0.01, in a two dimensional space related to gene ontology terms' semantic similarities. Bubble color indicates the p-value of gene ontology terms (expressed as Log10 p-value), where blue and green bubbles are gene ontology terms with more significant p-values than the orange and red bubbles. Bubble size indicates the frequency of the gene ontology term in the underlying gene ontology database.7

Similar articles

Cited by

References

    1. Bell RM, Coleman RA (1980) Enzymes of glycerolipid synthesis in eukaryotes. Annu Rev Biochem 49: 459–487. - PubMed
    1. Wendel AA, Lewin TM, Coleman RA (2009) Glycerol-3-phosphate acyltransferases: rate limiting enzymes of triacylglycerol biosynthesis. Biochim Biophys Acta 1791: 501–506. - PMC - PubMed
    1. Wang S, Lee DP, Gong N, Schwerbrock NM, Mashek DG, et al. (2007) Cloning and functional characterization of a novel mitochondrial N-ethylmaleimide-sensitive glycerol-3-phosphate acyltransferase (GPAT2). Arch Biochem Biophys 465: 347–358. - PMC - PubMed
    1. Cattaneo ER, Pellon-Maison M, Rabassa ME, Lacunza E, Coleman RA, et al. (2012) Glycerol-3-phosphate acyltransferase-2 is expressed in spermatic germ cells and incorporates arachidonic acid into triacylglycerols. PLoS One 7: e42986. - PMC - PubMed
    1. Shiromoto Y, Kuramochi-Miyagawa S, Daiba A, Chuma S, Katanaya A, et al. (2013) GPAT2, a mitochondrial outer membrane protein, in piRNA biogenesis in germline stem cells. RNA 19: 803–810. - PMC - PubMed

Publication types

MeSH terms