. 2014 Jun 26;10(6):e1004395.
doi: 10.1371/journal.pgen.1004395. eCollection 2014 Jun.

Reviving the dead: history and reactivation of an extinct l1

Affiliations

Reviving the dead: history and reactivation of an extinct l1

Lei Yang et al. PLoS Genet. .

Abstract

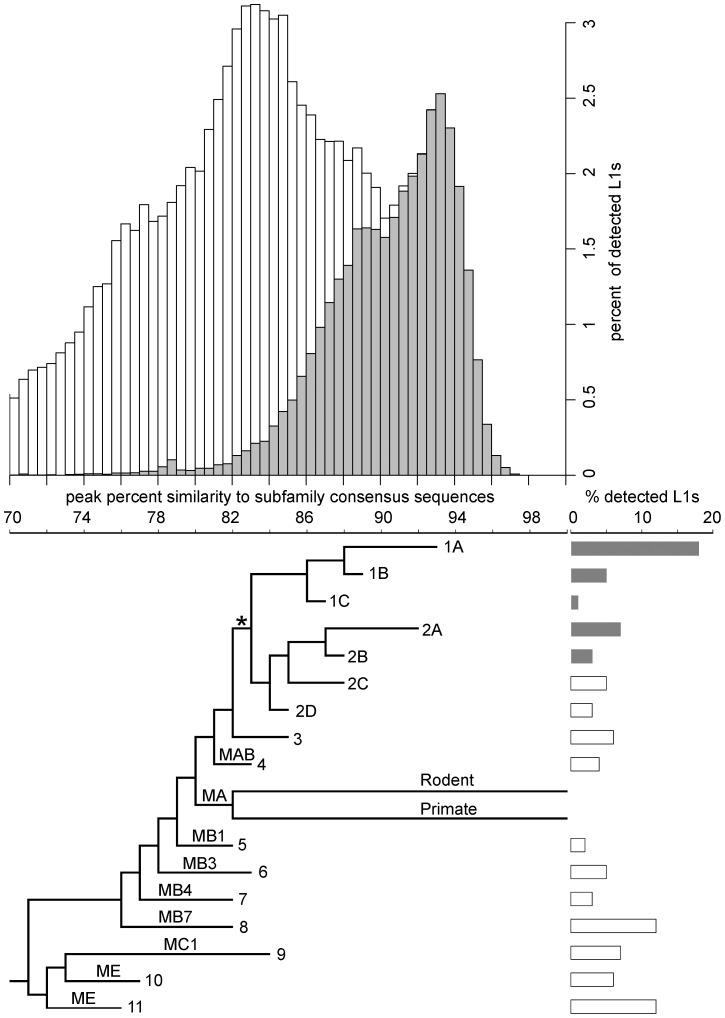
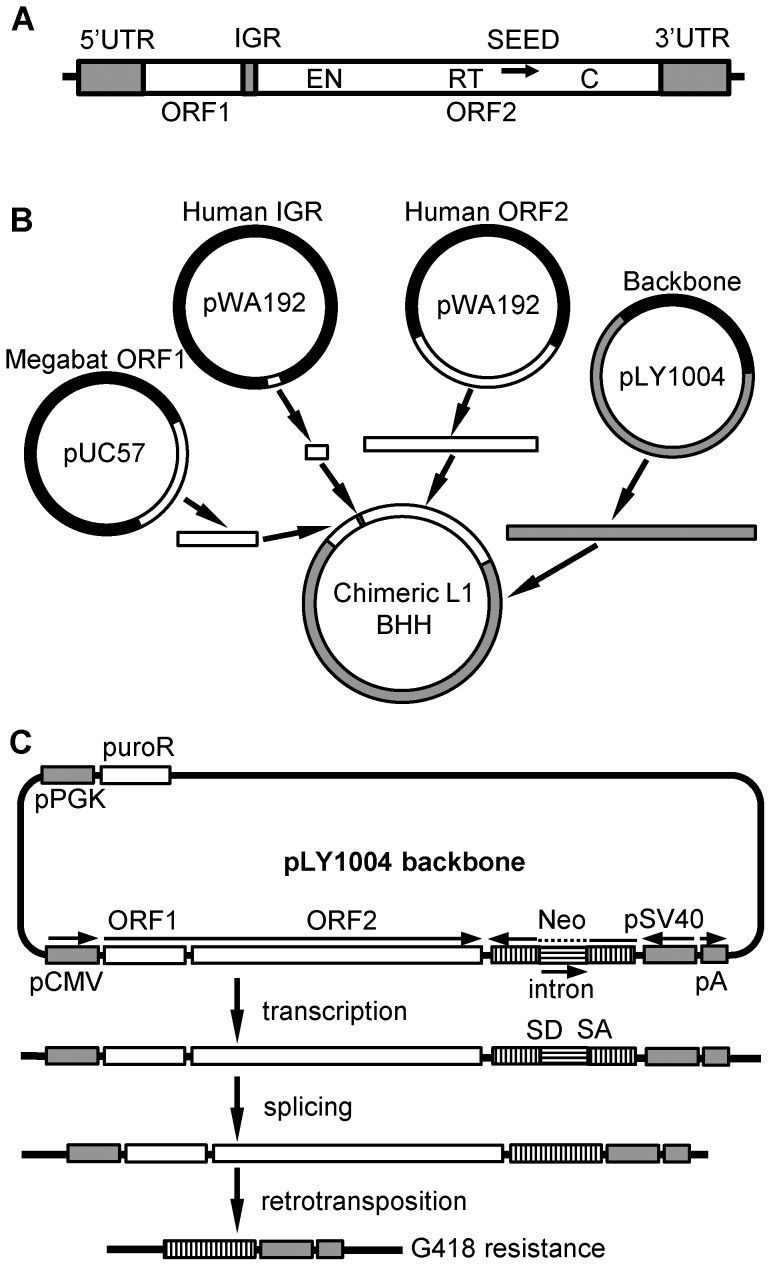
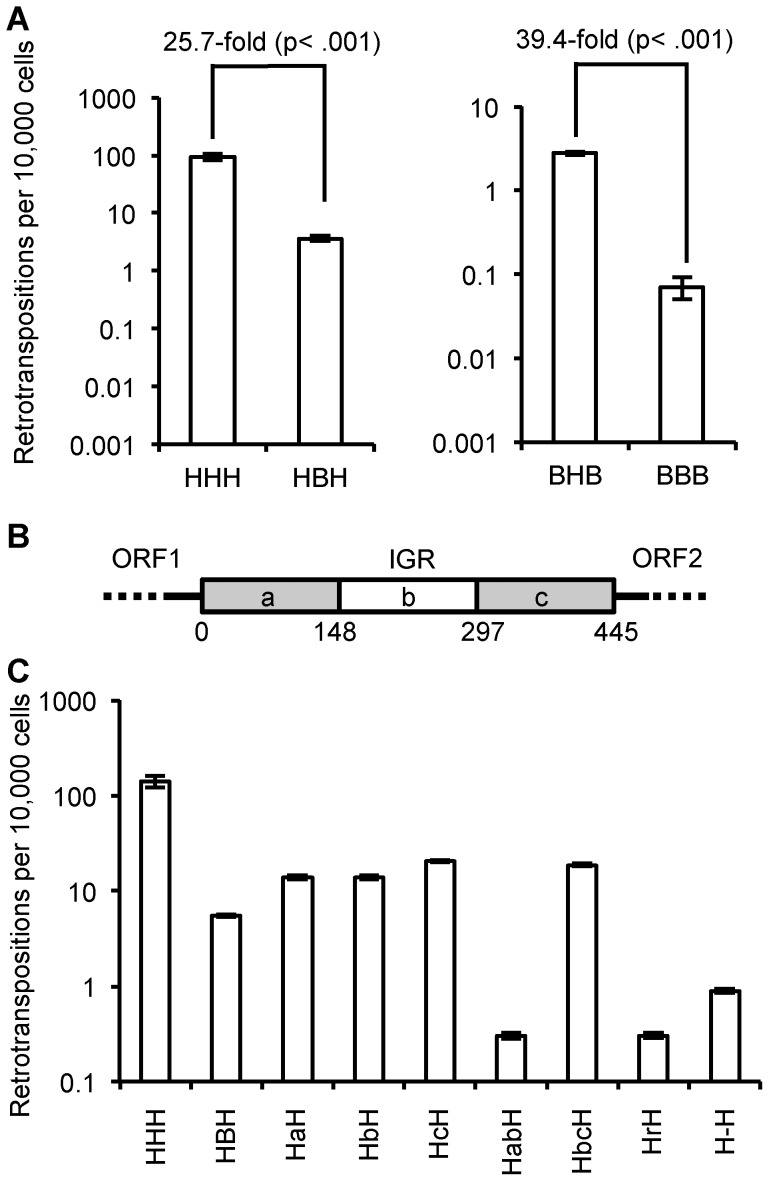
Although L1 sequences are present in the genomes of all placental mammals and marsupials examined to date, their activity was lost in the megabat family, Pteropodidae, ∼24 million years ago. To examine the characteristics of L1s prior to their extinction, we analyzed the evolutionary history of L1s in the genome of a megabat, Pteropus vampyrus, and found a pattern of periodic L1 expansion and quiescence. In contrast to the well-characterized L1s in human and mouse, megabat genomes have accommodated two or more simultaneously active L1 families throughout their evolutionary history, and major peaks of L1 deposition into the genome always involved multiple families. We compared the consensus sequences of the two major megabat L1 families at the time of their extinction to consensus L1s of a variety of mammalian species. Megabat L1s are comparable to the other mammalian L1s in terms of adenosine content and conserved amino acids in the open reading frames (ORFs). However, the intergenic region (IGR) of the reconstructed element from the more active family is dramatically longer than the IGR of well-characterized human and mouse L1s. We synthesized the reconstructed element from this L1 family and tested the ability of its components to support retrotransposition in a tissue culture assay. Both ORFs are capable of supporting retrotransposition, while the IGR is inhibitory to retrotransposition, especially when combined with either of the reconstructed ORFs. We dissected the inhibitory effect of the IGR by testing truncated and shuffled versions and found that length is a key factor, but not the only one affecting inhibition of retrotransposition. Although the IGR is inhibitory to retrotransposition, this inhibition does not account for the extinction of L1s in megabats. Overall, the evolution of the L1 sequence or the quiescence of L1 is unlikely the reason of L1 extinction.


Conflict of interest statement

The authors have no competing interests.

Figures

Figure 1
Figure 1. Age distribution and phylogeny of L1s in the megabat genome.
The histogram shows the age distribution of megabat L1s as percent of the total 79,978 L1s detected in the megabat genome. Grey bars indicate L1s that are bat-specific. Age of L1s is determined by their percent identity to the corresponding subfamily consensus in 0.5% windows on the horizontal axis – the higher the percent identity, the younger the subfamily. The horizontal axis is shared with the phylogenetic tree which shows the evolutionary history of L1 families. Taxa names are the numbers assigned to megabat L1 families; names on branches are those given to ancestral mammalian L1 families by Smit et al. . Divergence of the human- and rodent-specific L1s and their persistence to present time are indicated by labeled branches. The backbone of the tree is derived from the maximum likelihood tree of all megabat L1 subfamilies and ancestral mammalian L1 families shown in Figure S1, and the branch lengths of the tree were calibrated at the peak of retrotransposition of each family as described in Materials and Methods. * indicates the point after which bat-specific L1s (grey bars) diverged. Lengths of the bars to the right of each terminal branch indicate the percent of all detected L1s contributed by that family.
Figure 2
Figure 2. Persistence of concurrently active L1 families.
Concurrent L1 families are arranged vertically. Names of families are noted on the top-right corner of each panel. L1 ages are determined by their percent identity to the corresponding subfamily consensus in 0.5% windows – the higher the percent identity, the younger the element. L1 copy numbers are normalized as percent of total detected L1s. The retrotransposition peaks of concurrent families are marked with dashed-line boxes; smaller dashes indicate younger families.
Figure 3
Figure 3. Scheme for assembly of chimeric L1 constructs.
(A) Structure of a typical L1. UTR: untranslated region, ORF: open reading frame, IGR: intergenic region, EN: endonuclease motif, RT: reverse transcriptase motif, C: C-terminal domain, SEED: the region amplified by degenerate PCR (arrow) that served as the initial seed for reconstruction of the consensus sequence. (B) Chimeric L1 production. Human and megabat L1 segments were cloned separately into plasmids. L1 segments and the plasmid backbone with compatible overhangs were generated either by PCR or restriction enzyme digestion and joined together by a multi-way ligation. In this example ORF1 and the IGR are from megabat while ORF2 is from human (BBH). All eight combinations were produced in this manner. (C) Retrotransposition rate assay. The backbone of the constructs, linearized pLY1004, includes the puromycin resistance gene (puroR) driven by a constitutive promoter (pPGK), and an inverse neomycin resistance gene (neo) close to the cloning site for the L1. Puromycin resistance selects for cells that have acquired a L1 construct. Subsequently, neomycin resistance selects for cells that hosted retrotransposition events as follows. Transcription and subsequent retrotransposition of the cloned L1, driven by a pCMV promoter, trigger the splicing between donor (SD) and acceptor (SA) sites, activating the inverse-oriented neo cassette which is driven by an SV40 promoter. Thus, a cell will give rise to a colony if it accommodated a retrotransposition event and, thus, excision of the intron in neo, allowing it to survive G418 selection.
Figure 4
Figure 4. Retrotransposition rate of chimeric L1s.
(A) Representative retrotransposition assay plates. Constructs are named with a three letter code based on the origin of their ORF1, IGR and ORF2: H for human L1rp; B for megabat lineage 1. An independent human L1 construct, pWA192 , was used as a positive control and an ORF1 mutant of L1rp that blocks retrotransposition was used as a negative control. The number of cells seeded for G418 selection follows the name; 10-fold more cells were used for the negative control and for constructs with low retrotransposition rates. (B) Comparison of retrotransposition rates (log scale). At least 12 plates were counted for each construct in three independent replicate assays.
Figure 5
Figure 5. Effect of IGR on retrotransposition rate.
(A) Heterologous IGRs: replacing the human L1 IGR with a megabat version reduces the retrotransposition rate ∼25.7-fold, while replacing the megabat IGR with a human L1rp IGR increases the retrotransposition ∼39.4-fold. (B) Schematic presentation of the manipulation of the reconstructed megabat L1 IGR: the IGR was truncated in one-thirds represented by ‘a’, ‘b’ and ‘c’, respectively. Numbers below the scheme indicate the coordinates of the split points of the truncations on the IGR. (C) Manipulated IGRs were tested in all chimeric L1 backgrounds and the results were qualitatively similar. Data are shown for replacement of the human L1rp IGR (HXH); data for the remaining L1 backgrounds are shown in Figure S3. At least four plates were counted per construct. Constructs are named by their composition of the ORFs and IGR. The first character represents the source of ORF1 and the last character represents the source of ORF2: ‘H’ indicates human and ‘B’ indicates megabat. The middle characters represent the manipulation of the IGR: ‘a’, ‘b’ and ‘c’ indicate the truncated IGR parts the construct contains as illustrated in (B) in the order they are present in the construct. For example, ‘HabH’ indicates a construct with human L1rp ORFs and the first two thirds of the truncated megabat L1 IGR. Other IGR manipulations are also abbreviated: ‘r’ indicates a shuffled version of the megabat IGR of the same length and nucleotide composition, and ‘-’ indicates the megabat IGR with all the AUG start codons (excluding the start at the beginning of ORF2) mutated to AGU.

Similar articles

Cited by

References

    1. Furano AV (2000) The biological properties and evolutionary dynamics of mammalian LINE-1 retrotransposons. Prog Nucleic Acid Res Mol Biol 64: 255–294. - PubMed
    1. Kulpa DA, Moran JV (2006) Cis-preferential LINE-1 reverse transcriptase activity in ribonucleoprotein particles. Nat Struct Mol Biol 13: 655–660. - PubMed
    1. Wei W, Gilbert N, Ooi SL, Lawler JF, Ostertag EM, et al. (2001) Human L1 retrotransposition: cis preference versus trans complementation. Mol Cell Biol 21: 1429–1439. - PMC - PubMed
    1. Alisch RS, Garcia-Perez JL, Muotri AR, Gage FH, Moran JV (2006) Unconventional translation of mammalian LINE-1 retrotransposons. Genes Dev 20: 210–224. - PMC - PubMed
    1. Li PW, Li J, Timmerman SL, Krushel LA, Martin SL (2006) The dicistronic RNA from the mouse LINE-1 retrotransposon contains an internal ribosome entry site upstream of each ORF: implications for retrotransposition. Nucleic Acids Res 34: 853–864. - PMC - PubMed

Publication types

Substances

LinkOut - more resources