. 2014 Jun 26;9(6):e98515.
doi: 10.1371/journal.pone.0098515. eCollection 2014.

FGFR2 is amplified in the NCI-H716 colorectal cancer cell line and is required for growth and survival

Affiliations

FGFR2 is amplified in the NCI-H716 colorectal cancer cell line and is required for growth and survival

Anjili Mathur et al. PLoS One. .

Abstract

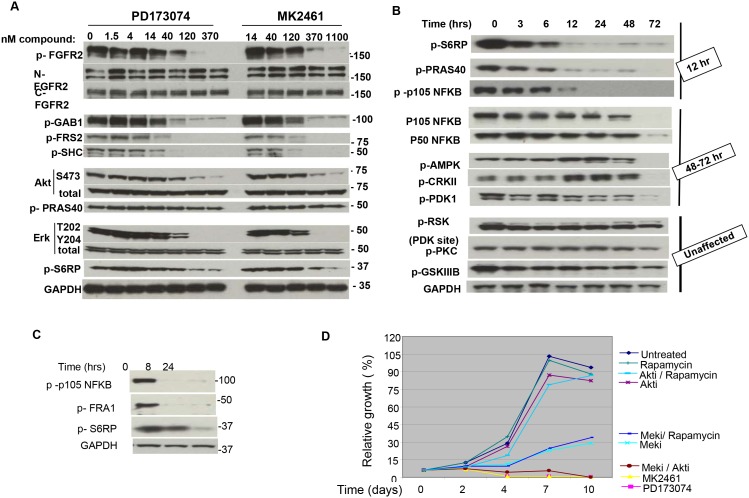
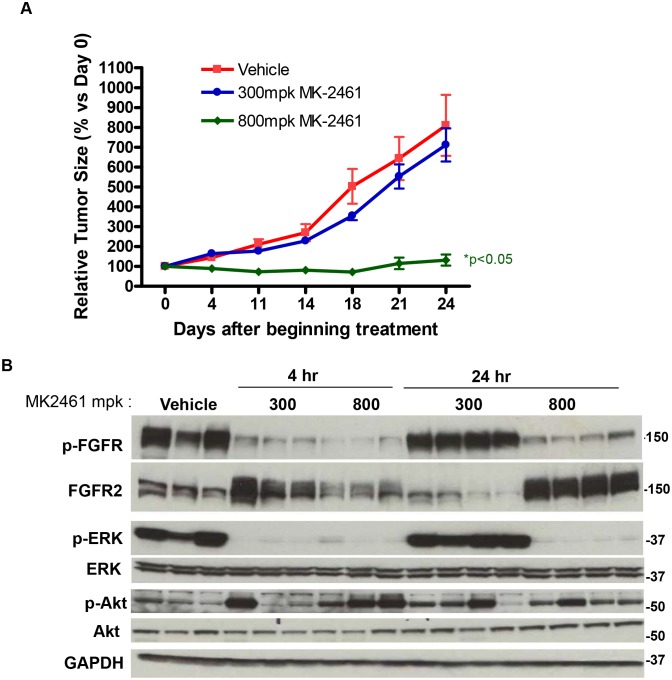
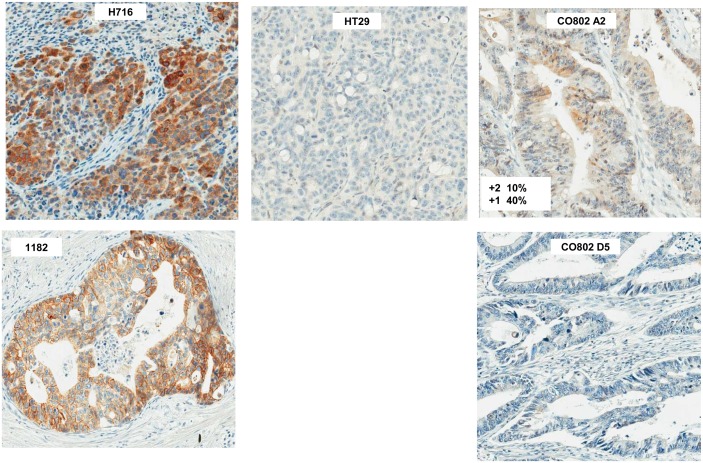
Aberrant kinase activation resulting from mutation, amplification, or translocation can drive growth and survival in a subset of human cancer. FGFR2 is amplified in breast and gastric cancer, and we report here the first characterization of FGFR2 gene amplification in colorectal cancer in the NCI-H716 colorectal cancer cell line. FGFR2 is highly expressed and activated in NCI-H716 cells, and FGFR selective small molecule inhibitors or FGFR2 shRNA strongly inhibited cell viability in vitro, indicating "addiction" of NCI-H716 cells to FGFR2. NCI-H716 growth in a xenograft model was also inhibited by an FGFR small molecule inhibitor. FGFR2 was required for activation of multiple downstream signaling proteins including AKT, ERK, S6RP and NFKB. Inhibition of downstream kinases such as AKT or ERK alone had modest effects on proliferation, whereas combined inhibition of AKT and ERK signaling resulted in a loss of viability similar to FGFR2 inhibition. We identified elevated FGFR2 expression in a small subset of primary colorectal cancer, however FGFR2 amplification was not observed. Although FGFR2 amplification is not common in primary colon cancer or lymph node and liver metastases, other subsets of colorectal cancer such as ascites, from which the NCI-H716 cell line was derived, have yet to be tested. These results suggest that emerging FGFR inhibitor therapeutics may have efficacy in a subset of colon cancer driven by FGFR2 amplification.


Conflict of interest statement

Competing Interests: Authors except AG are employees of Merck Research Labs. AM, CW, LD, BP, and BL have competing interests as employees of Merck, but declare that this affiliation does not alter their adherence to PLOS ONE policies on sharing data and materials. There are no restrictions on sharing of data and/or materials.

Figures

Figure 1
Figure 1. FGFR2 is amplified, overexpressed, and activated in NCI-H716 cells.
A. NCI-H716 cells were treated with colcemid (0.02 µg/ml for 3 hours), fixed with methanol/acetic acid, and dropped onto a microscope slide according to materials and methods. Bacterial artificial chromosome clone RP11-62L18 was labeled with Spectrum Orange dUTP and a centromere probe was labeled with Spectrum Green dUTP (Abbott Molecular Inc., Des Plaines, IL) and hybridized to fixed cells. Red indicates FGFR2 and green indicates Centromere. B. FGFR2 is overexpressed and contains high levels of tyrosine phosphorylation in the NCI-H716 cell line. A, Cell lysates (prepared according to Materials and Methods) from untreated or FGF2 treated (30 ng/ml, 5 minutes) cells were lysed and protein concentration was determined with BCA kit (Pierce Thermo Fisher Rockford Ill). Equal lysate amounts (50 ug) were subjected to SDS-PAGE and western blotting with FGFR2 antibodies made against the N terminus (H80. MAB6841), C terminus (C20) and activation loop phosphorylation Y653/654 (3471, p-FGFR2) and Actin.
Figure 2
Figure 2. FGFR2 is required for growth of NCI-H716 cells.
A. PD173074 and MK2461 inhibit FGFR2 phosphorylation. Cells were treated for 1 hour with a titration of PD173074 as described in Materials and methods. Lysates were prepared and 50 ug protein was subjected to SDS-PAGE and western blotting with phospho Y653/654 FGFR and MAB6841 total FGFR2 antibody. B. PD173074 and MK2461 inhibit NCI-H716 cell growth. Cell lines were plated at 4000 cells/well and incubated overnight. NCI-H716 cells were treated with a titration of PD173074 as described in Materials and Methods. Cell growth was measured with Vialight reagent, and growth was presented relative to untreated cells. C. PD173074 and MK2461 selectively inhibit growth of NCI-H716 cells. Colon cancer cell lines listed were plated at 4000 cells/well and 24 hours later were treated with a titration of compounds. 4 days later cell growth was measured with vialight and IC50s were calculated from graph pad prism. D. FGFR2 shRNA decreases FGFR2 protein in NCI-H716 cells. FGFR2 shRNA was prepared and NCI-H716 cells were infected as described in methods. Left, FGFR2 expression was analyzed with phospho Y653/654 and total protein with MAB6841. E. Growth was analyzed 5 days post infection with Vialight reagent.
Figure 3
Figure 3. FGFR2 activates multiple signaling pathways in NCI-H716 cells.
A. Lysates used in Fig. 2A were analyzed by western blotting for phosphorylated or total proteins after a 2 hour treatment with indicated compound titration. “p” indicates phosphoprotein, and the phosphorylation sites are listed in Methods. B. Time course of inhibition for multiple signaling proteins. NCI-H716 cells were treated with 100 nM PD173074 for the indicated times and signaling pathways were analyzed by SDS PAGE and western blotting. 100 nM PD173074 was selected because this amount caused full inhibition of pERK at the 2 hour time point. “p” indicates phosphoprotein, and the phosphorylation sites are listed in Methods. Terminology on the right side of figure groups proteins according to the time at which inhibition or protein loss occurs. C. NCI-H716 cells were treated with 100 nM PD0325901 for the indicated time. Lysates were prepared for SDS PAGE and western blotting with the indicated antibodies. D. NCI-H716 cells plated at 4,000 cells/well were treated 24 hours later with 1 uM L-547 (AKTi), 100 nM PD0325901 (MEKi), 5 nM Rapamycin (rapamycin), 100 nM PD173074, or 1.5 uM MK2461, or the indicated combinations. After 5 days compound and media were removed and replaced with fresh compound and media. After an additional 5 days (10 day total assay) relative cell growth was determined using Vialight reagent.
Figure 4
Figure 4. FGFR2 inhibition causes cell death in NCI-H716 cells.
A. Lysates from Figure 3B reveal increased PARP cleavage. Phospho S6RP is included as reference and GAPDH was used as a loading control. B. Cell cycle profile of treated cells. 1×10exp6 NCI-H716 cells were treated with 100 nM PD173074, MEK inhibitor (100 nM) or MEK + AKT inhibitor (L-547, 1 uM) or DMSO (untreated) were isolated at the indicated time points and processed for Propidium Iodide staining and FACS analysis as described in Materials and methods. B. indicates a tabular representation of cell cycle profiles as determined by manual gating for G1, S, G2/M and subG1 areas. C is the cell cycle profiles.
Figure 5
Figure 5. MK2461 has efficacy in NCI-H716 xenografts.
A. 5×10exp6 NCI-H716 cells were implanted subcutaneously into Balb/c nude mice and treated with MK2461 at either 300 mg/kg or 800 mg/kg on a QD dosing schedule. Relative tumor growth is indicated on the Y axis. B. Tumor bearing mice were treated with a single dose of MK2461 at either 300 mg/kg or 800 mg/kg. Tumors were isolated at either 4 or 24 hours post treatment, and placed in liquid nitrogen. Tumors were processed using the tissue lyzer (Qiagen) as described in materials and methods and analyzed by SDS-PAGE and western blotting with the indicated phospho and total antibodies.
Figure 6
Figure 6. FGFR2 IHC in colorectal cancer arrays.
Colon cancer arrays CO702, 802 and CO992 were stained with the H80 FGFR2 antibody (Santa Cruz Biotechnology, Santa Cruz CA) at a 1∶50 dilution on a Ventana Benchmark. Positive controls: NCI-H716, indicates a section from a NCI-H716 xenograft, and 1182 indicates a primary gastric cancer sample harboring FGFR2 amplification. HT29 is a section from an HT29 xenograft. CO802, A2 indicates a positively staining colorectal cancer section, while CO802 D5 indicates a negatively staining section.

References

    1. O’Connell JB, Maggard MA, Ko CY (2004) Colon cancer survival rates with the new American Joint Committee on Cancer sixth edition staging. J Natl Cancer Inst 96: 1420–1425. - PubMed
    1. Fearon ER, Vogelstein B (1990) A genetic model for colorectal tumorigenesis. Cell 61: 759–767. - PubMed
    1. Samuels Y, Wang Z, Bardelli A, Silliman N, Ptak J, et al. (2004) High frequency of mutations of the PIK3CA gene in human cancers. Science 304: 554. - PubMed
    1. Davies H, Bignell GR, Cox C, Stephens P, Edkins S, et al. (2002) Mutations of the BRAF gene in human cancer. Nature 417: 949–954. - PubMed
    1. Untawale S, Zorbas MA, Hodgson CP, Coffey RJ, Gallick GE, et al. (1993) Transforming growth factor-alpha production and autoinduction in a colorectal carcinoma cell line (DiFi) with an amplified epidermal growth factor receptor gene. Cancer Res 53: 1630–1636. - PubMed

Publication types

MeSH terms