. 2014 Jun 26;10(6):e1004434.
doi: 10.1371/journal.pgen.1004434. eCollection 2014 Jun.

Background selection as baseline for nucleotide variation across the Drosophila genome

Affiliations

Background selection as baseline for nucleotide variation across the Drosophila genome

Josep M Comeron. PLoS Genet. .

Abstract

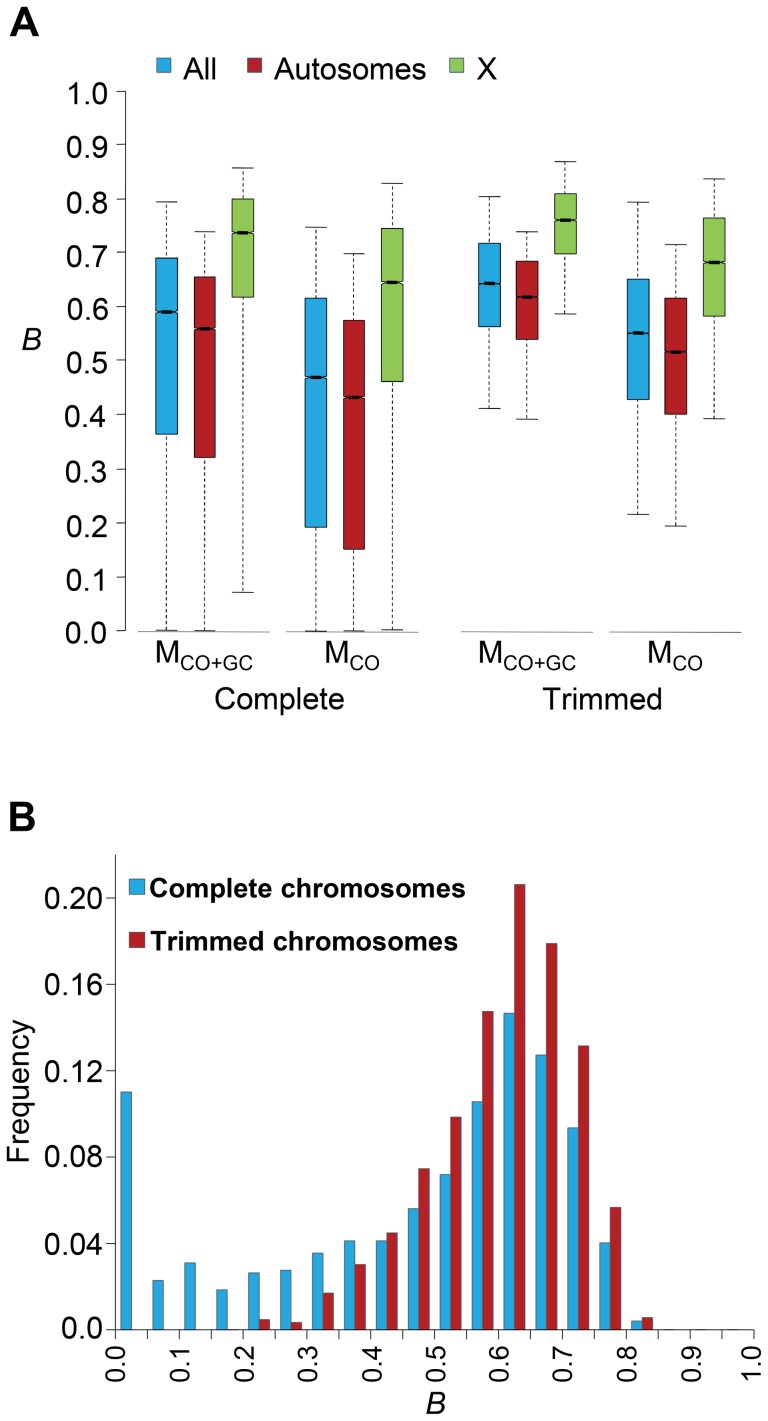
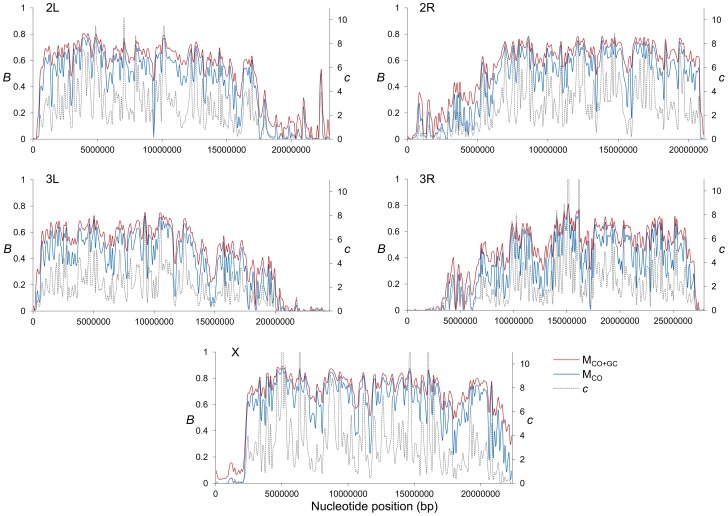
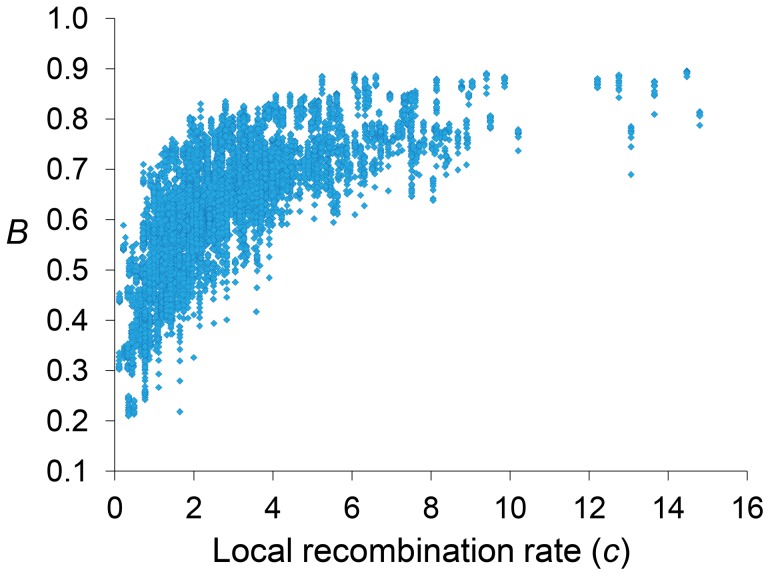
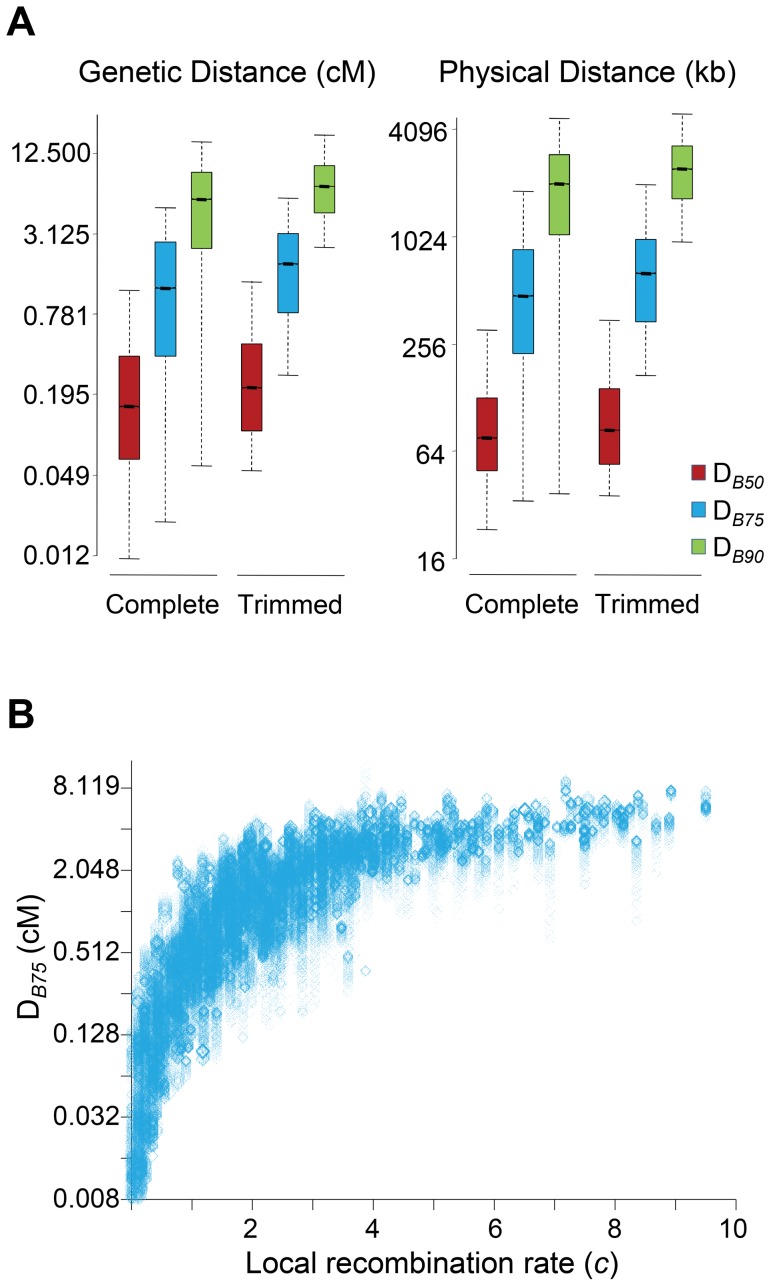
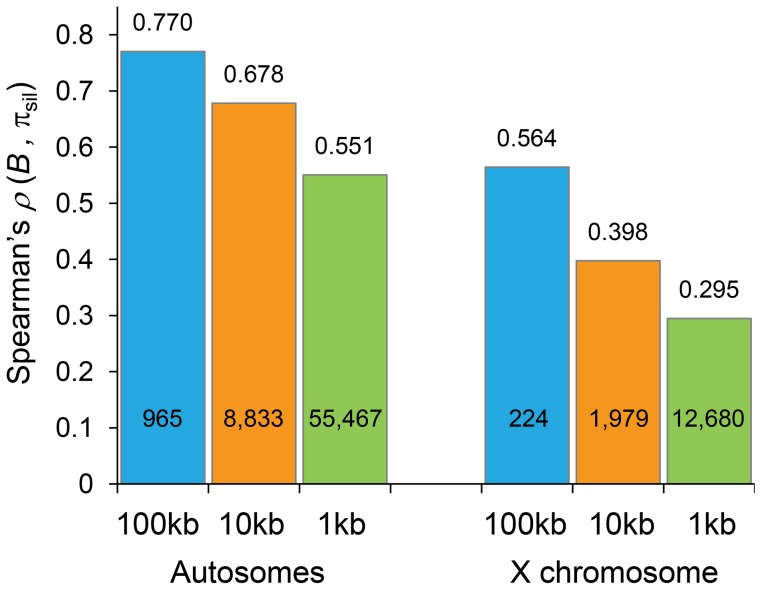
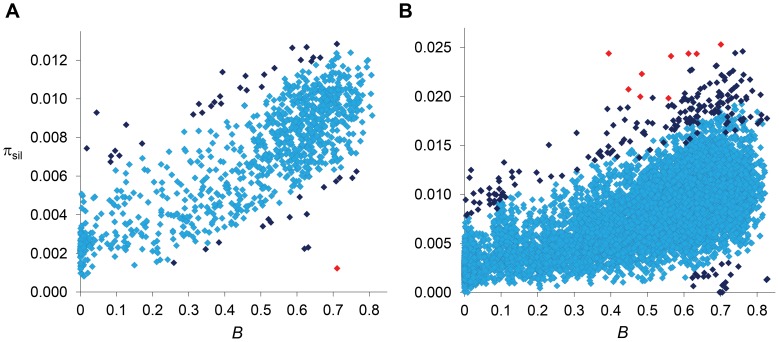
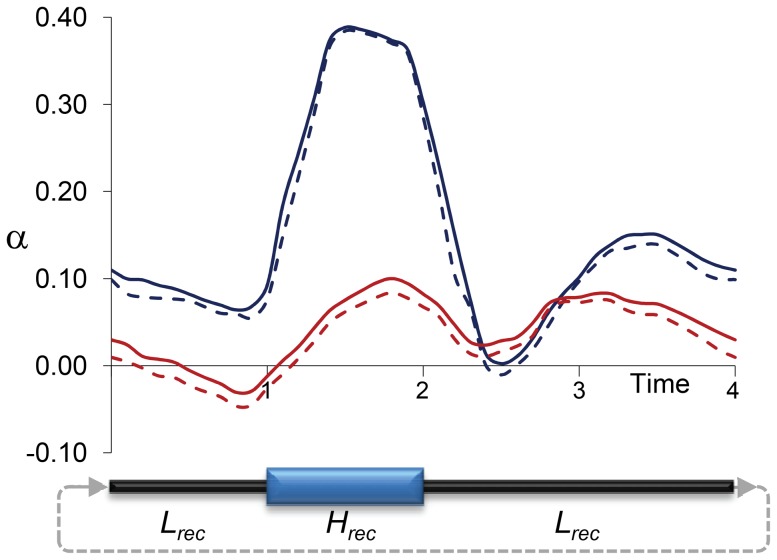
The constant removal of deleterious mutations by natural selection causes a reduction in neutral diversity and efficacy of selection at genetically linked sites (a process called Background Selection, BGS). Population genetic studies, however, often ignore BGS effects when investigating demographic events or the presence of other types of selection. To obtain a more realistic evolutionary expectation that incorporates the unavoidable consequences of deleterious mutations, we generated high-resolution landscapes of variation across the Drosophila melanogaster genome under a BGS scenario independent of polymorphism data. We find that BGS plays a significant role in shaping levels of variation across the entire genome, including long introns and intergenic regions distant from annotated genes. We also find that a very large percentage of the observed variation in diversity across autosomes can be explained by BGS alone, up to 70% across individual chromosome arms at 100-kb scale, thus indicating that BGS predictions can be used as baseline to infer additional types of selection and demographic events. This approach allows detecting several outlier regions with signal of recent adaptive events and selective sweeps. The use of a BGS baseline, however, is particularly appropriate to investigate the presence of balancing selection and our study exposes numerous genomic regions with the predicted signature of higher polymorphism than expected when a BGS context is taken into account. Importantly, we show that these conclusions are robust to the mutation and selection parameters of the BGS model. Finally, analyses of protein evolution together with previous comparisons of genetic maps between Drosophila species, suggest temporally variable recombination landscapes and, thus, local BGS effects that may differ between extant and past phases. Because genome-wide BGS and temporal changes in linkage effects can skew approaches to estimate demographic and selective events, future analyses should incorporate BGS predictions and capture local recombination variation across genomes and along lineages.


Conflict of interest statement

The author has declared that no competing interests exist.

Figures

Figure 1
Figure 1. Genome-wide estimates of BGS.
(A) Boxplots of estimates of B for complete or trimmed chromosomes and for models MLN,StdMut,CO+GC (MCO+GC) and MLN,StdMut,CO (MCO). Results shown for the complete genome, and autosomes and the X chromosome separately. The median is identified by the line inside the box, the length of the box and whiskers indicate 50% and 90% CI, respectively. (B) Frequency distribution of B estimates for complete or trimmed chromosomes under model MLN,StdMut,CO+GC. All results based on the analysis of 1-kb non-overlapping regions.
Figure 2
Figure 2. High-resolution distribution of BGS effects across the D. melanogaster genome.
Estimates of BGS effects are measured as B and shown along each chromosome arm for 100-kb adjacent windows. Red and blue lines depict estimates of B based on models MLN,StdMut,CO+GC (MCO+GC) and MLN,StdMut,CO (MCO), respectively. Grey dashed lines show the distribution of crossover rates (c), measured as centimorgans (cM) per megabase (Mb) per female meiosis (see for details).
Figure 3
Figure 3. Relationship between local recombination rates and estimates of B across trimmed chromosomes.
Local recombination rates (c) measured as cM/Mb per female meiosis. Estimates of B based on the default model MLN,StdMut,CO+GC. Results shown for 10-kb non-overlapping regions.
Figure 4
Figure 4. Genomic distance influencing patterns of BGS in D. melanogaster.
(A) Boxplots of estimates of DB50, DB75 and DB90. DB90 is defined as the size of the genomic region around a focal point needed to generate 90% of the total BGS effect obtained when considering the whole chromosome. Equivalently, DB75 and DB50 indicate genomic distances needed to generate 75 and 50%, respectively, of the total BGS effect obtained when considering the complete chromosome. The units of DB are genetic distances (cM/female meiosis) or physical distances (kb). (See Figure 1 legend for further explanation of boxplots.) Results shown for the default model MLN,StdMut,CO+GC. (B) Relationship between local recombination rates (c; cM/Mb per female meiosis) and estimates of DB75 in genetic distance. Results shown based on the analysis of 1-kb non-overlapping regions across the whole genome (Spearman's ρ = 0.907, P<1×10⁻¹²).
Figure 5
Figure 5. Correlation coefficients between estimates of B and levels of polymorphism at noncoding sites (πsil).
Spearman's rank correlation coefficients (ρ) based on the analysis of 100-, 10- and 1-kb non-overlapping regions are shown above columns (P<1×10⁻¹² in all cases) and the number of regions analyzed is shown within columns. Results shown for the default model MLN,StdMut,CO+GC.
Figure 6
Figure 6. Relationship between estimates of B and πsil.
(A) Relationship between estimates of B and πsil for 100-kb autosomal regions. Spearman's ρ = 0.770 (1,189 regions, P<1×10⁻¹²). (B) Relationship between estimates of B and πsil for 10-kb autosomal regions. Spearman's ρ = 0.678 (8,883 regions, P<1×10⁻¹²). Dark blue and red diamonds indicate regions with πsil significantly different (higher or lower) than predicted based on residual analysis: dark blue (P<0.01), red (FDR-corrected q<0.10). Results shown for the default model MLN,StdMut,CO+GC.
Figure 7
Figure 7. Estimates of α due to temporally fluctuating recombination rates and variable BGS effects.
Results based on forward population genetic simulations of 10,000 diploid individuals (N), a chromosome segment of 1 Mb containing 100 genes, and two types of mutations: neutral and deleterious (see Materials and Methods for details). Cycles of fluctuating recombination followed phases of moderately high recombination for 1N generations (H rec phase) and moderately low recombination for 3N generations (L rec phase). Estimates of α at negatively selected sites obtained following the models proposed by Eyre-Walker and Keightley , every 0.1N generations. Blue and red lines indicate estimates of α assuming constant population size and variable population sizes, respectively. Continuous and dashed lines indicate estimates of α with and without correction for the effect of polymorphism to divergence, respectively.

References

    1. Charlesworth B (2012) The effects of deleterious mutations on evolution at linked sites. Genetics 190: 5–22. - PMC - PubMed
    1. Gillespie JH (2000) Genetic drift in an infinite population. The pseudohitchhiking model. Genetics 155: 909–919. - PMC - PubMed
    1. Barton NH (2010) Genetic linkage and natural selection. Philosophical Transactions of the Royal Society of London Series B: Biological Sciences 365: 2559–2569. - PMC - PubMed
    1. Stephan W (2010) Genetic hitchhiking versus background selection: the controversy and its implications. Philos Trans R Soc Lond B Biol Sci 365: 1245–1253. - PMC - PubMed
    1. Cutter AD, Payseur BA (2013) Genomic signatures of selection at linked sites: unifying the disparity among species. Nat Rev Genet 14: 262–274. - PMC - PubMed

Publication types

LinkOut - more resources