

Influenza vaccination accelerates recovery of ferrets from lymphopenia
- PMID: 24968319
- PMCID: PMC4072694
- DOI: 10.1371/journal.pone.0100926
Influenza vaccination accelerates recovery of ferrets from lymphopenia
Abstract
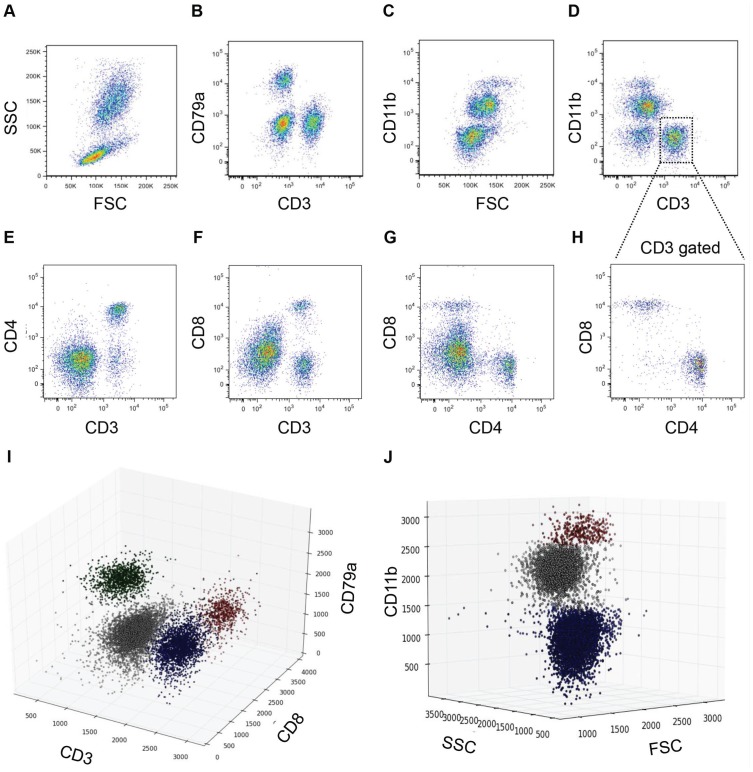
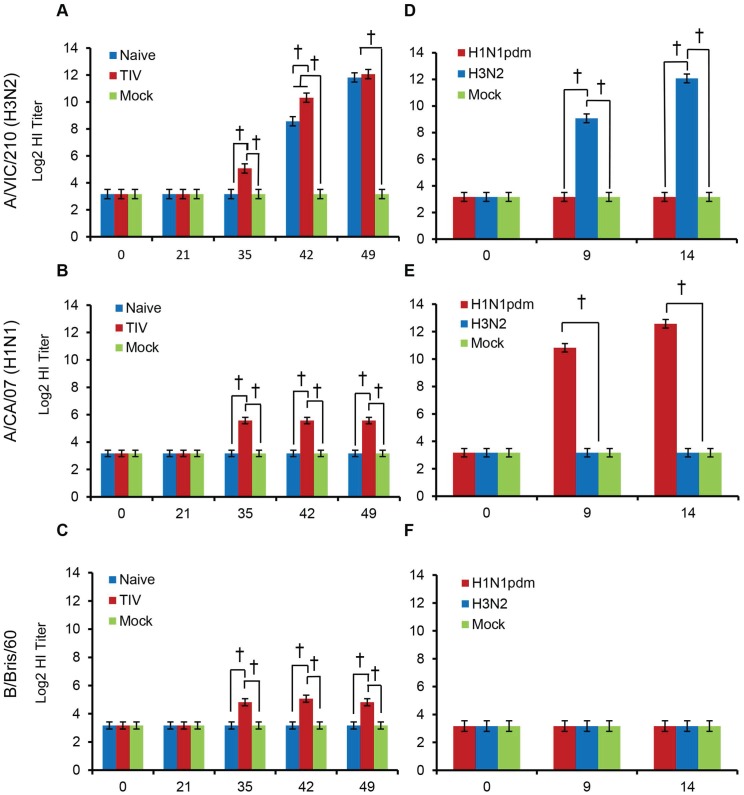
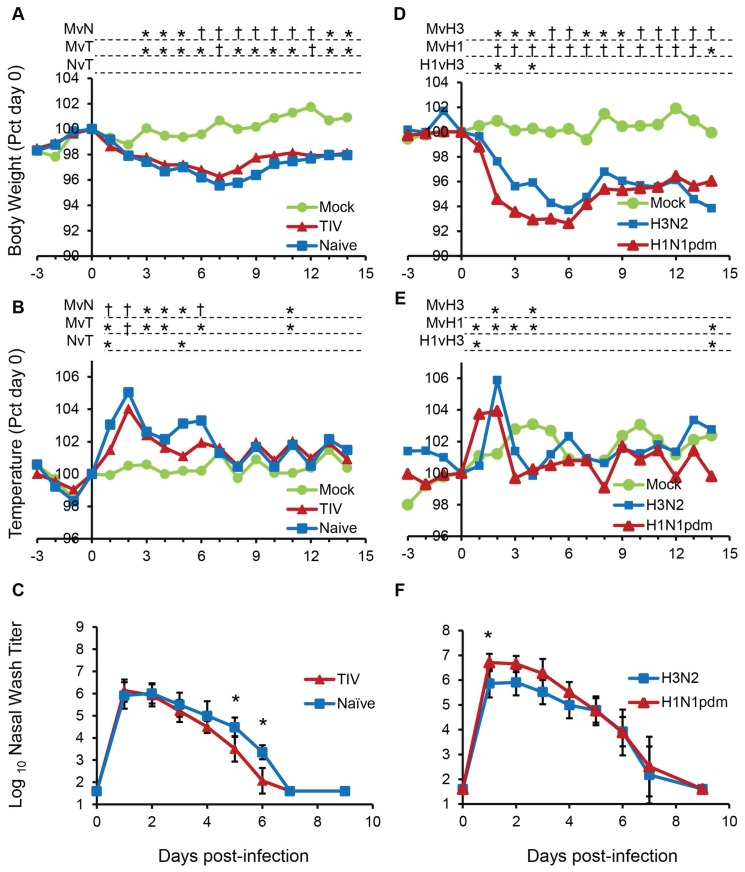
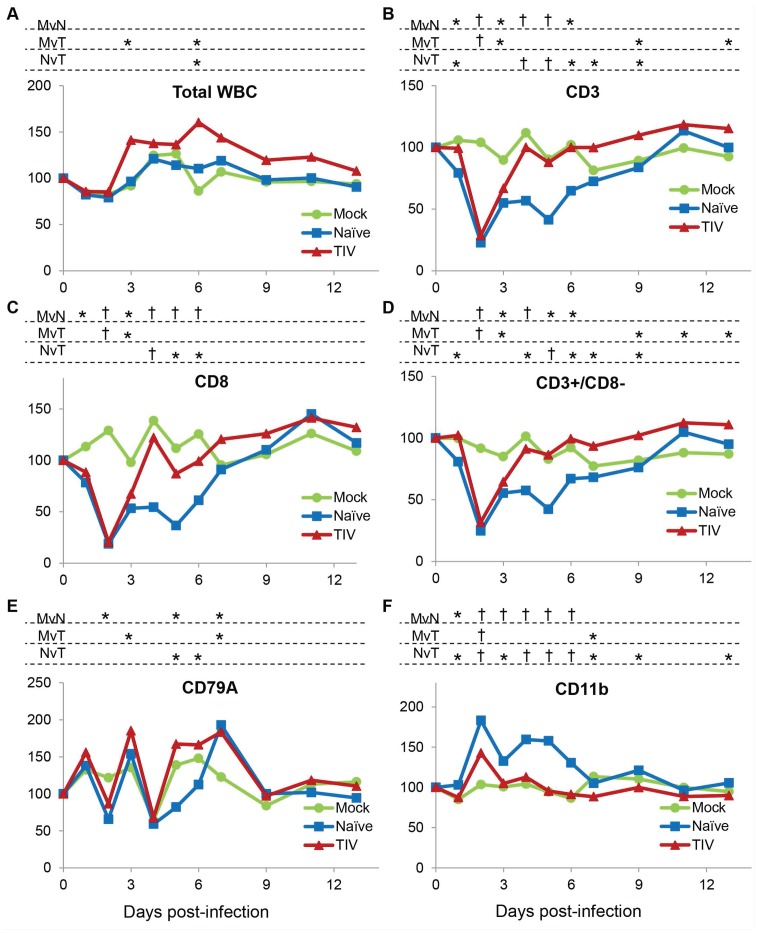
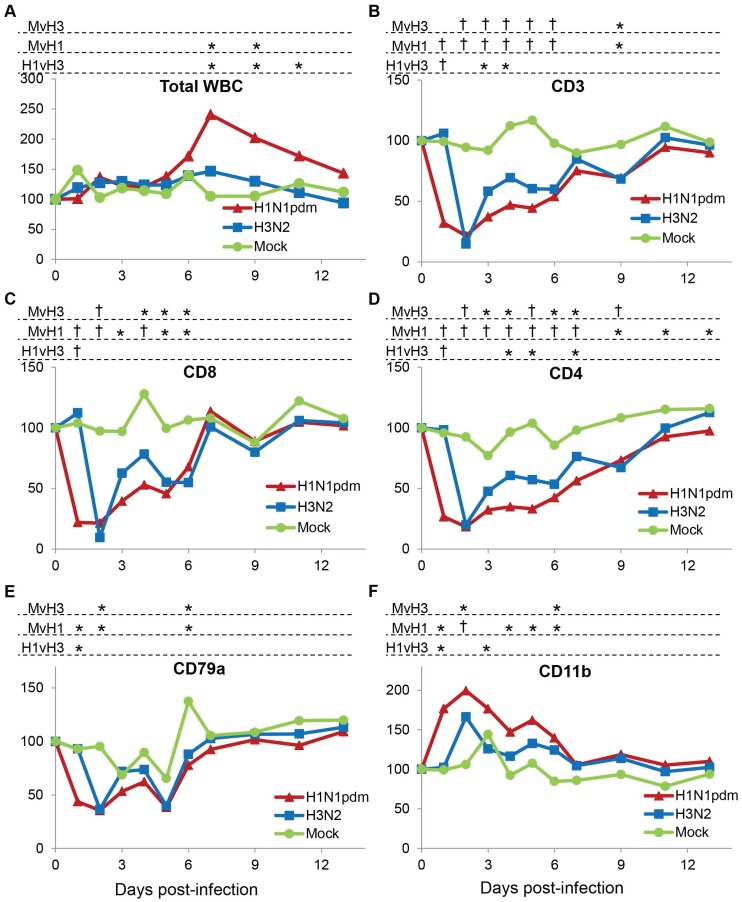
Ferrets are a useful animal model for human influenza virus infections, since they closely mimic the pathogenesis of influenza viruses observed in humans. However, a lack of reagents, especially for flow cytometry of immune cell subsets, has limited research in this model. Here we use a panel of primarily species cross-reactive antibodies to identify ferret T cells, cytotoxic T lymphocytes (CTL), B cells, and granulocytes in peripheral blood. Following infection with seasonal H3N2 or H1N1pdm09 influenza viruses, these cell types showed rapid and dramatic changes in frequency, even though clinically the infections were mild. The loss of B cells and CD4 and CD8 T cells, and the increase in neutrophils, were especially marked 1-2 days after infection, when about 90% of CD8+ T cells disappeared from the peripheral blood. The different virus strains led to different kinetics of leukocyte subset alterations. Vaccination with homologous vaccine reduced clinical symptoms slightly, but led to a much more rapid return to normal leukocyte parameters. Assessment of clinical symptoms may underestimate the effectiveness of influenza vaccine in restoring homeostasis.
Conflict of interest statement
Figures
Similar articles
-
Pandemic influenza 1918 H1N1 and 1968 H3N2 DNA vaccines induce cross-reactive immunity in ferrets against infection with viruses drifted for decades.Influenza Other Respir Viruses. 2011 Jan;5(1):13-23. doi: 10.1111/j.1750-2659.2010.00177.x. Epub 2010 Nov 3. Influenza Other Respir Viruses. 2011. PMID: 21138536 Free PMC article.
-
Elicitation of Protective Antibodies against 20 Years of Future H3N2 Cocirculating Influenza Virus Variants in Ferrets Preimmune to Historical H3N2 Influenza Viruses.J Virol. 2019 Jan 17;93(3):e00946-18. doi: 10.1128/JVI.00946-18. Print 2019 Feb 1. J Virol. 2019. PMID: 30429350 Free PMC article.
-
Impact of prior seasonal H3N2 influenza vaccination or infection on protection and transmission of emerging variants of influenza A(H3N2)v virus in ferrets.J Virol. 2013 Dec;87(24):13480-9. doi: 10.1128/JVI.02434-13. Epub 2013 Oct 2. J Virol. 2013. PMID: 24089569 Free PMC article.
-
Recalling the Future: Immunological Memory Toward Unpredictable Influenza Viruses.Front Immunol. 2019 Jul 2;10:1400. doi: 10.3389/fimmu.2019.01400. eCollection 2019. Front Immunol. 2019. PMID: 31312199 Free PMC article. Review.
-
The Intersection of Age and Influenza Severity: Utility of Ferrets for Dissecting the Age-Dependent Immune Responses and Relevance to Age-Specific Vaccine Development.Viruses. 2021 Apr 15;13(4):678. doi: 10.3390/v13040678. Viruses. 2021. PMID: 33920917 Free PMC article. Review.
Cited by
-
Flow Cytometric and Cytokine ELISpot Approaches To Characterize the Cell-Mediated Immune Response in Ferrets following Influenza Virus Infection.J Virol. 2016 Aug 12;90(17):7991-8004. doi: 10.1128/JVI.01001-16. Print 2016 Sep 1. J Virol. 2016. PMID: 27356897 Free PMC article.
-
Pathology and Immunity After SARS-CoV-2 Infection in Male Ferrets Is Affected by Age and Inoculation Route.Front Immunol. 2021 Oct 21;12:750229. doi: 10.3389/fimmu.2021.750229. eCollection 2021. Front Immunol. 2021. PMID: 34745122 Free PMC article.
-
Cellular immune response to human influenza viruses differs between H1N1 and H3N2 subtypes in the ferret lung.PLoS One. 2018 Sep 7;13(9):e0202675. doi: 10.1371/journal.pone.0202675. eCollection 2018. PLoS One. 2018. PMID: 30192789 Free PMC article.
-
Polymeric nanoparticle-based mRNA vaccine is protective against influenza virus infection in ferrets.Mol Ther Nucleic Acids. 2024 Feb 19;35(1):102159. doi: 10.1016/j.omtn.2024.102159. eCollection 2024 Mar 12. Mol Ther Nucleic Acids. 2024. PMID: 38444702 Free PMC article.
-
Supplementation of H1N1pdm09 split vaccine with heterologous tandem repeat M2e5x virus-like particles confers improved cross-protection in ferrets.Vaccine. 2016 Jan 20;34(4):466-473. doi: 10.1016/j.vaccine.2015.12.023. Epub 2015 Dec 19. Vaccine. 2016. PMID: 26709639 Free PMC article.
References
-
- WHO (2009) World Health Organization Fact sheet No. 211. Influenza (Seasonal).
-
- Nair H, Brooks WA, Katz M, Roca A, Berkley JA, et al. (2011) Global burden of respiratory infections due to seasonal influenza in young children: a systematic review and meta-analysis. Lancet 378: 1917–1930. - PubMed
-
- Monto AS (2004) Global burden of influenza: what we know and what we need to know. Options for the Control of Influenza V 1263: 3–11.
-
- Clark NM, Lynch JP 3rd (2011) Influenza: epidemiology, clinical features, therapy, and prevention. Semin Respir Crit Care Med 32: 373–392. - PubMed
-
- Louie J, Jean C, Chen T-H, Park S, Ueki R, et al. (2009) Bacterial coinfections in lung tissue specimens from fatal cases of 2009 pandemic influenza A (H1N1) - United States, May–August 2009. MMWR Morb Mortal Wkly Rep 58: 1071–1074. - PubMed
Publication types
MeSH terms
Substances
LinkOut - more resources
Full Text Sources
Other Literature Sources
Medical
Research Materials
