

The Navigation Guide - evidence-based medicine meets environmental health: systematic review of nonhuman evidence for PFOA effects on fetal growth
- PMID: 24968374
- PMCID: PMC4181920
- DOI: 10.1289/ehp.1307177
The Navigation Guide - evidence-based medicine meets environmental health: systematic review of nonhuman evidence for PFOA effects on fetal growth
Abstract
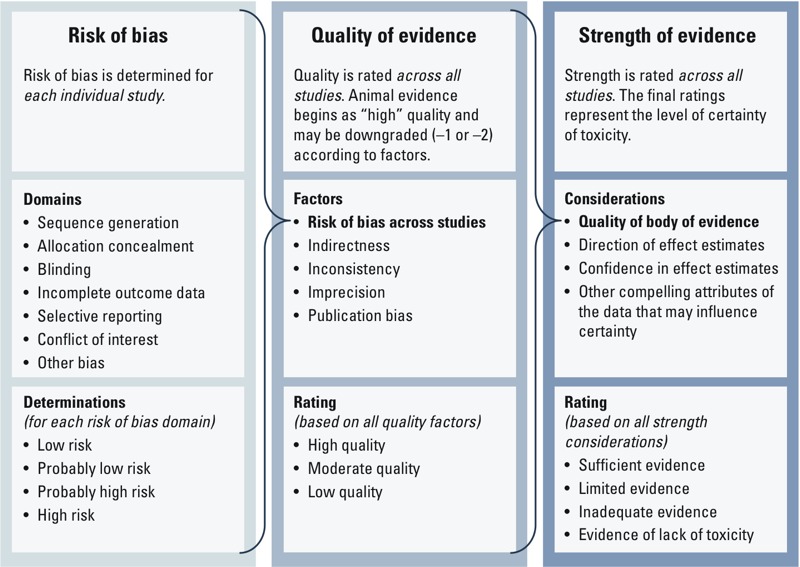
Background: In contrast to current methods of expert-based narrative review, the Navigation Guide is a systematic and transparent method for synthesizing environmental health research from multiple evidence streams. The Navigation Guide was developed to effectively and efficiently translate the available scientific evidence into timely prevention-oriented action.
Objectives: We applied the Navigation Guide systematic review method to answer the question "Does fetal developmental exposure to perfluorooctanoic acid (PFOA) or its salts affect fetal growth in animals ?" and to rate the strength of the experimental animal evidence.
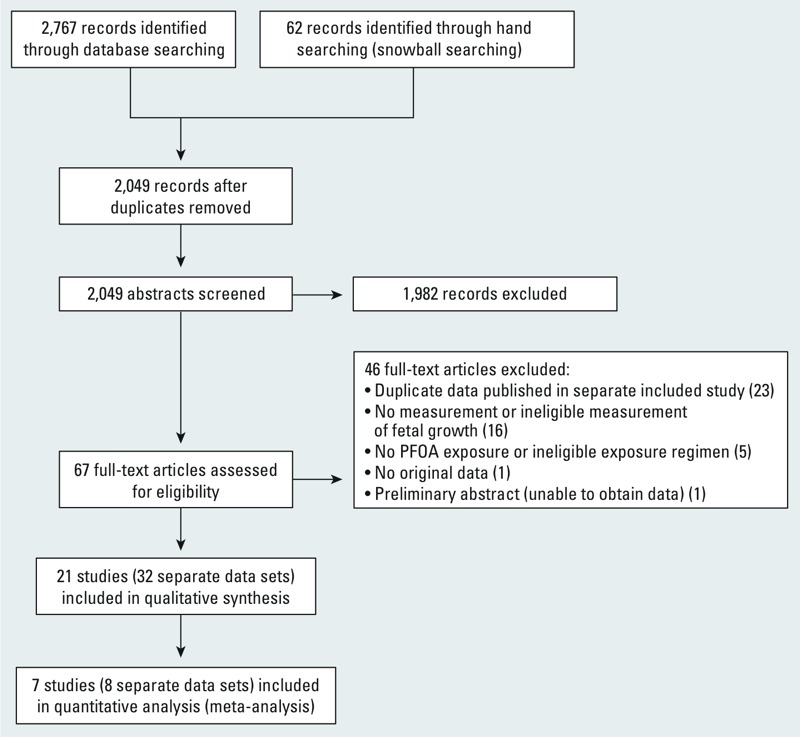
Methods: We conducted a comprehensive search of the literature, applied prespecified criteria to the search results to identify relevant studies, extracted data from studies, obtained additional information from study authors, conducted meta-analyses, and rated the overall quality and strength of the evidence.
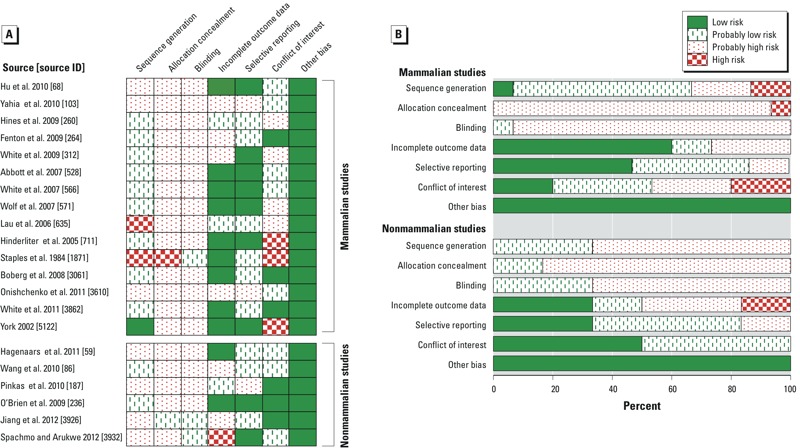
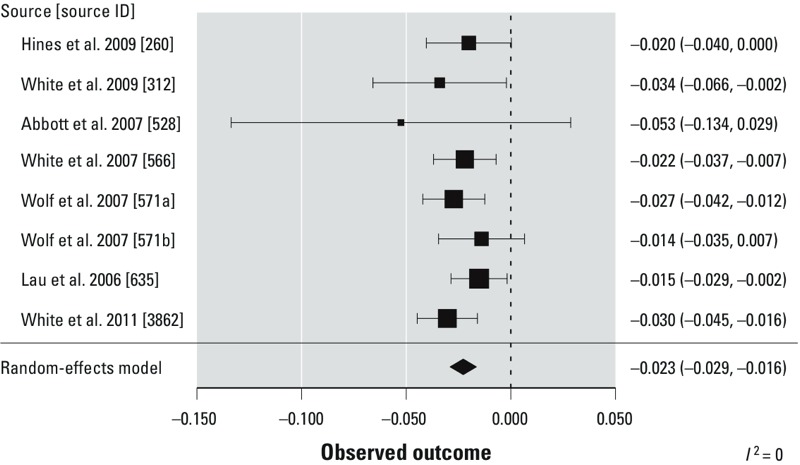
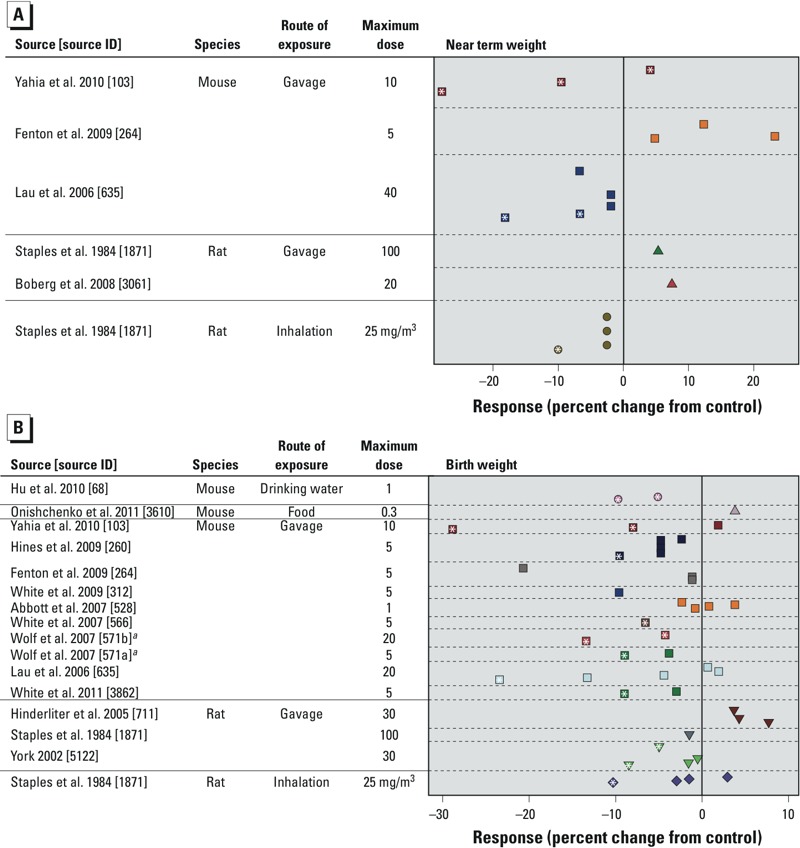
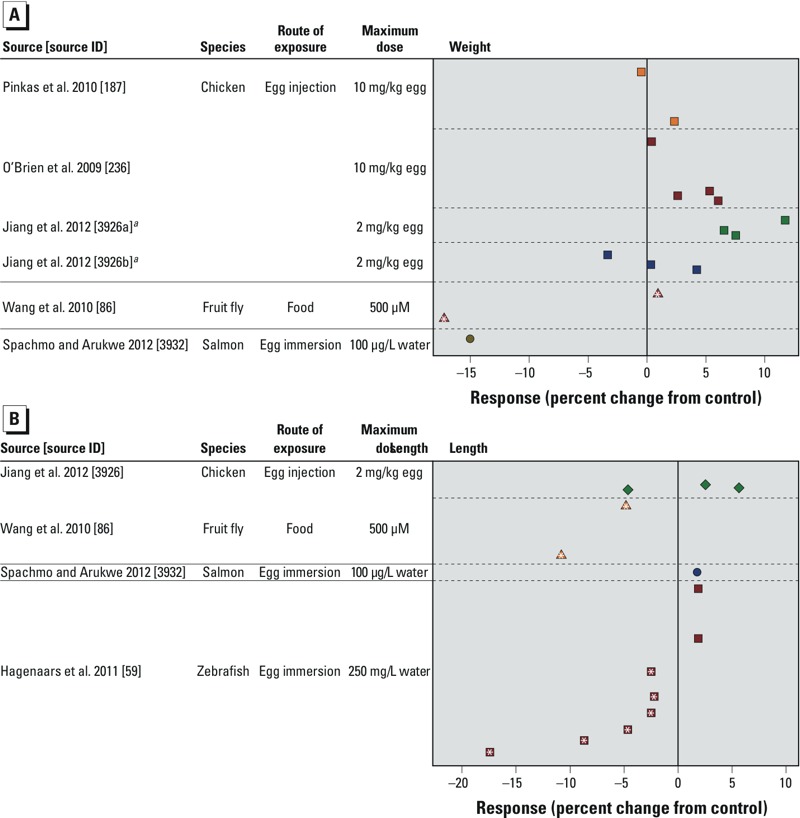
Results: Twenty-one studies met the inclusion criteria. From the meta-analysis of eight mouse gavage data sets, we estimated that exposure of pregnant mice to increasing concentrations of PFOA was associated with a change in mean pup birth weight of -0.023 g (95% CI: -0.029, -0.016) per 1-unit increase in dose (milligrams per kilogram body weight per day). The evidence, consisting of 15 mammalian and 6 nonmammalian studies, was rated as "moderate" and "low" quality, respectively.
Conclusion: Based on this first application of the Navigation Guide methodology, we found sufficient evidence that fetal developmental exposure to PFOA reduces fetal growth in animals.
Conflict of interest statement
The contents of this paper are solely the responsibility of the authors and do not necessarily represent the official views of the U.S. EPA. Further, the U.S. EPA does not endorse the purchase of any commercial products or services mentioned in the publication.
The authors declare they have no actual or potential competing financial interests.
Figures
Comment in
-
The Navigation Guide: systematic review for the environmental health sciences.Environ Health Perspect. 2014 Oct;122(10):A283. doi: 10.1289/ehp.122-A283. Environ Health Perspect. 2014. PMID: 25271710 Free PMC article. No abstract available.
-
Systematic reviews: perhaps "the answer to policy makers' prayers"?Environ Health Perspect. 2014 Oct;122(10):A262-3. doi: 10.1289/ehp.1408599. Environ Health Perspect. 2014. PMID: 25272205 Free PMC article. No abstract available.
References
-
- Abbott BD, Wolf CJ, Schmid JE, Das KP, Zehr RD, Helfant L, et al. Perfluorooctanoic acid–induced developmental toxicity in the mouse is dependent on expression of peroxisome proliferator–activated receptor-alpha. Toxicol Sci. 2007;98:571–581. - PubMed
-
- Apelberg BJ, Goldman LR, Calafat AM, Herbstman JB, Kuklenyik Z, Heidler J, et al. Determinants of fetal exposure to polyfluoroalkyl compounds in Baltimore, Maryland. Environ Sci Technol. 2007a;41:3891–3897. - PubMed
-
- ATSDR (Agency for Toxic Substances and Disease Registry). Draft Toxicological Profile for Perfluoroalkyls. 2009. Available: http://www.atsdr.cdc.gov/toxprofiles/tp200.pdf [accessed 13 February 2013] - PubMed
-
- Balshem H, Helfand M, Schünemann HJ, Oxman AD, Kunz R, Brozek J, et al. GRADE guidelines: 3. Rating the quality of evidence. J Clin Epidemiol. 2011;64:401–406. - PubMed
Publication types
MeSH terms
Substances
Grants and funding
LinkOut - more resources
Full Text Sources
Other Literature Sources
Medical
Miscellaneous
