. 2014 Aug;6(8):1016-27.
doi: 10.15252/emmm.201404092.

Deoxypyrimidine monophosphate bypass therapy for thymidine kinase 2 deficiency

Affiliations

Deoxypyrimidine monophosphate bypass therapy for thymidine kinase 2 deficiency

Caterina Garone et al. EMBO Mol Med. 2014 Aug.

Abstract

Autosomal recessive mutations in the thymidine kinase 2 gene (TK2) cause mitochondrial DNA depletion, multiple deletions, or both due to loss of TK2 enzyme activity and ensuing unbalanced deoxynucleotide triphosphate (dNTP) pools. To bypass Tk2 deficiency, we administered deoxycytidine and deoxythymidine monophosphates (dCMP+dTMP) to the Tk2 H126N (Tk2(-/-)) knock-in mouse model from postnatal day 4, when mutant mice are phenotypically normal, but biochemically affected. Assessment of 13-day-old Tk2(-/-) mice treated with dCMP+dTMP 200 mg/kg/day each (Tk2(-/-200dCMP/) (dTMP)) demonstrated that in mutant animals, the compounds raise dTTP concentrations, increase levels of mtDNA, ameliorate defects of mitochondrial respiratory chain enzymes, and significantly prolong their lifespan (34 days with treatment versus 13 days untreated). A second trial of dCMP+dTMP each at 400 mg/kg/day showed even greater phenotypic and biochemical improvements. In conclusion, dCMP/dTMP supplementation is the first effective pharmacologic treatment for Tk2 deficiency.

Keywords: deoxycytidine monophosphate; deoxythymidine monophosphate; encephalomyopathy; therapy; thymidine kinase.


Figures

Figure 1
Figure 1. dCMP/dTMP efficacy on clinical phenotype
A, B   Significant dose-related effects of the dCMP/dTMP on body weight (A) and survival (B) of mutant mice (n = 7 for each group)(Tk2−/− versus Tk2−/−200dCMP/dTMP, P < 0.005; Tk2−/− versus Tk2−/−400dCMP/dTMP, P < 0.005; Gehan-Breslow-Wilcoxon test). C–E   Open-field test in 29-day-old treated mice showing no difference in average distance traveled (C), ambulatory and resting times (D), and horizontal (XY axes) and vertical (Z-axis) movements (E) over 10 min in 29-day-old mutant and control mice treated with 200 mg/kg/day or 400 mg/kg/day of dCMP/dTMP (n = 5) (Data expressed as mean ± SD. Statistical analysis were performed on Tk2−/−200dCMP/dTMP versus Tk2+200dCMP/dTMP and Tk2−/−400dCMP/dTMP versus Tk2+400dCMP/dTMP).
Figure 2
Figure 2. dCMP/dTMP effects on brain and spinal cord morphology
A, B   Hematoxylin and eosin stain showing numerous vacuoles in 13-day-old untreated Tk2−/− in brain (A) and spinal cord neurons (B). Vacuoles were rare or absent in Tk2−/−200dCMP/dTMP and not observed in wild-type mice.
Figure 3
Figure 3. Complex I immunohistochemistry and complex IV histochemistry of cerebellum
A–D   Complex IV (COX) histochemistry of cerebellum showing deficiency in 13-day-old untreated Tk2−/− (A) in contrast to normal COX activity in Tk2+ (B), Tk2−/−200dCMP/dTMP (C), and Tk2+200dCMP/dTMP (D) mice. E–H   COX histochemistry (E-F) and immunostaining against COX subunit II (G-H) of cerebellum showed no differences between 29-day-old Tk2−/−200dCMP/dTMP (upper panels) and age-matched Tk2+200dCMP/dTMP mice (lower panels). I–J   Anti-complex I NDUFB8 subunit immunostaining of brain showed reduced staining in 29-day-old Tk2−/−200dCMP/dTMP (I) versus Tk2+200dCMP/dTMP mice (J).
Figure 4
Figure 4. dCMP/dTMP effects on dNTP pool balance and mtDNA copy number
A, B   Proportions of dNTPs (in percents) in isolated mitochondria of brain (A) and liver (B) of 13 and 29 postnatal day mice (P13 and P29) demonstrate that levels of dTTP (red sections) were increased in treated mutant versus untreated mutant mice at P13, but were severely decreased in P29 Tk2−/−200dCMP/dTMP versus Tk2+200dCMP/dTMP (*P < 0.05; ***P < 0.0005; Mann–Whitney U-test). C   mtDNA copy numbers in mice reveal rescue of mtDNA depletion in all tissues of treated mutants at P13 (Tk2−/− versus Tk2−/−200dCMP/dTMP; *P < 0.05; **P < 0.005; ***P < 0.0005; Mann–Whitney U-test). D   Dose-related increase in mtDNA copy number in cerebral hemispheres of mutant mice at P29 (expressed as percent of untreated Tk2+ controls; mean ± SD; Tk2−/−200dCMP/dTMP versus Tk2−/−400dCMP/dTMP; *P < 0.05; Mann–Whitney U-test) (n = 5 for each group). Source data is available online for this figure.
Figure 5
Figure 5. dCMP/dTMP efficacy on brain hemisphere and cerebellum biochemistry
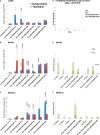
A, B   (A) Cerebral hemispheres of untreated Tk2−/− mice relative to untreated wild types showed significant increase in CS activity and deficiency of complex IV activity (micromole/min/mg tissue normalized to mg-protein; mean ± SD) as well as (B) defects of complexes IV and I+III activities when referred to CS (mean ± SD). In contrast, with 200 mg/kg/day dCMP/dTMP, activities of citrate synthase and complex IV were normal in cerebrum of 13-day-old Tk2−/−. C   In cerebellum of mutant mice at ages 13 and 29 days, activities of mitochondrial RC referred to CS (expressed as percent of Tk2+) showed treatment-dose-related increases. D–E   Western blot of OXPHOS protein (MitoProfile® Total OXPHOS Rodent WB Antibody Cocktail, MitoSciences®) in brain (D) and cerebellum (E) of 13-day-old untreated Tk2−/−, 13- and 29-day-old Tk2−/−200dCMP/dTMP mice, and cerebellum of Tk2−/−400dCMP/dTMP (expressed as percents relative to Tk2+). F–H   Quantitation of western blot bands demonstrated that treatment normalized levels of complexes I and IV protein in both brain cerebrum and cerebellum tissues at 13 days, but did not correct complexes I and III deficiencies in brain cerebrum and complexes I and IV in cerebellum at 29 days of age. Statistical analyses were performed using Tk2−/− versus Tk2−/−200dCMP/dTMP with P13 cerebral samples (F); Tk2−/−200dCMP/dTMP versus Tk2+200dCMP/dTMP with P29 cerebral samples (G); Tk2−/− versus Tk2−/−200dCMP/dTMP with P13 cerebellar samples (H); and Tk2−/−200dCMP/dTMP versus Tk2−/−400dCMP/dTMP with P29 cerebellar samples (H) *P < 0.05; **P < 0.005. Data information: Statistical analyses were performed with Mann–Whitney U-test and Unpaired t-test with Welch's correction. CS, citrate synthase; IV, cytochrome c oxidase (COX); I+III, NADH-cytochrome c reductase; I, NADH-dehydrogenase; II, succinate dehydrogenase; III, cytochrome c reductase; V, ATP synthase; P, postnatal day.
Figure 6
Figure 6. Metabolism of dCMP/dTMP
A–C   Level of deoxyuridine and deoxythymidine in liver, brain, and muscle tissues was markedly higher at 13 days, but lower at 29 days. Deoxynucleoside levels are expressed as percents relative to age-matched untreated wild-type controls (mean ± SD) (Tk2−/−200dCMP/dTMP, Tk2+200dCMP/dTMP, Tk2−/−400dCMP/dTMP, and Tk2+400dCMP/dTMP versus untreated Tk2+; *P < 0.05;**P < 0.005; Unpaired t-test with Welch's correction; n > 3 mice for each group). D   Thymidine phosphorylase (TP) activity in small intestine of treated and untreated Tk2 mice showing dramatically increased activity at age 29 days relative to 13 days. Data expressed as nmol/h/mg-proteins (mean ± SD). E, F   Tk1 and Tk2 activities in brain and muscle tissues of treated and untreated mice showing increased Tk1 activity in treated mice. Data expressed in pmol/min/mg-proteins (mean ± SD) (Tk2+/+ versus Tk2+/+200dCMP/dTMP; Tk2+/− versus Tk2+/−200dCMP/dTMP; Tk2−/− versus Tk2−/−200dCMP/dTMP; *P < 0.05; Unpaired t-test with Welch's correction; n > 3 mice for each group). P = p-value.
Figure 7
Figure 7. Deoxypyrimidine monophosphates pathways
Graphical summary of the pathways modulated by oral gavage dCMP/dTMP treatment. A   dTMP metabolism. dTMP treatment may enter as monophosphate into the mitochondria bypassing the TK2 enzymatic defect as demonstrated by the increased level of dTTP in postnatal day 13 mutant mouse tissues. However, dTMP is also rapidly degraded by 5′-nucleotidase in the small intestine to the nucleoside (dT), which may be processed via three different pathways: (i) phosphorylated by residual Tk2 activity to eventually produce dTTP within mitochondria; (ii) converted to dTMP by cytosolic Tk1; or (iii) catabolized by thymidine phosphorylase (TP). The combination of reduced Tk1 activity in brain and increased thymidine phosphorylase (TP) activity in small intestine after postnatal day 13 may account for the reduced efficacy of the treatment in rescuing the dNTP pool balance after age 13 days. B   dCMP metabolism. dCMP/dTMP treatment did not increase dCTP levels in mitochondria of Tk2−/− mice suggesting that dCMP administered orally does not enter into mitochondria. Instead, dCMP degraded to nucleoside (dC) may be a source of dTMP as shown in the figure or may be catabolized to uracil by cytosolic TP.

References

    1. Akman HO, Dorado B, Lopez LC, Garcia-Cazorla A, Vila MR, Tanabe LM, Dauer WT, Bonilla E, Tanji K, Hirano M. Thymidine kinase 2 (H126N) knockin mice show the essential role of balanced deoxynucleotide pools for mitochondrial DNA maintenance. Hum Mol Genet. 2008;17:2433–2440. - PMC - PubMed
    1. Bourdon A, Minai L, Serre V, Jais JP, Sarzi E, Aubert S, Chretien D, de Lonlay P, Paquis-Flucklinger V, Arakawa H, et al. Mutation of RRM2B, encoding p53-controlled ribonucleotide reductase (p53R2), causes severe mitochondrial DNA depletion. Nat Genet. 2007;39:776–780. - PubMed
    1. Brown NS, Bicknell R. Thymidine phosphorylase, 2-deoxy-D-ribose and angiogenesis. Biochem J. 1998;334:1–8. - PMC - PubMed
    1. Bulst S, Abicht A, Holinski-Feder E, Muller-Ziermann S, Koehler U, Thirion C, Walter MC, Stewart JD, Chinnery PF, Lochmuller H, et al. In vitro supplementation with dAMP/dGMP leads to partial restoration of mtDNA levels in mitochondrial depletion syndromes. Hum Mol Genet. 2009;18:1590–1599. - PubMed
    1. Copeland WC. Defects in mitochondrial DNA replication and human disease. Crit Rev Biochem Mol Biol. 2012;47:64–74. - PMC - PubMed

Publication types