

Morphological and Functional Analysis of Hepatocyte Spheroids Generated on Poly-HEMA-Treated Surfaces under the Influence of Fetal Calf Serum and Nonparenchymal Cells
- PMID: 24970167
- PMCID: PMC4030890
- DOI: 10.3390/biom3010242
Morphological and Functional Analysis of Hepatocyte Spheroids Generated on Poly-HEMA-Treated Surfaces under the Influence of Fetal Calf Serum and Nonparenchymal Cells
Abstract
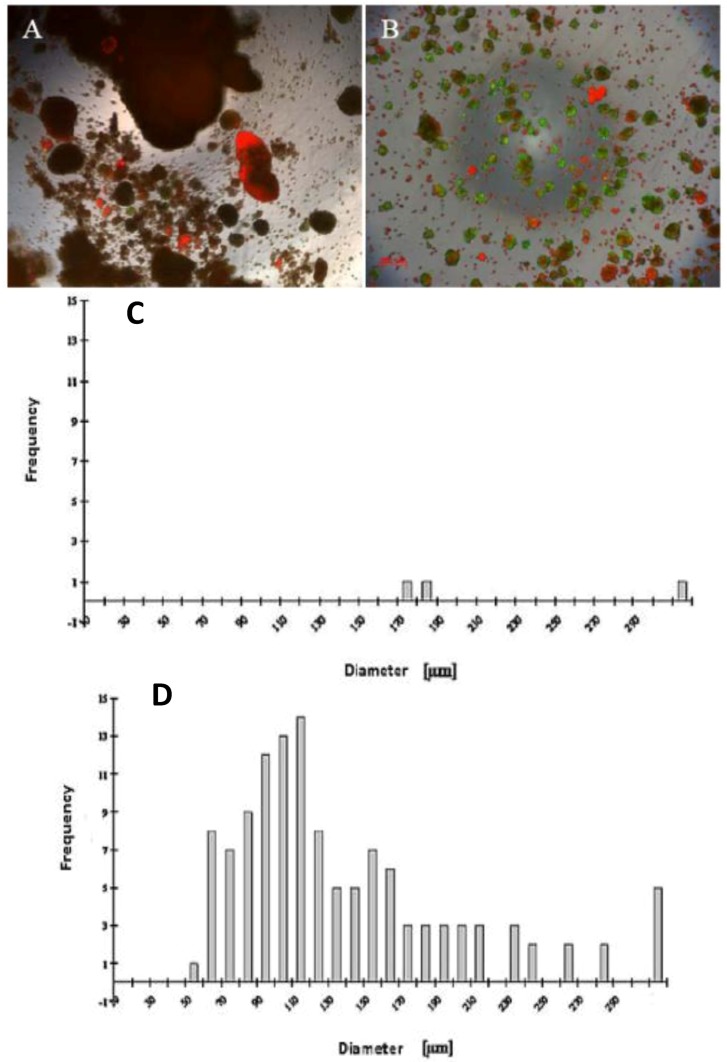
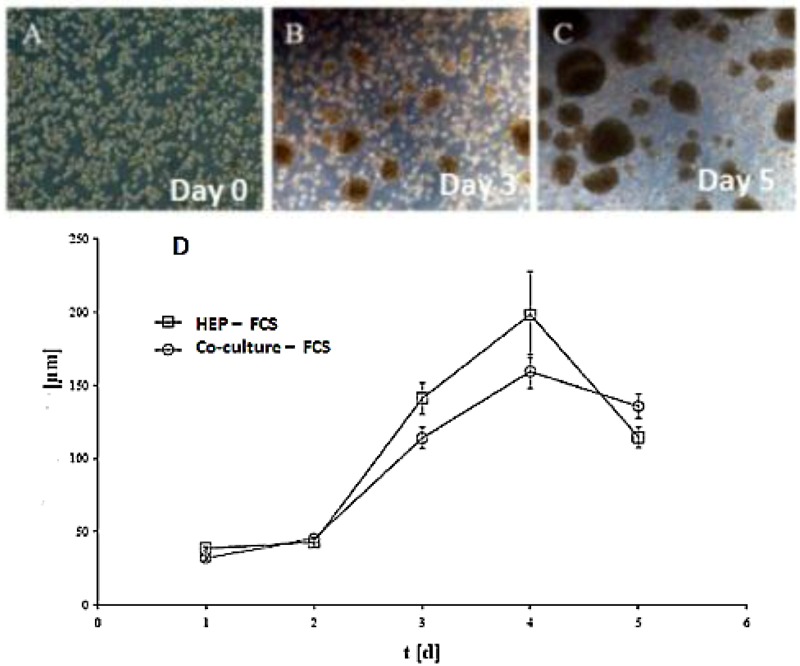
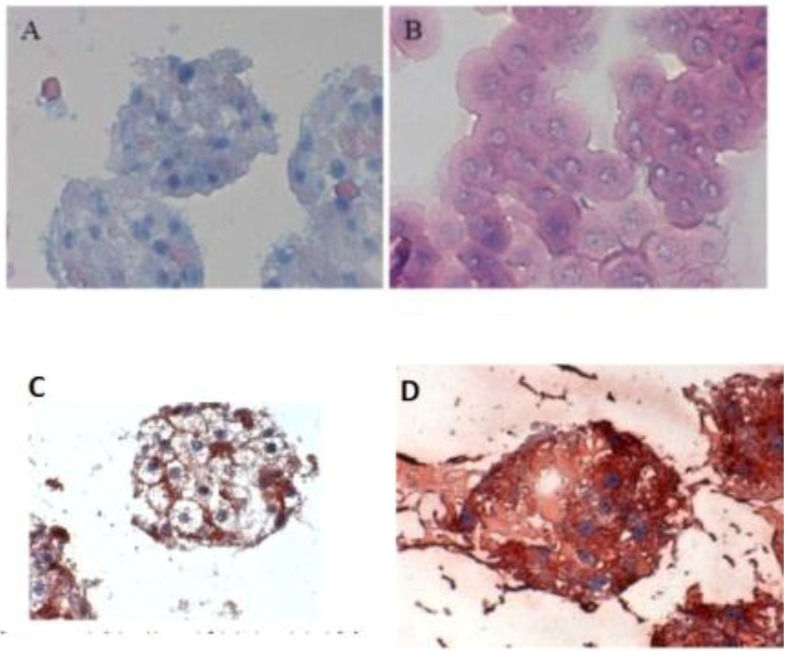
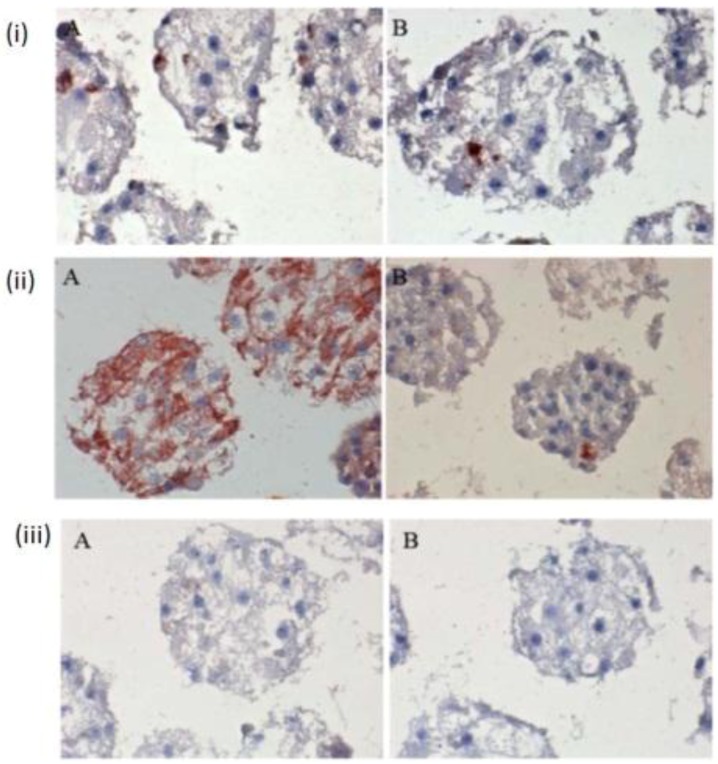
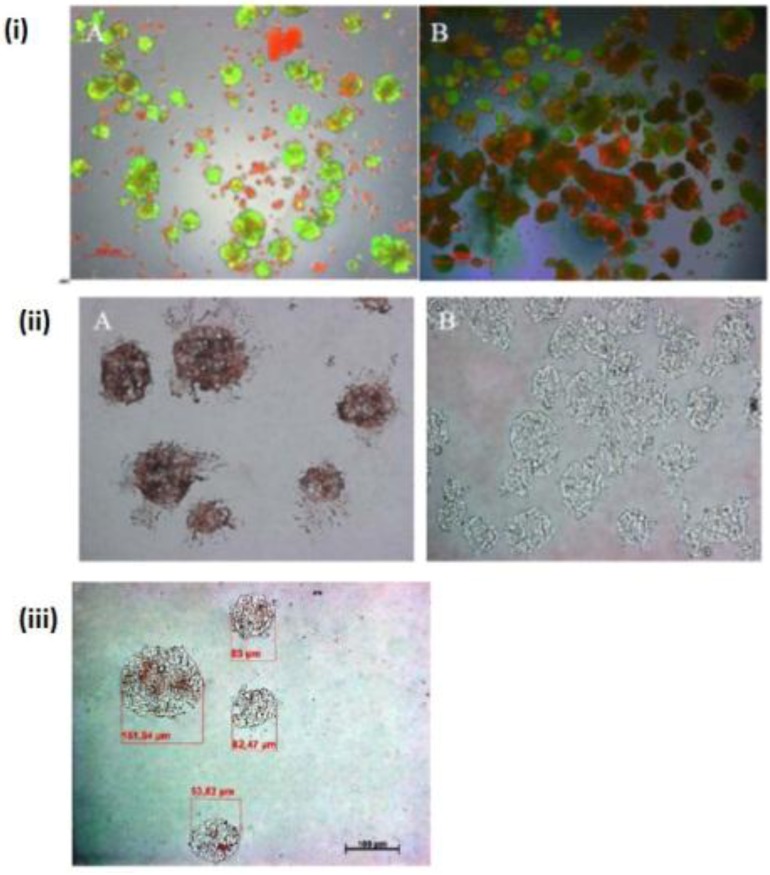
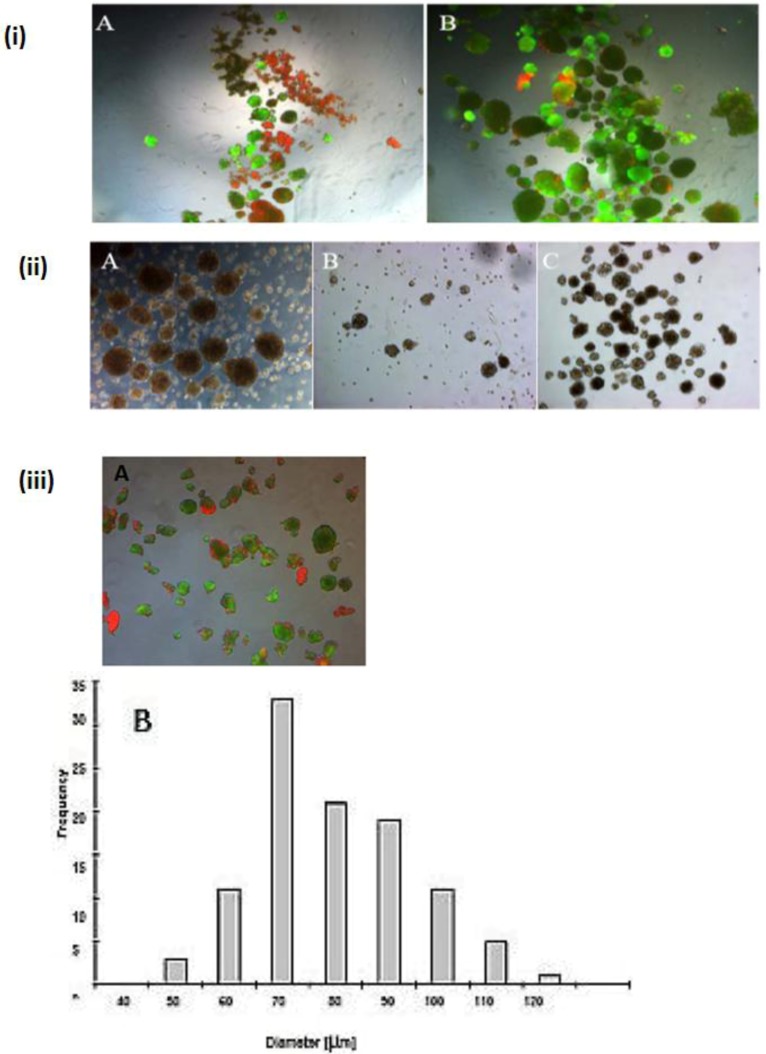
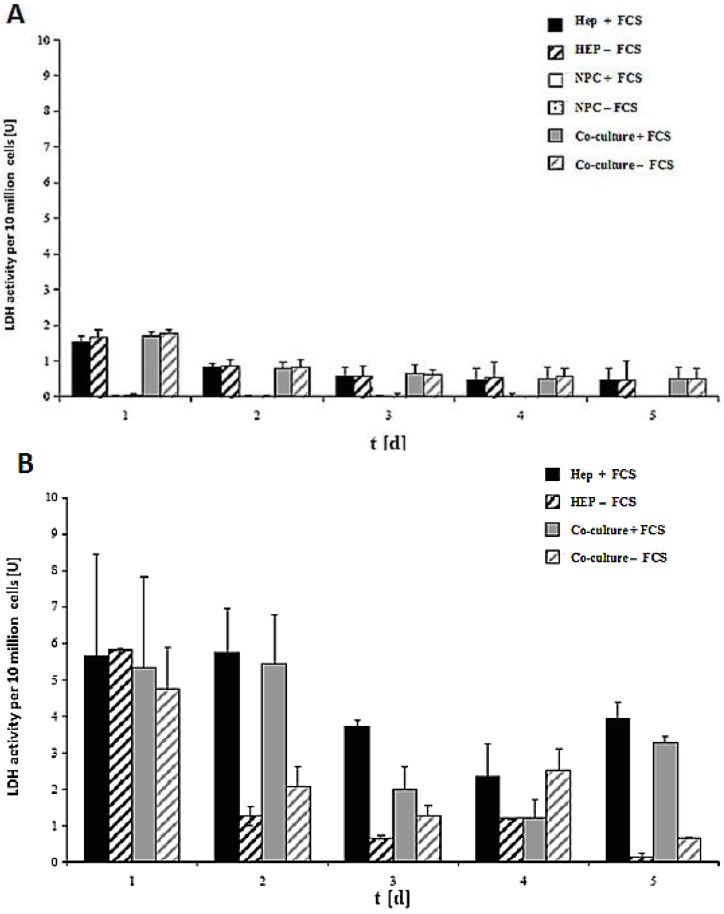
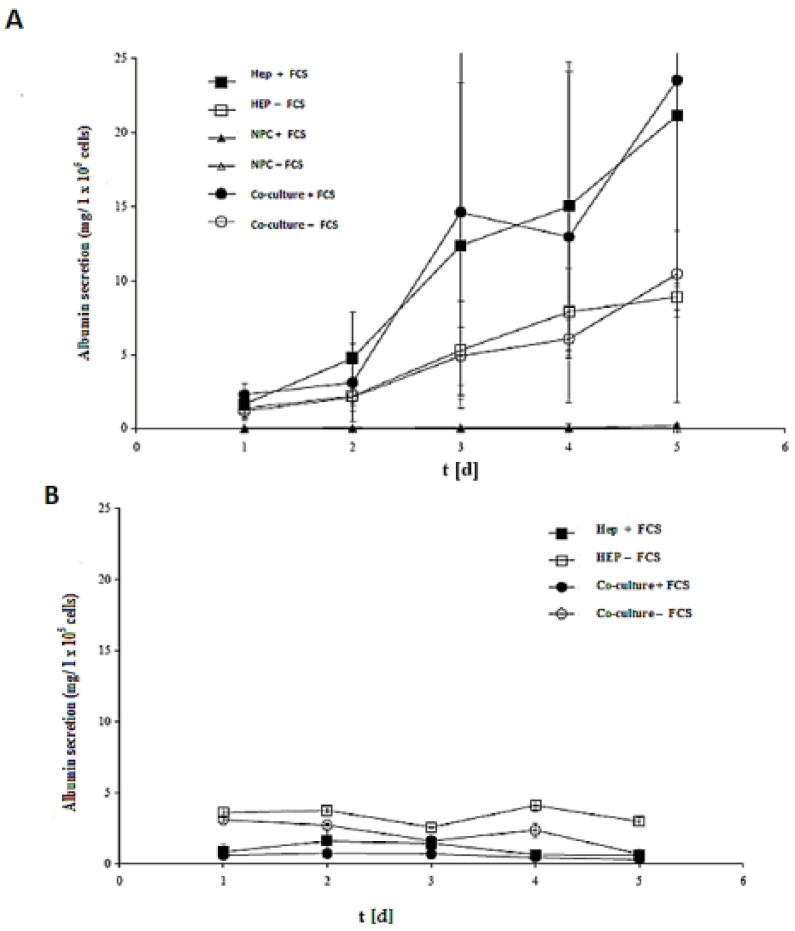
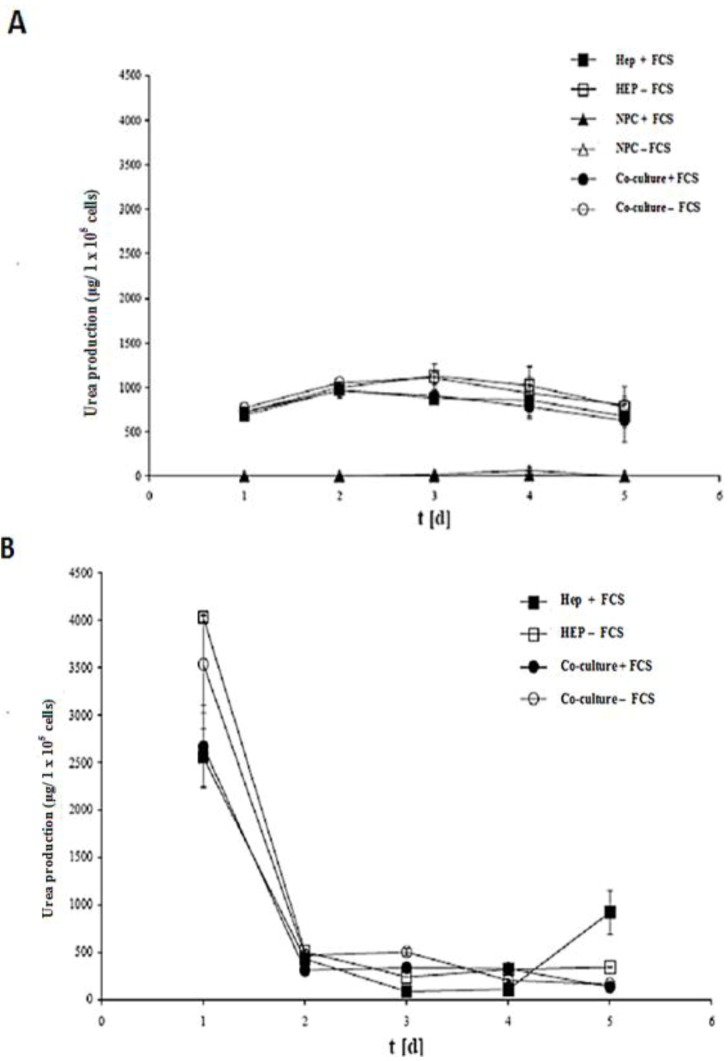
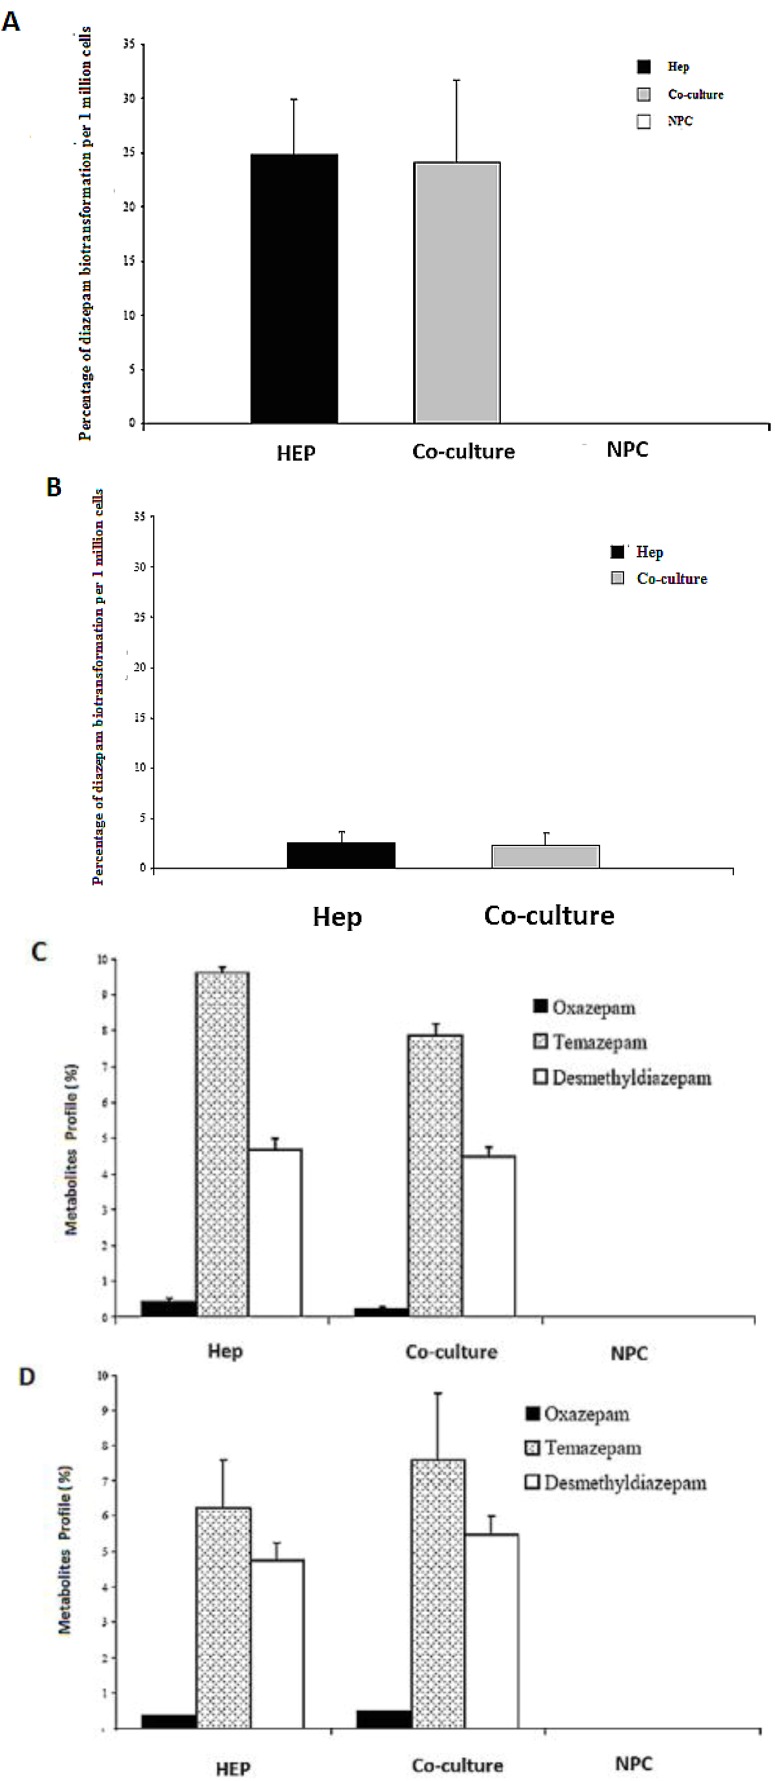
Poly (2-hydroxyethyl methacrylate) (HEMA) has been used as a clinical material, in the form of a soft hydrogel, for various surgical procedures, including endovascular surgery of liver. It is a clear liquid compound and, as a soft, flexible, water-absorbing material, has been used to make soft contact lenses from small, concave, spinning molds. Primary rat hepatocyte spheroids were created on a poly-HEMA-coated surface with the intention of inducing hepatic tissue formation and improving liver functions. We investigated spheroid formation of primary adult rat hepatocyte cells and characterized hepatic-specific functions under the special influence of fetal calf serum (FCS) and nonparencymal cells (NPC) up to six days in different culture systems (e.g., hepatocytes + FCS, hepatocytes - FCS, NPC + FCS, NPC - FCS, co-culture + FCS, co-culture - FCS) in both the spheroid model and sandwich model. Immunohistologically, we detected gap junctions, Ito cell/Kupffer cells, sinusoidal endothelial cells and an extracellular matrix in the spheroid model. FCS has no positive effect in the sandwich model, but has a negative effect in the spheroid model on albumin production, and no influence in urea production in either model. We found more cell viability in smaller diameter spheroids than larger ones by using the apoptosis test. Furthermore, there is no positive influence of the serum or NPC on spheroid formation, suggesting that it may only depend on the physical condition of the culture system. Since the sandwich culture has been considered a "gold standard" in vitro culture model, the hepatocyte spheroids generated on the poly-HEMA-coated surface were compared with those in the sandwich model. Major liver-specific functions, such as albumin secretion and urea synthesis, were evaluated in both the spheroid and sandwich model. The synthesis performance in the spheroid compared to the sandwich culture increases approximately by a factor of 1.5. Disintegration of plasma membranes in both models was measured by lactate dehydrogenase (LDH) release in both models. Additionally, diazepam was used as a substrate in drug metabolism studies to characterize the differences in the biotransformation potential with metabolite profiles in both models. It showed that the diazepam metabolism activities in the spheroid model is about 10-fold lower than the sandwich model. The poly-HEMA-based hepatocyte spheroid is a promising new platform towards hepatic tissue engineering leading to in vitro hepatic tissue formation.
Figures
Similar articles
-
Bioengineered Liver Models for Drug Testing and Cell Differentiation Studies.Cell Mol Gastroenterol Hepatol. 2017 Dec 6;5(3):426-439.e1. doi: 10.1016/j.jcmgh.2017.11.012. eCollection 2018 Mar. Cell Mol Gastroenterol Hepatol. 2017. PMID: 29675458 Free PMC article. Review.
-
Cooperation of liver cells in health and disease.Adv Anat Embryol Cell Biol. 2001;161:III-XIII, 1-151. doi: 10.1007/978-3-642-56553-3. Adv Anat Embryol Cell Biol. 2001. PMID: 11729749 Review.
-
Influence of pancreatic islets on spheroid formation and functions of hepatocytes in hepatocyte-pancreatic islet spheroid culture.Tissue Eng. 2004 Jul-Aug;10(7-8):965-77. doi: 10.1089/ten.2004.10.965. Tissue Eng. 2004. PMID: 15363154
-
Floating or adherent hepatocyte spheroid cultures using microwell chips with polyethylene glycol or polyimide surfaces.Biomed Mater. 2025 Mar 31;20(3). doi: 10.1088/1748-605X/adc17d. Biomed Mater. 2025. PMID: 40096815
-
Efficient fabrication of monodisperse hepatocyte spheroids and encapsulation in hybrid hydrogel with controllable extracellular matrix effect.Biofabrication. 2021 Oct 18;14(1). doi: 10.1088/1758-5090/ac2b89. Biofabrication. 2021. PMID: 34587587
Cited by
-
Bioengineered Liver Models for Drug Testing and Cell Differentiation Studies.Cell Mol Gastroenterol Hepatol. 2017 Dec 6;5(3):426-439.e1. doi: 10.1016/j.jcmgh.2017.11.012. eCollection 2018 Mar. Cell Mol Gastroenterol Hepatol. 2017. PMID: 29675458 Free PMC article. Review.
-
[Effect of shift rotation culture on formation and activity of encapsulated hepatocytes aggregates].Zhejiang Da Xue Xue Bao Yi Xue Ban. 2016 May 25;45(4):403-409. doi: 10.3785/j.issn.1008-9292.2016.07.11. Zhejiang Da Xue Xue Bao Yi Xue Ban. 2016. PMID: 27868414 Free PMC article. Chinese.
-
Advances in Engineered Human Liver Platforms for Drug Metabolism Studies.Drug Metab Dispos. 2018 Nov;46(11):1626-1637. doi: 10.1124/dmd.118.083295. Epub 2018 Aug 22. Drug Metab Dispos. 2018. PMID: 30135245 Free PMC article.
-
Natural and Synthetic Biomaterials for Engineering Multicellular Tumor Spheroids.Polymers (Basel). 2020 Oct 28;12(11):2506. doi: 10.3390/polym12112506. Polymers (Basel). 2020. PMID: 33126468 Free PMC article. Review.
-
Applications of Biomaterials in 3D Cell Culture and Contributions of 3D Cell Culture to Drug Development and Basic Biomedical Research.Int J Mol Sci. 2021 Mar 2;22(5):2491. doi: 10.3390/ijms22052491. Int J Mol Sci. 2021. PMID: 33801273 Free PMC article. Review.
References
-
- Wu F.J., Friend J.R., Remmel R.P., Cerra F.B., Hu W.S. Enhanced cytochrome P450 1A1 activity of selfassembled rat hepatocyte spheroids. Cell Transplant. 1999;8:233–246. - PubMed
-
- Koide N., Sakaguchi K., Koide Y., Asano K., Kawaguchi M., Matsushima H., Takenami T., Shinji T., Mori M., Tsuji T. Formation of multicellular spheroids composed of adult rat hepatocytes in dishes with positively charged surfaces and under other nonadherent environments. Exp. Cell Res. 1990;186:227–235. doi: 10.1016/0014-4827(90)90300-Y. - DOI - PubMed
-
- Peshwa M.V., Wu F.J., Follstad B.D., Cerra F.B., Hu W.S. Kinetics of hepatocyte spheroid formation. Biotechnol. Prog. 1994;10:460–466. doi: 10.1021/bp00029a002. - DOI
LinkOut - more resources
Full Text Sources
Other Literature Sources
Miscellaneous
