. 2013 Sep 24;3(3):703-32.
doi: 10.3390/biom3030703.

Biophysical Characterization of α-Synuclein and Rotenone Interaction

Affiliations

Biophysical Characterization of α-Synuclein and Rotenone Interaction

Blanca A Silva et al. Biomolecules. .

Abstract

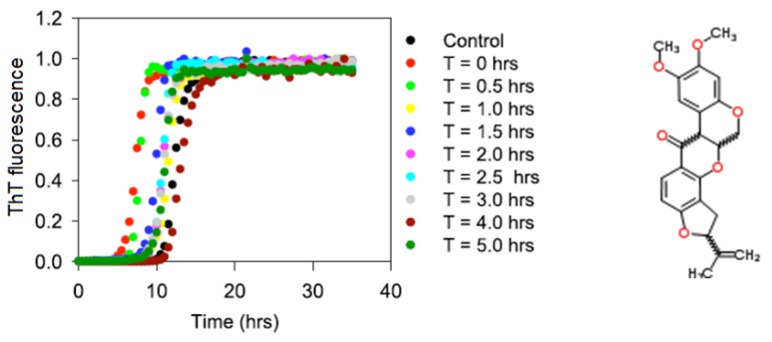
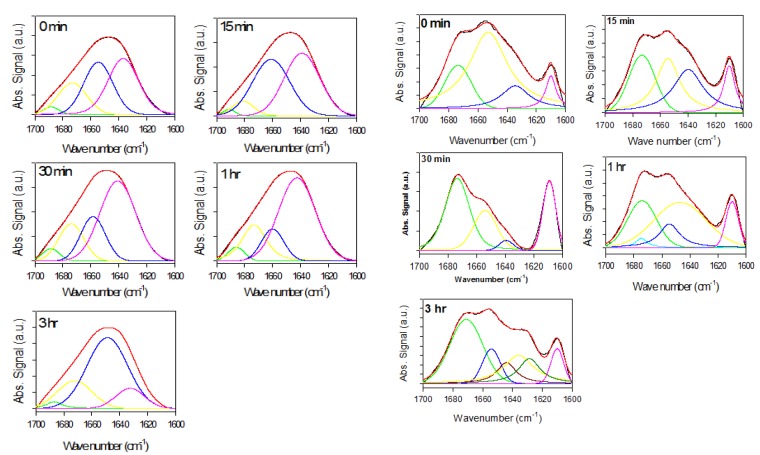
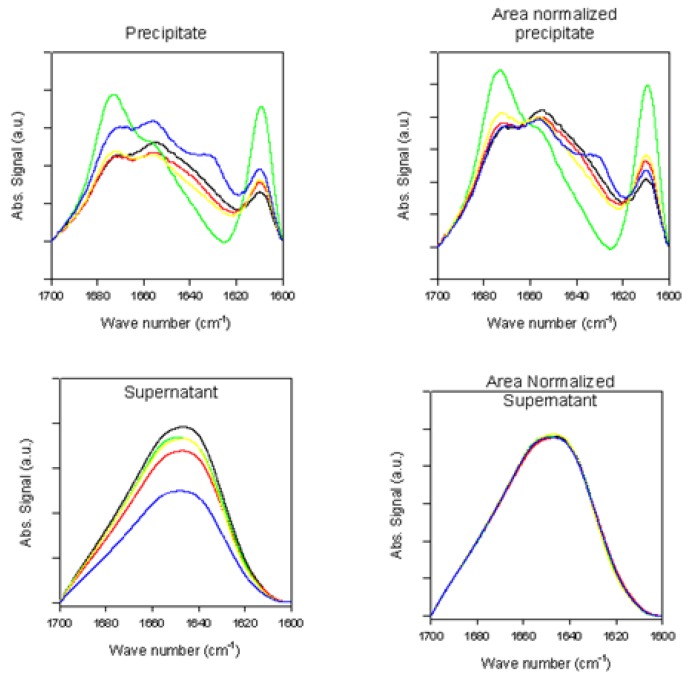
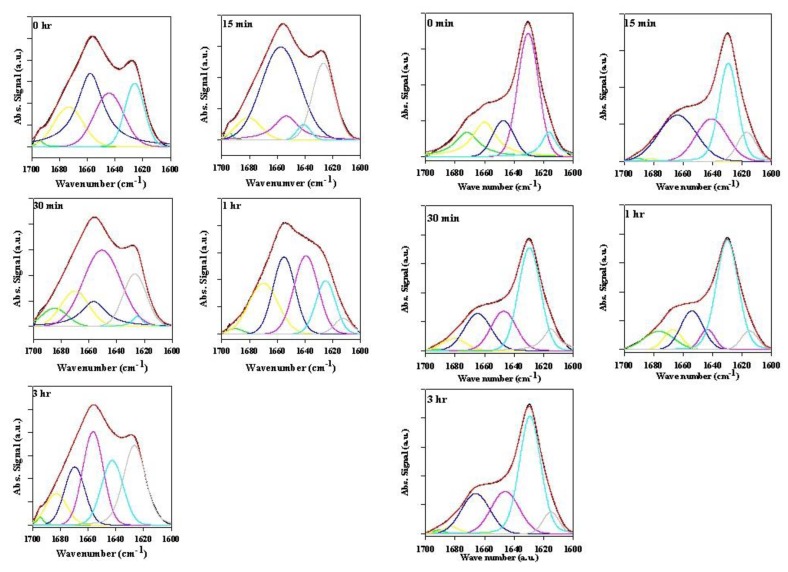
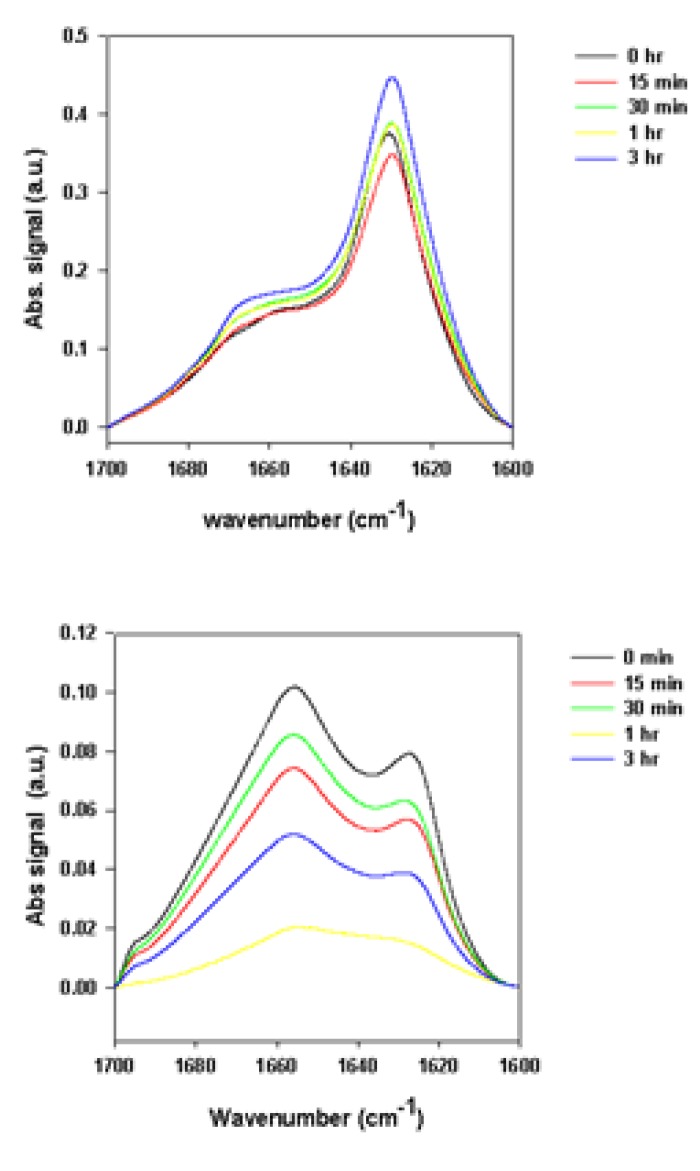
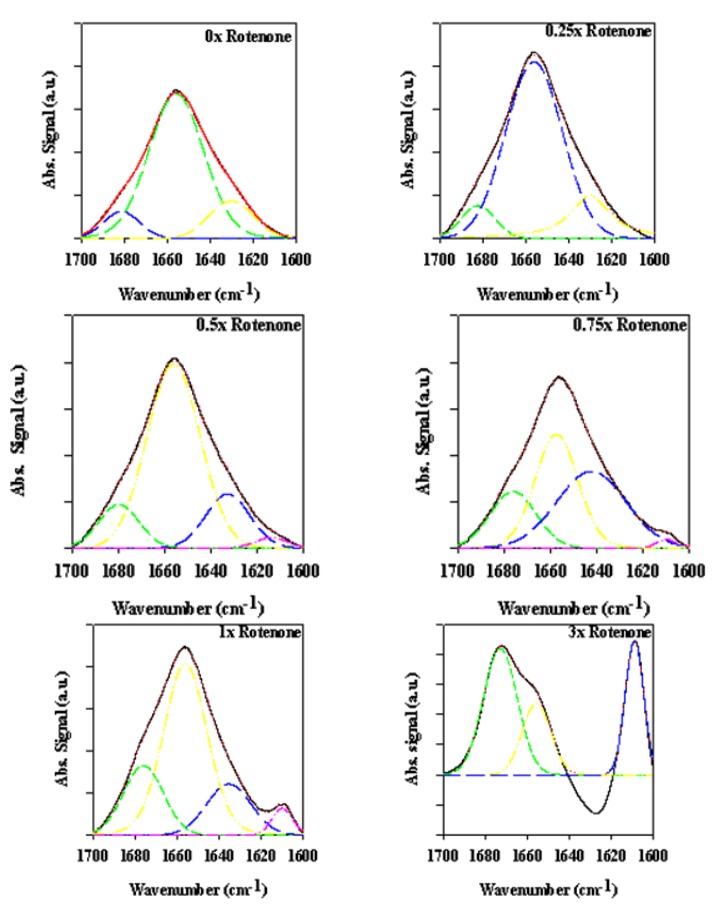
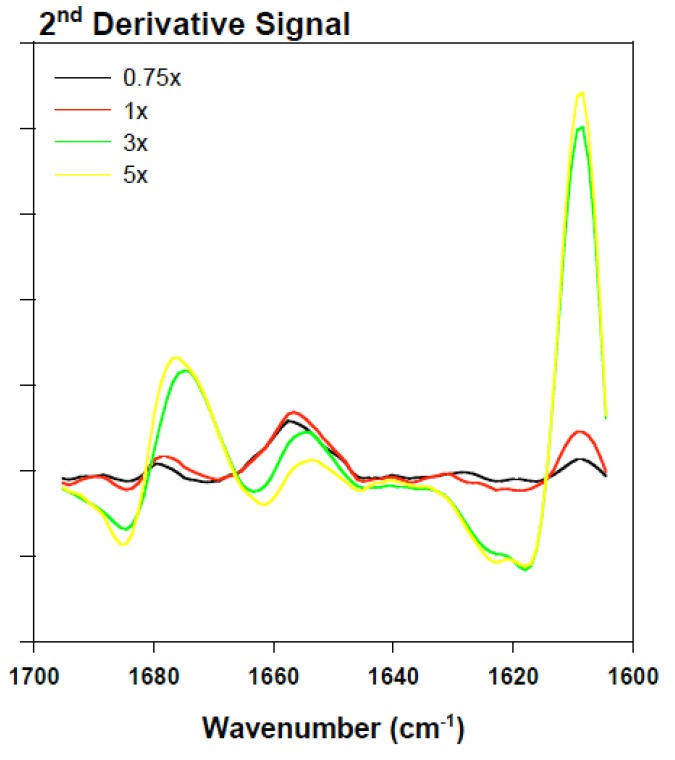
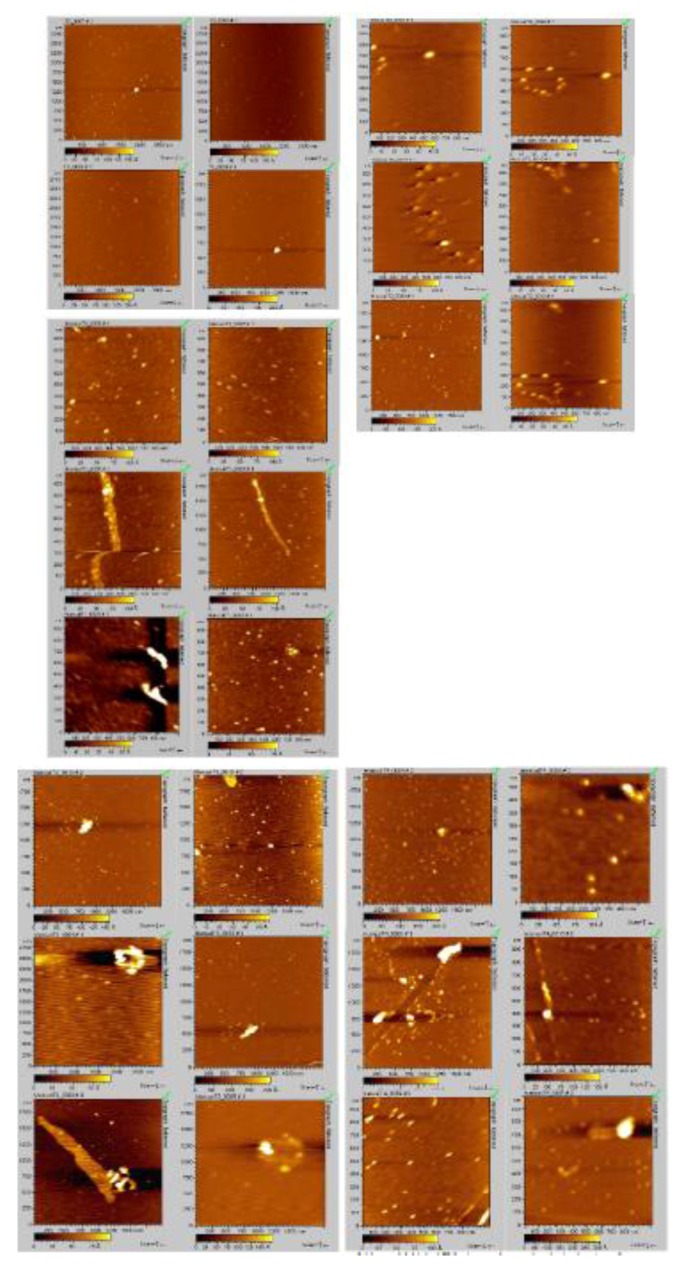
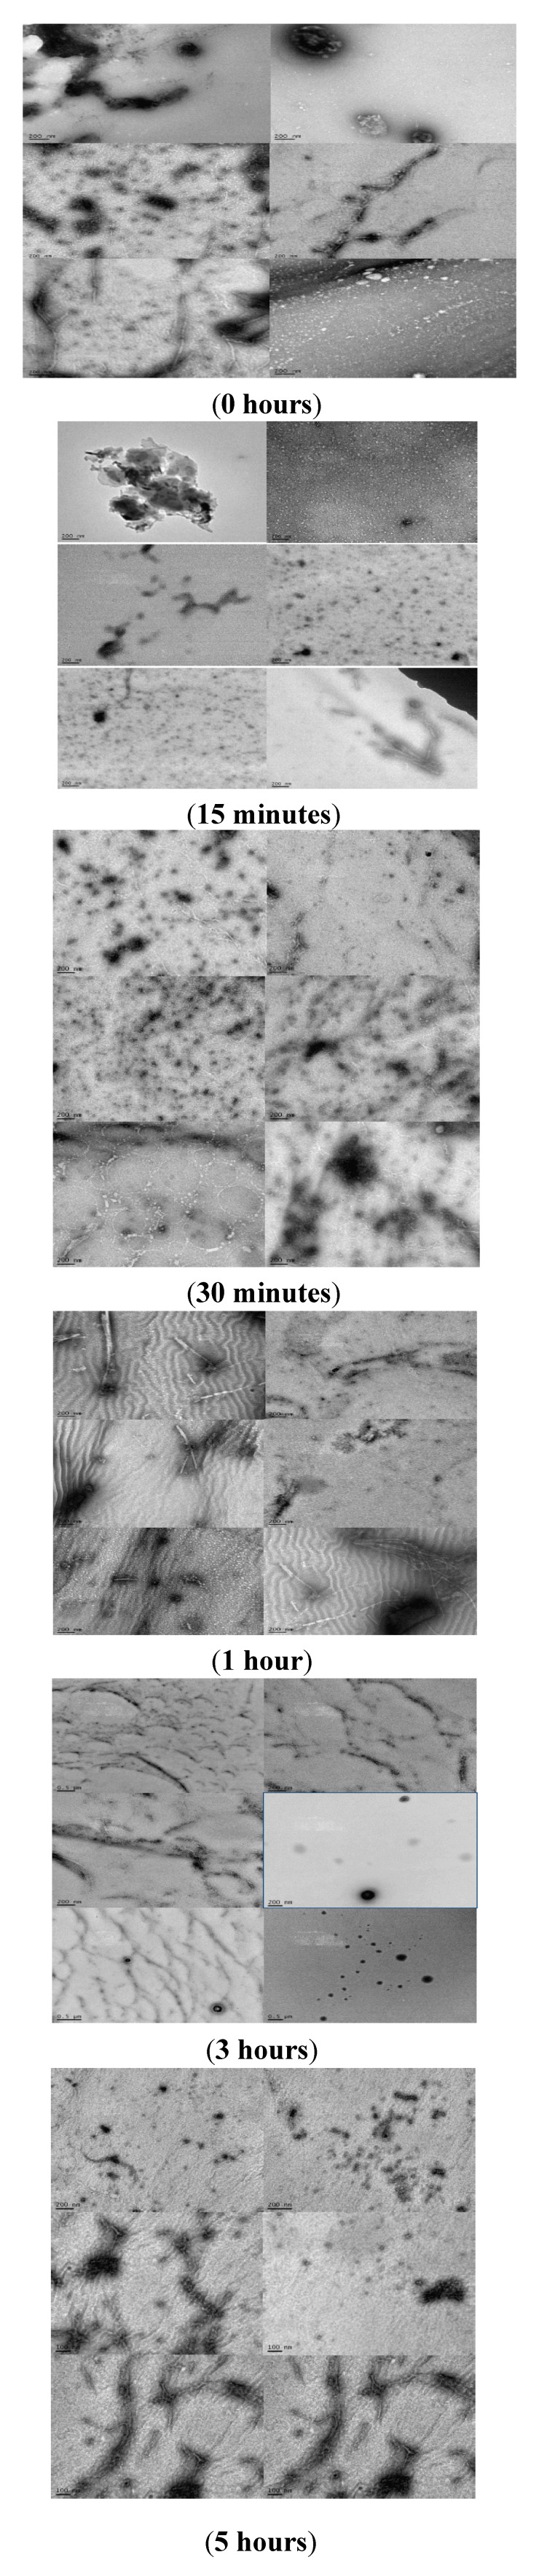
Previous studies revealed that pesticides interact with α-synuclein and accelerate the rate of fibrillation. These results are consistent with the prevailing hypothesis that the direct interaction of α-synuclein with pesticides is one of many suspected factors leading to α-synuclein fibrillation and ultimately to Parkinson's disease. In this study, the biophysical properties and fibrillation kinetics of α-synuclein in the presence of rotenone were investigated and, more specifically, the effects of rotenone on the early-stage misfolded forms of α-synuclein were considered. The thioflavine T (ThT) fluorescence assay studies provide evidence that early-phase misfolded α-synuclein forms are affected by rotenone and that the fibrillation process is accelerated. Further characterization by attenuated total reflectance Fourier transform infrared spectroscopy (ATR-FTIR) shows that rotenone increases the amount of ordered secondary structure in this intrinsically disordered protein. Morphological characterization by transmission electron microscopy (TEM) and atomic force microscopy (AFM) provide visualization of the differences in the aggregated α-synuclein species developing during the early kinetics of the fibrillation process in the absence and presence of rotenone. We believe that these data provide useful information for a better understanding of the molecular basis of rotenone-induced misfolding and aggregation of α-synuclein.


Figures

Figure 1
Figure 1
The effects of rotenone on α-synuclein fibrillation. T indicates the time during the fibrillation process at which rotenone was introduced. Chemical formula of rotenone is shown to the right.
Figure 2
Figure 2
Attenuated total reflectance Fourier transform infrared spectroscopy (ATR-FTIR) spectra of supernatant samples (left panels) and precipitate samples (right panels) taken at time of rotenone addition. Black curves are experimental signals; red curves are fits. Signals under curve represent deconvoluted experimental curve-fit signals bands used to determine structural content in a given sample and positioned at ~1635 cm−1 (pink lines), ~1657 cm−1 (blue lines), ~1678 cm−1 (yellow lines), ~1695 cm−1 (green lines).
Figure 3
Figure 3
Superimposed ATR-FTIR spectra of precipitate samples (top panels) and supernatant samples (bottom panels) taken at time of rotenone addition (black, red green, yellow and blue curves correspond to measurements taken at 0, 0.25, 0.5, 1, and 3 h, respectively).
Figure 4
Figure 4
ATR-FTIR spectra of supernatant samples (left panels) and precipitate samples (right panels) taken at the end of the fibrillation process.
Figure 5
Figure 5
Superimposed ATR-FTIR spectra of precipitate samples (top panels) and supernatant samples (bottom panels) taken at the end of the fibrillation process.
Figure 6
Figure 6
ATR-FTIR spectra of bovine serum albumin (BSA) in the presence of various rotenone equivalents after a 30-min incubation period.
Figure 7
Figure 7
Superimposed inverted BSA second derivative signal in the presence of various rotenone equivalents following a 30-min incubation period.
Figure 8
Figure 8
AFM micrographs obtained at time of rotenone addition: four images, upper left corner, 0 h; six images, upper right corner, 15 min, right; six images, middle left side, 30 min; six images, bottom left corner, 1 h; six images, bottom right corner, 3 h.
Figure 9
Figure 9
Multiple TEM micrographs, samples obtained at time of rotenone addition: 0 h; 15 min; 30 min; 1 h; 3 h; 5 h.

References

    1. Brown R.C., Lockwood A.H., Sonawane B.R. Neurodegenerative diseases: An overview of environmental risk factors. Environ. Health Perspect. 2005;113:1250–1256. doi: 10.1289/ehp.7567. - DOI - PMC - PubMed
    1. Findley L.J. The economic impact of Parkinson’s disease. Parkinsonism Relat. Disord. 2007;13:S8–S12. doi: 10.1016/j.parkreldis.2007.06.003. - DOI - PubMed
    1. Uversky V.N. Neuropathology and neurochemistry of Parkinson’s disease: The never-ending story or the story with no beginning? Minerva Psichiatr. 2009;50:1–26.
    1. Uversky V.N., Fink A.L. Biophysical Properties of Human Alpha-Synuclein and its Role in Parkinson’s Disease. In: Pandalai S.G., editor. Recent Research Developments in Proteins. Transworld Research Network; Kerala, India: 2002. pp. 153–186.
    1. Tanner C.M., Goldman S.M. Epidemiology of Parkinson’s disease. Neurol. Clin. 1996;14:317–335. doi: 10.1016/S0733-8619(05)70259-0. - DOI - PMC - PubMed