. 2014 Jun 26;4(9):1635-45.
doi: 10.1534/g3.114.012757.

Fine-mapping and selective sweep analysis of QTL for cold tolerance in Drosophila melanogaster

Affiliations

Fine-mapping and selective sweep analysis of QTL for cold tolerance in Drosophila melanogaster

Ricardo Wilches et al. G3 (Bethesda). .

Abstract

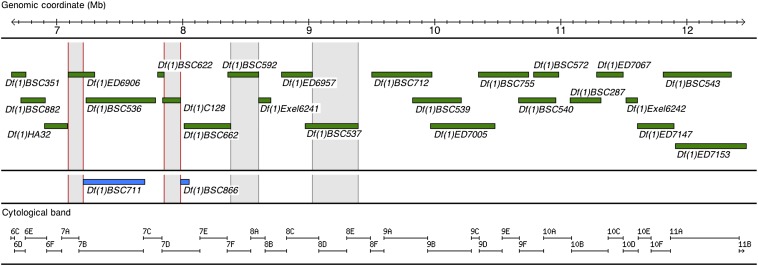
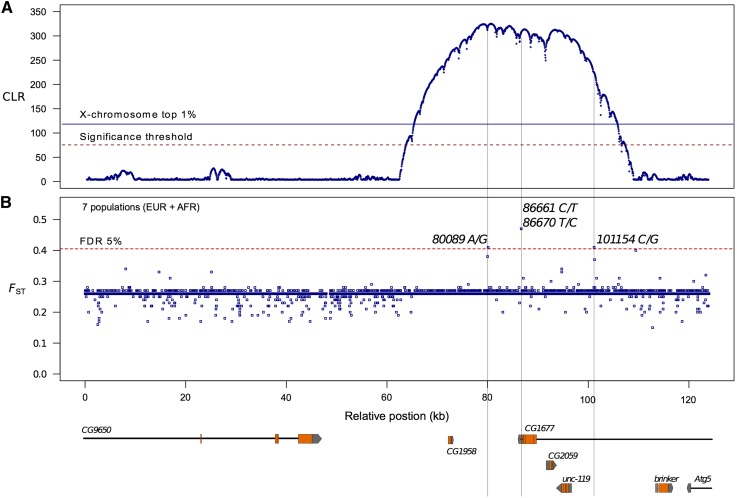
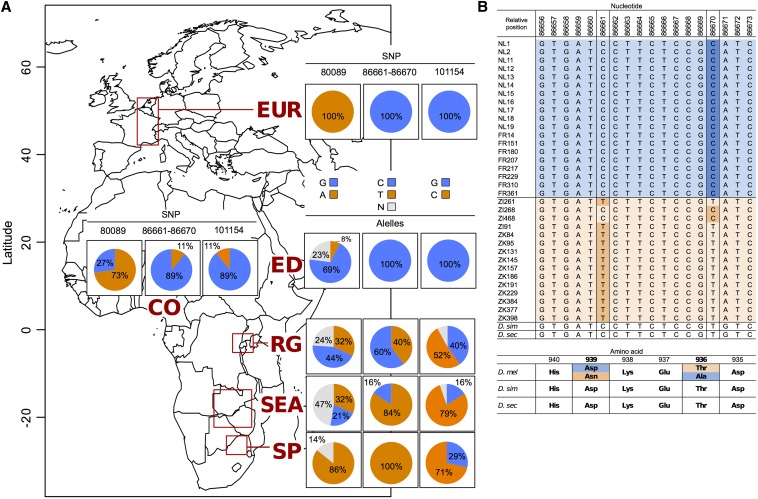
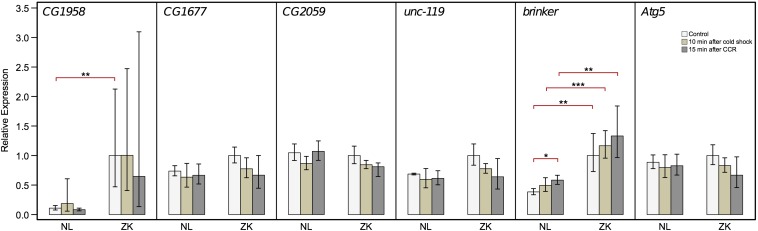
There is a growing interest in investigating the relationship between genes with signatures of natural selection and genes identified in QTL mapping studies using combined population and quantitative genetics approaches. We dissected an X-linked interval of 6.2 Mb, which contains two QTL underlying variation in chill coma recovery time (CCRT) in Drosophila melanogaster from temperate (European) and tropical (African) regions. This resulted in two relatively small regions of 131 kb and 124 kb. The latter one co-localizes with a very strong selective sweep in the European population. We examined the genes within and near the sweep region individually using gene expression analysis and P-element insertion lines. Of the genes overlapping with the sweep, none appears to be related to CCRT. However, we have identified a new candidate gene of CCRT, brinker, which is located just outside the sweep region and is inducible by cold stress. We discuss these results in light of recent population genetics theories on quantitative traits.

Keywords: QTL; brinker; cold tolerance; fine-mapping; selective sweep.


Figures

Figure 1
Figure 1
Map of tested deletions within the QTL interval undergoing study. All deletions, represented by green or blue bars, span a 5.8-Mb fraction of the 6.2-Mb-long interval of interest on the X-chromosome. Deletion breakpoints at the base pair level are known for all deletions except Df(1)HA32 and Df(1)C128, for which only cytological bands are reported. Both physical and cytological coordinates are provided. The 24 deletions represented in green represent the minimum available set spanning the 5.8-Mb QTL interval; deletions in blue were tested on failure to complement of one of the overlapping deletions in green. Fractions of the QTL interval with light gray shading indicate regions of interest under deletions that show failure to complement. Red borders of this gray background indicate highly significant failure to complement (P < 0.01).
Figure 2
Figure 2
Evidence of positive selection and candidate SNPs in the 124-kb region under deletion Df(1)ED6906. (A) Likelihood (CLR) profile along the 124-kb on the X-chromosome using SNP data of two pooled European D. melanogaster from the Netherlands and France. Two significance thresholds are depicted. The solid line corresponds to the average of the top 1% CLR values for the X-chromosome in Europe and the dashed red line represents the significance threshold from simulations of equivalent subgenomic regions. (B) Model-based FST values for 7316 SNPs from a dataset including two European and five African samples (see Materials and Methods). Top SNPs (above the false discovery rate of 5%) are marked with position and a thin continuous line across panels.
Figure 3
Figure 3
Allele frequency change at highly differentiated SNPs at the QTL of interest. (A) Allele frequencies of the top four highly differentiated SNPs across seven different populations along a latitudinal gradient. Populations are as follows: the Netherlands and France (EUR), Ethiopia (ED), Cameroon (CO), Rwanda (RG), Southeast Africa (SEA), and South Africa (SP) (see Materials and Methods). (B) European and Southeast African D. melanogaster haplotypes for the two nonsynonymous SNPs (86,661–86,670) in intron 5 of gene CG1677. These two SNPs correspond to amino acid positions 939 and 936.
Figure 4
Figure 4
Expression of genes located in the region under deletion Df(1)ED6906 that was affected by positive selection (see Figure 2A). Relative expression was measured under two cold stress and control conditions in pools of flies from a temperate population [the Netherlands (NL)] and a tropical population [Zimbabwe (ZK)]. Expression levels of these candidate genes were normalized with respect to that of the ribosomal genes RpS20 and RpL32. The height of the bars represents the mean of three calibrated normalized relative quantities (CNRQ) per pool per gene rescaled to that of the corresponding ZK control. Error bars also represent rescaled confidence intervals. Levels of significance for tests of differences in expression levels among treatments within and between populations are indicated with asterisks: *P < 0.05; **P < 0.01; and ***P < 0.001.

References

    1. Axelsson E., Ratnakumar A., Arendt M.-L., Maqbool K., Webster M. T., et al. , 2013. The genomic signature of dog domestication reveals adaptation to a starch-rich diet. Nature 495: 360–364 - PubMed
    1. Barton N. H., Keightley P. D., 2002. Understanding quantitative genetic variation. Nat. Rev. Genet. 3: 11–21 - PubMed
    1. Benjamini Y., Hochberg Y., 1995. Controlling the false discovery rate: a practical and powerful approach to multiple testing. J. R. Stat. Soc., B 57: 289–300
    1. Boitard S., Schlötterer C., Nolte V., Pandey R. V., Futschik A., 2012. Detecting selective sweeps from pooled next-generation sequencing samples. Mol. Biol. Evol. 29: 2177–2186 - PMC - PubMed
    1. Cano J. M., Matsuba C., Mäkinen H., Merilä J., 2006. The utility of QTL-linked markers to detect selective sweeps in natural populations—a case study of the EDA gene and a linked marker in threespine stickleback. Mol. Ecol. 15: 4613–4621 - PubMed

Publication types

LinkOut - more resources