

Relative roles of weather variables and change in human population in malaria: comparison over different states of India
- PMID: 24971510
- PMCID: PMC4074030
- DOI: 10.1371/journal.pone.0099867
Relative roles of weather variables and change in human population in malaria: comparison over different states of India
Abstract
Background: Pro-active and effective control as well as quantitative assessment of impact of climate change on malaria requires identification of the major drivers of the epidemic. Malaria depends on vector abundance which, in turn, depends on a combination of weather variables. However, there remain several gaps in our understanding and assessment of malaria in a changing climate. Most of the studies have considered weekly or even monthly mean values of weather variables, while the malaria vector is sensitive to daily variations. Secondly, rarely all the relevant meteorological variables have been considered together. An important question is the relative roles of weather variables (vector abundance) and change in host (human) population, in the change in disease load.
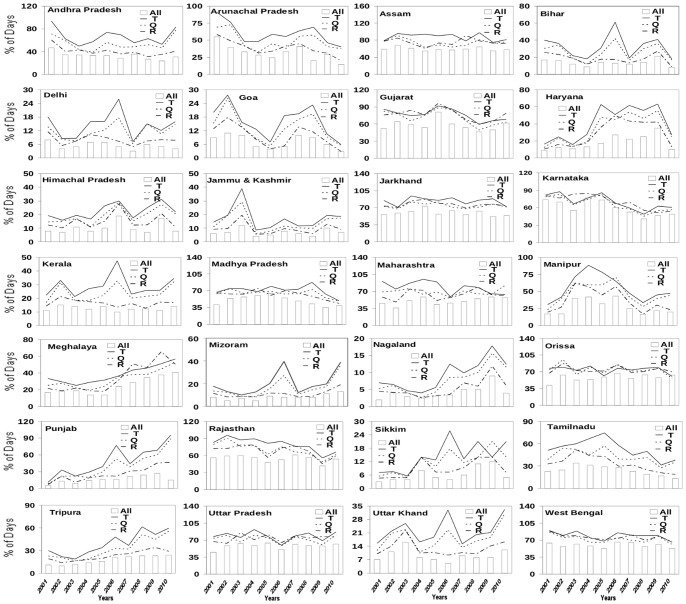
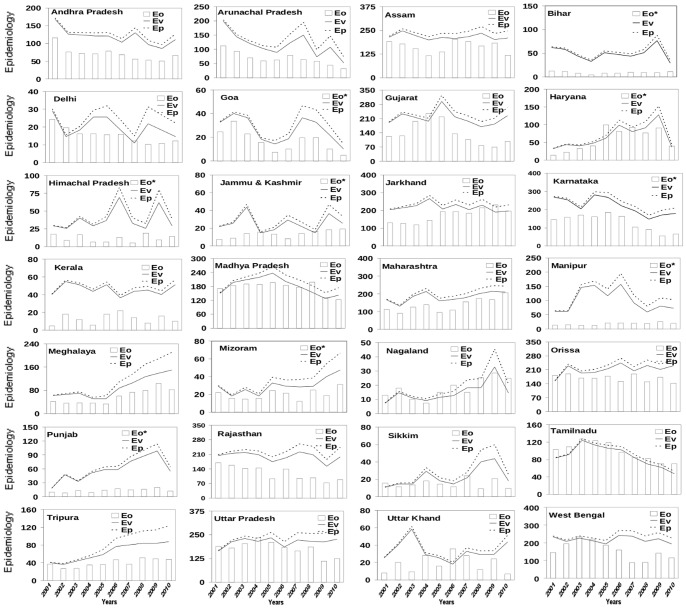
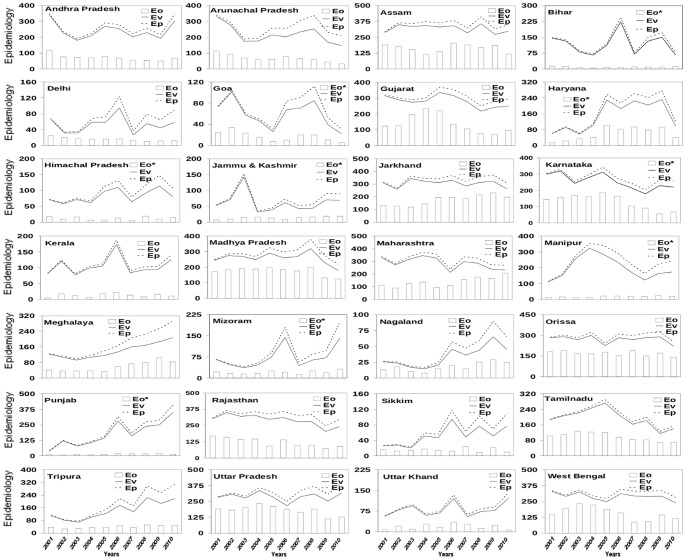
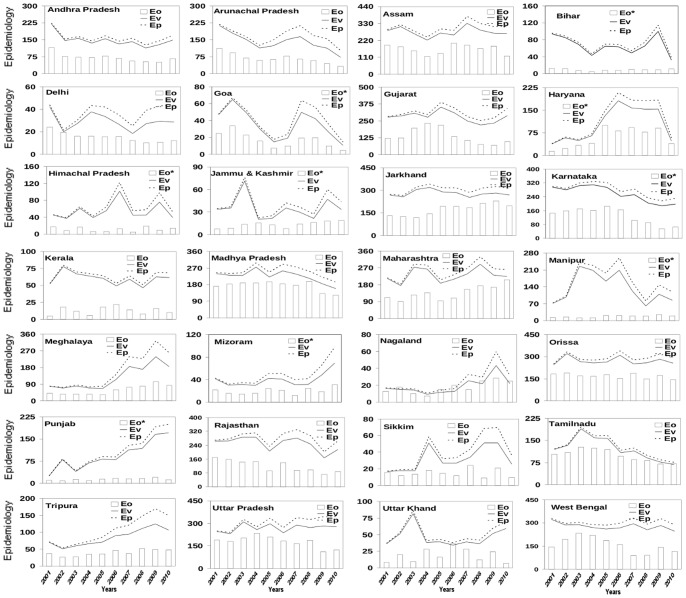
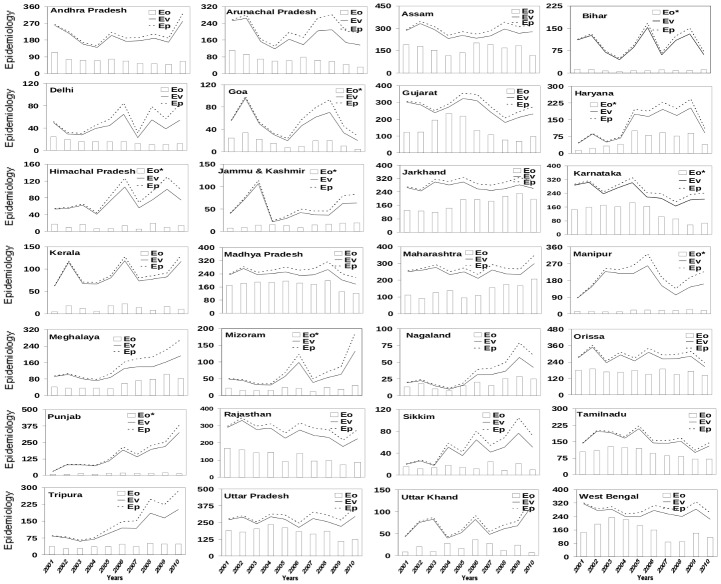
Method: We consider the 28 states of India, characterized by diverse climatic zones and changing population as well as complex variability in malaria, as a natural test bed. An annual vector load for each of the 28 states is defined based on the number of vector genesis days computed using daily values of temperature, rainfall and humidity from NCEP daily Reanalysis; a prediction of potential malaria load is defined by taking into consideration changes in the human population and compared with the reported number of malaria cases.
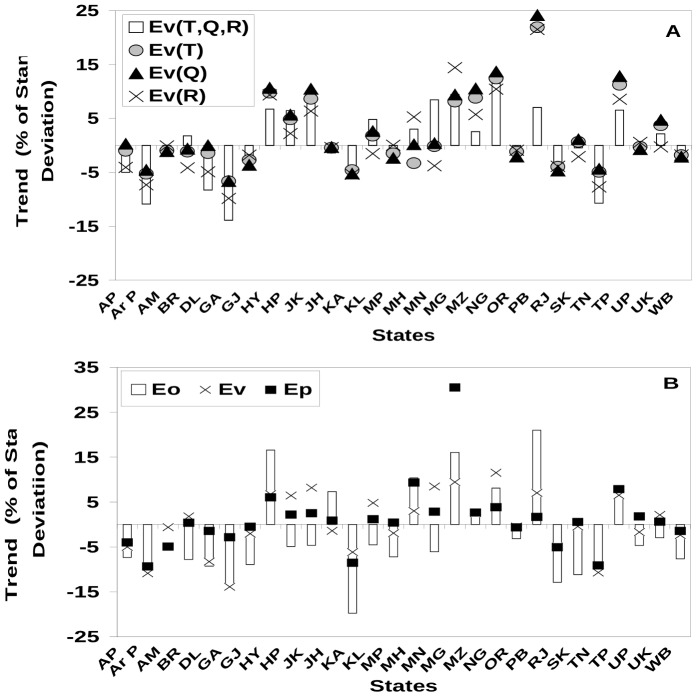
Results: For most states, the number of malaria cases is very well correlated with the vector load calculated with the combined conditions of daily values of temperature, rainfall and humidity; no single weather variable has any significant association with the observed disease prevalence.
Conclusion: The association between vector-load and daily values of weather variables is robust and holds for different climatic regions (states of India). Thus use of all the three weather variables provides a reliable means of pro-active and efficient vector sanitation and control as well as assessment of impact of climate change on malaria.
Conflict of interest statement
Figures
Similar articles
-
A model of malaria epidemiology involving weather, exposure and transmission applied to north East India.PLoS One. 2012;7(11):e49713. doi: 10.1371/journal.pone.0049713. Epub 2012 Nov 27. PLoS One. 2012. PMID: 23209594 Free PMC article.
-
Association between climatic variables and malaria incidence: a study in Kokrajhar district of Assam, India.Glob J Health Sci. 2012 Nov 11;5(1):90-106. doi: 10.5539/gjhs.v5n1p90. Glob J Health Sci. 2012. PMID: 23283041 Free PMC article.
-
Impact of climatic factors on the occurrence of malaria in hyper, high, moderate and low endemic States in India from 1995 to 2023.Malar J. 2025 Apr 7;24(1):113. doi: 10.1186/s12936-025-05326-5. Malar J. 2025. PMID: 40197352 Free PMC article.
-
El Niño and associated outbreaks of severe malaria in highland populations in Irian Jaya, Indonesia: a review and epidemiological perspective.Southeast Asian J Trop Med Public Health. 1999 Dec;30(4):608-19. Southeast Asian J Trop Med Public Health. 1999. PMID: 10928348 Review.
-
Abstruse Side of Climate Change, Impact on Malaria: A Systematic Evidence Review Comparing Iran versus Globally.Iran J Public Health. 2024 May;53(5):1047-1057. doi: 10.18502/ijph.v53i5.15584. Iran J Public Health. 2024. PMID: 38912133 Free PMC article. Review.
Cited by
-
[Climate-sensitive diseases in Brazil and the world: systematic reviewEnfermedades sensibles al clima en Brasil y el mundo: revisión sistemática].Rev Panam Salud Publica. 2018 Jul 20;42:e85. doi: 10.26633/RPSP.2018.85. eCollection 2018. Rev Panam Salud Publica. 2018. PMID: 31093113 Free PMC article. Review. Portuguese.
-
Statistical Modelling of the Effects of Weather Factors on Malaria Occurrence in Abuja, Nigeria.Int J Environ Res Public Health. 2020 May 16;17(10):3474. doi: 10.3390/ijerph17103474. Int J Environ Res Public Health. 2020. PMID: 32429373 Free PMC article.
-
Towards seasonal forecasting of malaria in India.Malar J. 2014 Aug 10;13:310. doi: 10.1186/1475-2875-13-310. Malar J. 2014. PMID: 25108445 Free PMC article.
-
Descriptive, Hospital-Based, 10-Year Study of Malaria Transmission in Goa, a Southwest Indian State in the Malaria Elimination Phase.Am J Trop Med Hyg. 2024 May 7;111(1):11-25. doi: 10.4269/ajtmh.23-0828. Print 2024 Jul 3. Am J Trop Med Hyg. 2024. PMID: 38714193 Free PMC article.
-
Biology, distribution and control of Anopheles (Cellia) minimus in the context of malaria transmission in northeastern India.Parasit Vectors. 2016 Nov 15;9(1):585. doi: 10.1186/s13071-016-1878-6. Parasit Vectors. 2016. PMID: 27846911 Free PMC article. Review.
References
-
- Epstein PR, Diaz HF, Elias S, Grabherr G, Graham NE, et al. (1998) Biological and physical signs of climate change: focus on mosquito-borne diseases. Bull Am Meteorol Soc 79: 3.
-
- Hunter PR (2003) Climate change and waterborne and vector-borne disease. Journal of Applied Microbiology 94: 37–46. - PubMed
-
- Matsuoka Y, Kai K (1994) An estimation of climatic change effects on malaria. Journal of Global Environmental Engineering 1: 1–15.
-
- Leaf A (1989) Potential health effects of global climate and environmental changes. New England Journal of Medicine 321: 1577–1583. - PubMed
Publication types
MeSH terms
LinkOut - more resources
Full Text Sources
Other Literature Sources
Medical
