. 2014 Oct 1;99(100):509-24.
doi: 10.1016/j.neuroimage.2014.06.042. Epub 2014 Jun 24.

Correspondences between retinotopic areas and myelin maps in human visual cortex

Affiliations

Correspondences between retinotopic areas and myelin maps in human visual cortex

Rouhollah O Abdollahi et al. Neuroimage. .

Abstract

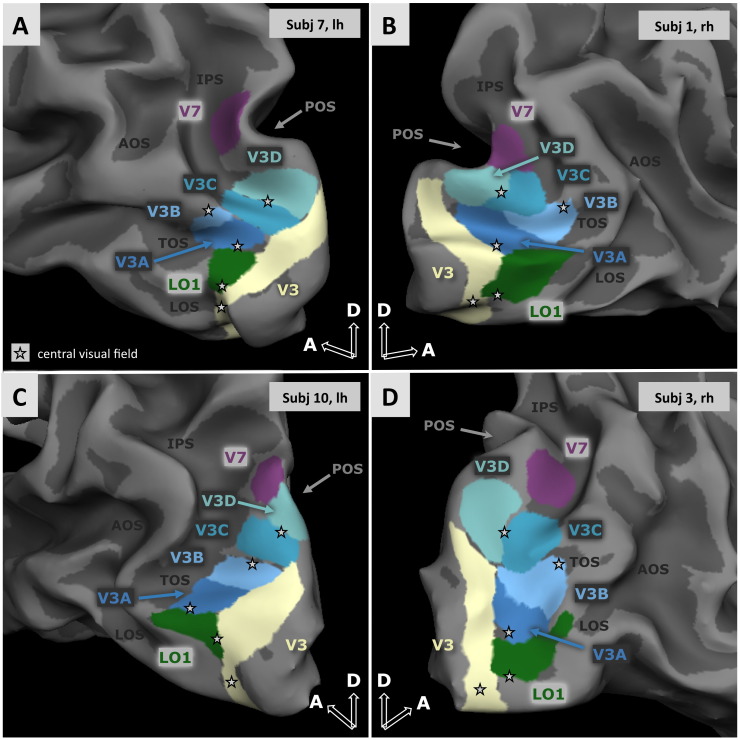
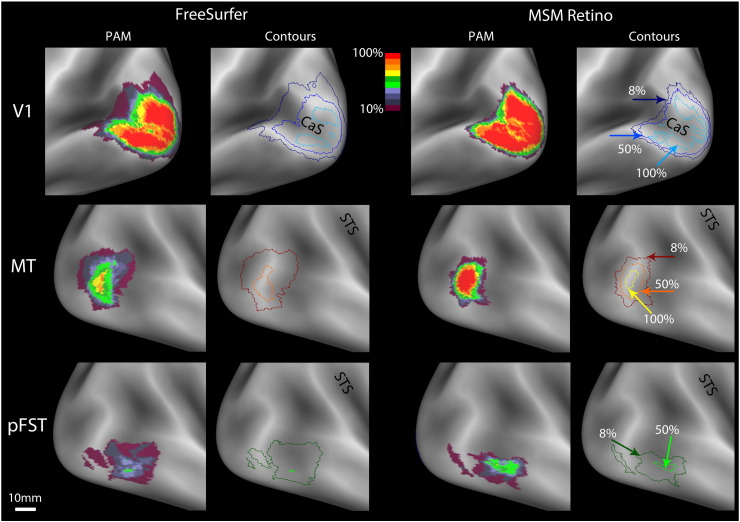
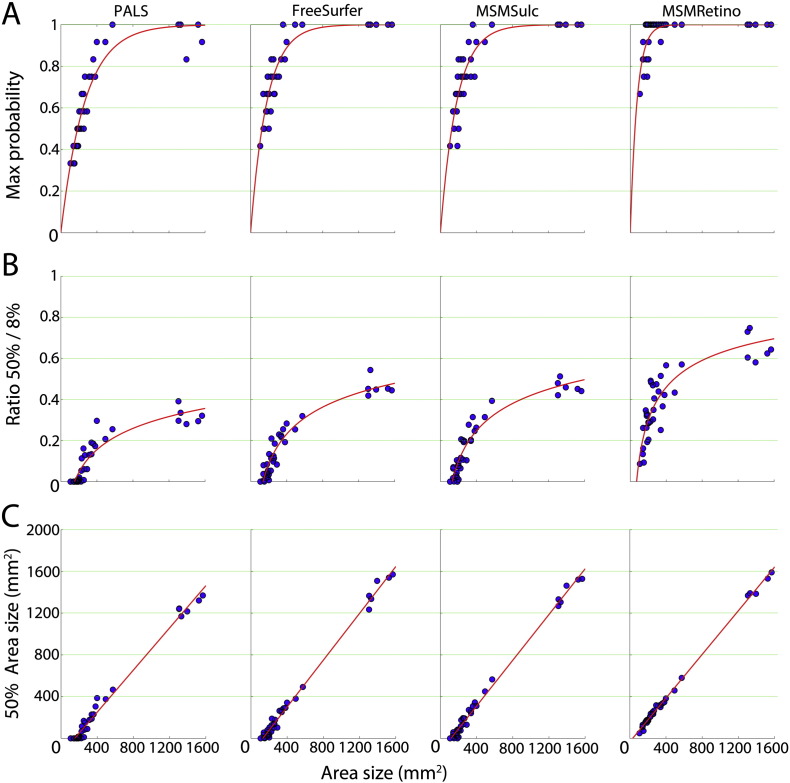
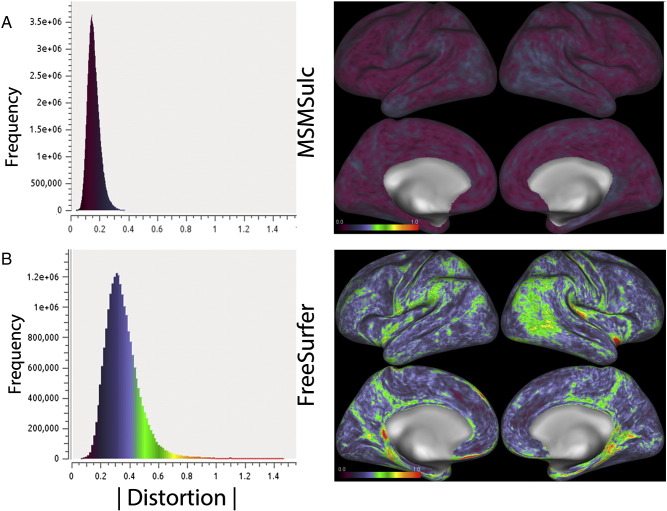
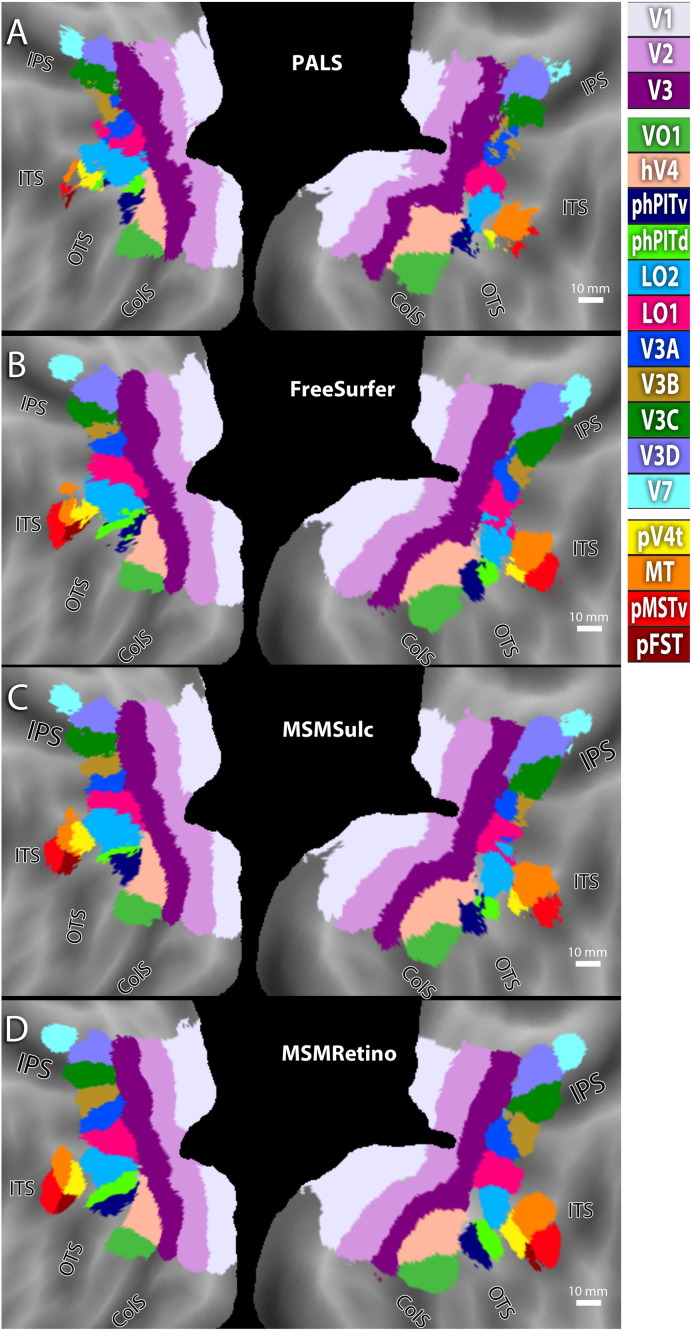
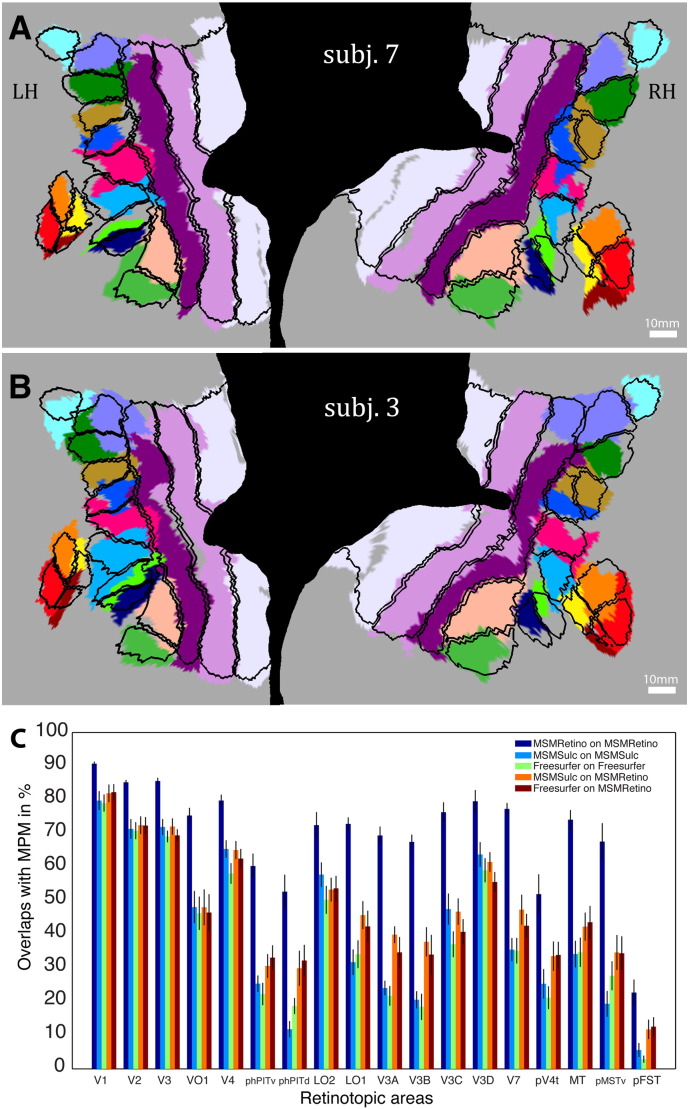
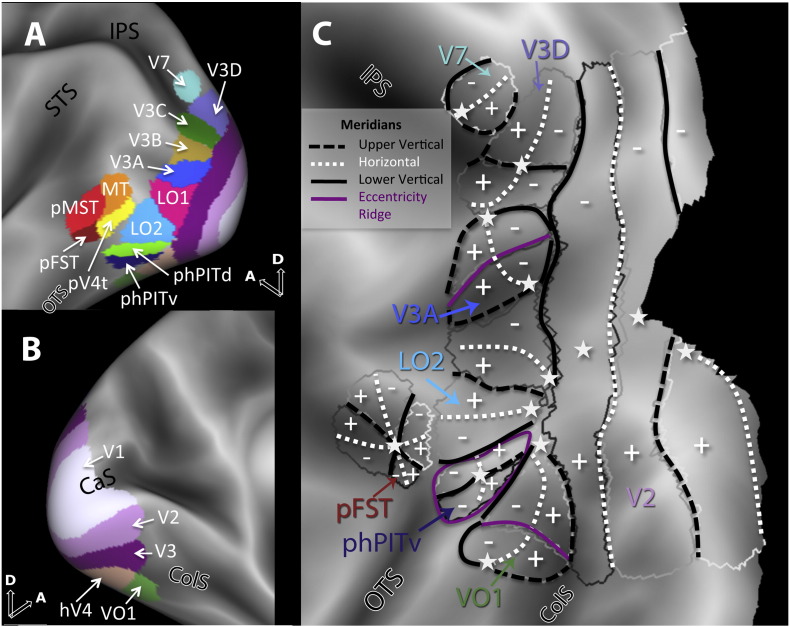
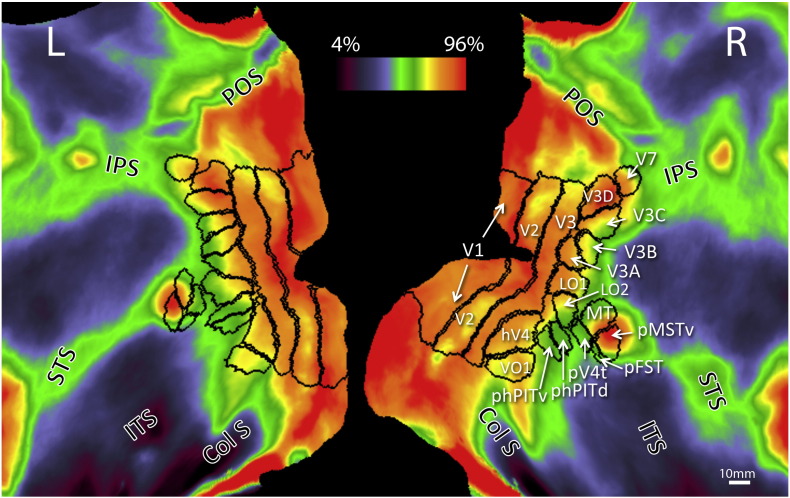
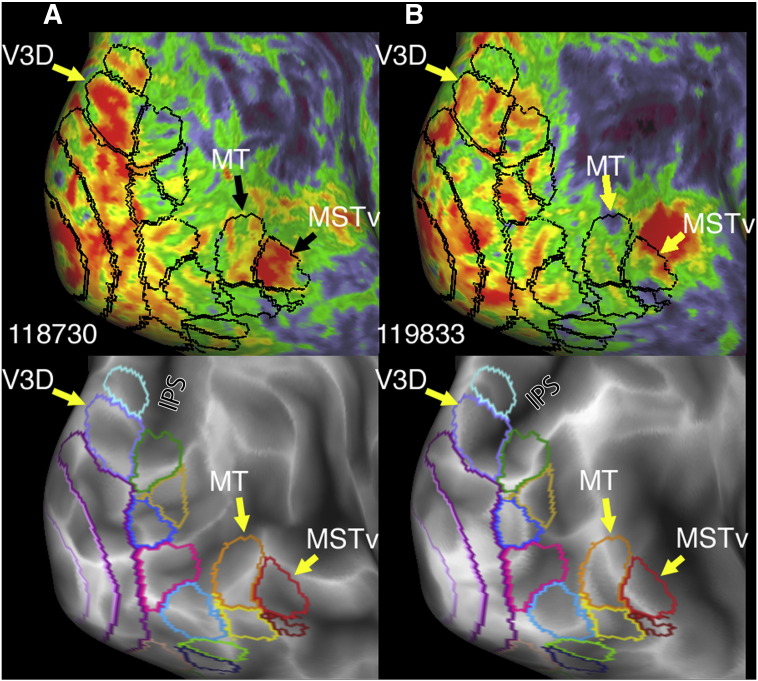
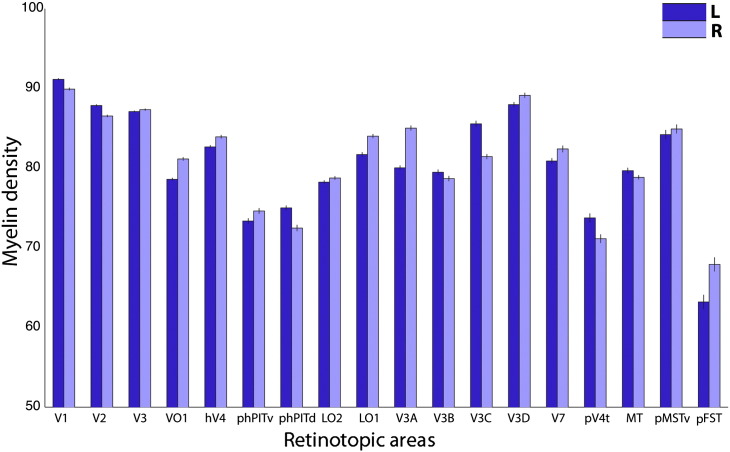
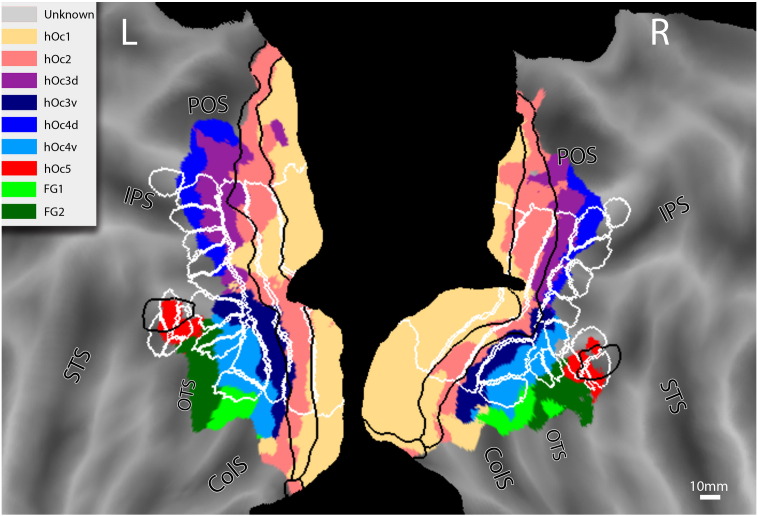
We generated probabilistic area maps and maximum probability maps (MPMs) for a set of 18 retinotopic areas previously mapped in individual subjects (Georgieva et al., 2009 and Kolster et al., 2010) using four different inter-subject registration methods. The best results were obtained using a recently developed multimodal surface matching method. The best set of MPMs had relatively smooth borders between visual areas and group average area sizes that matched the typical size in individual subjects. Comparisons between retinotopic areas and maps of estimated cortical myelin content revealed the following correspondences: (i) areas V1, V2, and V3 are heavily myelinated; (ii) the MT cluster is heavily myelinated, with a peak near the MT/pMSTv border; (iii) a dorsal myelin density peak corresponds to area V3D; (iv) the phPIT cluster is lightly myelinated; and (v) myelin density differs across the four areas of the V3A complex. Comparison of the retinotopic MPM with cytoarchitectonic areas, including those previously mapped to the fs_LR cortical surface atlas, revealed a correspondence between areas V1-3 and hOc1-3, respectively, but little correspondence beyond V3. These results indicate that architectonic and retinotopic areal boundaries are in agreement in some regions, and that retinotopy provides a finer-grained parcellation in other regions. The atlas datasets from this analysis are freely available as a resource for other studies that will benefit from retinotopic and myelin density map landmarks in human visual cortex.


Figures

Fig. 1
Fig. 1
The 18 retinotopic areas defined in the polar angle (A) and eccentricity (B) maps by Georgieva et al., 2009 and Kolster et al., 2010; right hemisphere of subject 1. Stars: central visual field, purple: eccentricity ridge, white dotted lines: horizontal meridian (HM), black full and dashed lines: lower and upper vertical meridian (VM). In case of small regions devoted to central vision, eg the center of the V3C–D cluster the central representations are affected by large pRF sizes and do not reach the smallest values (hence remain yellow or green). Hence, the central representations of the visual field were identified as positions where a local minimum in eccentricity and representations of the upper VM, lower VM, and HM coincide.
Fig. 2
Fig. 2
Variability of the V3A complex: postero-lateral views of the folded left (A–C) and right (B–D) hemispheres illustrating the location of the four areas of the V3A complex relative to dorsal V3. Retinotopic clusters are known to rotate across subjects (Kolster et al., 2010). The variability of the V3A complex is due to independent rotation of the two clusters V3A–B and V3C–D.
Fig. 3
Fig. 3
Probability atlases (color code see inset) and 8% (dark color), 50% (medium color) and 100% (light color) probability contours obtained with FreeSurfer registration (left columns) and MSM-retino registration (right columns) for three cortical areas: V1 (blue A–D), MT (brown-yellow, E–H) and pFST (green, I–L). Note that the 100% probability plateau is not continuous in V1, because of the cut in the flatmap along the calcarine sulcus used to generate the original patches in Freesurfer. Note also the presence of an outlier in the pFST maps.
Fig. 4
Fig. 4
The 3 characteristics of the probability atlases. Plots of maximum probability (A) ratio of 50%/8% (B) and 50% surface (mm2) (C) as a function of original white matter surface of the areas (see Table 1B) for the four registration methods: PALS, FreeSurfer, MSMsulc and MSM-retino (from left to right). Equations in A and B are for descriptive purposes only. Equations are from left to right: A: y = 1 − exp(− ax) with mean values (limits of 95% confidence interval between brackets) for a: 0.0037 (0.0035, 0.0040) for PALS, 0.0055 (0.0050, 0.0059) for FreeSurfer, 0.0055 (0.005, 0.006)for MSMsulc, 0.0133 (0.0117, 0.0150)for MSM-retino; B: y = 1 − b exp(− ax0.1) with mean value and 95% confidence limits between brackets for a, b: 1.004 (0.8507, 1.157), 5.251 (3.843, 6.659)for PALS, 1.433 (1.263, 1.602), 10.43 (7.35, 13.51) for FreeSurfer1.484 (1.296, 1.672), 11.22 (7.544, 14.89) for MSM sulc, and 2.122 (1.658, 2.585), 25.73 (5.15, 46.3) for MSM retino; C: y = ax + b with mean values (95% confidence limits between brackets) for a and b: 1.01 (0.97, 1.05), b = − 153 (− 178, − 129)for PALS, a = 1.12 (1.09, 1.15), b = − 147 (− 167, − 127) for FreeSurfer, a = 1.10 (1.07, 1.13), b = − 129 (− 149, − 109)for MSM sulc, a = 1.05 (1.03, 1.06),b = − 33 (− 44, − 22) for MSM-retino. R2 exceeded .95 in all four cases.
Fig. 5
Fig. 5
Distortion histograms for 2 registration methods using the fs_LR template: MSMSulc (A) and FreeSurfer (B) and their regional distributions on lateral and medial views of the hemispheres. The surface area change was measured on the original and registered native mesh spheres and defined as log2 (surface area of registered tile)/(surface area of corresponding tile). Its absolute value was used in A (mean 0.14, sd 0.04, min 0.03, max 0.33) and B (mean 0.35, sd 0.12, min 0.07, max 1.47).
Fig. 6
Fig. 6
Flatmaps showing the MPMs of retinotopic areas in the two hemispheres for the PALS (A), FreeSurfer (B), MSMsulc (C), and MSM-retino (D) registration; Inset: color code: light grey: V1, light purple V2, dark purple V3, pink: hV4, green: VO1, dark blue: phPITv, light green: phPITd, green-blue: LO2, dark pink: LO1, dark blue V3A, light brown, V3B, dark green V3C, purple-blue: V3D, light blue: V7, yellow: pV4t, brown: pFST, orange: MT and red: pMST.
Fig. 7
Fig. 7
Evaluation of the atlas: A–B: individual (subject 3, B; subject 7, A) retinotopic areas superimposed onto the MPM obtained using MSM-retino for the 11 remaining subjects; C: Average (across subjects) overlap (in percent) for the different areas between individual areas and those in the MPM of the remaining subjects for five registration strategies: only MSM-retino (dark blue bars), as in A and B, only MSMsulc (light blue bars), only Freesurfer (green bars), MSMsulc for test subject and MSM-retino for atlas (orange bars) and Freesurfer for test subject and MSM-retino for atlas (brown bars). A two-way ANOVA with registration strategies and areas as factors yielded significant main effects of registration strategy (F4,17 = 190, p 10− 100) and area (F4,17 = 118, p < 10− 100) and a significant interaction (F4,17 = 2.35, p < 10− 7). Post hoc ANOVAs comparing areas pairwise yielded significant main effects for registration strategies when comparing MSM-retino to any other strategy (all F1,17 > 300, p < 10− 50), but also when comparing Freesurfer & MSM-retino to Freesurfer (F1,17 = 25.3, p < 10− 10) and when comparing MSM-sulc & MSM-retino to MSM-sulc (F1,17 = 24.4, p < 10− 10).
Fig. 8
Fig. 8
A–B: MPMs of the retinotopic areas (MSM-retino registration) in the left hemisphere on the inflated cortical surface, lateral (A) and medial (B) views; C: schematic representation of retinotopic organization of the 18 areas shown on the retinotopic MPM: upper (+) and lower (−) fields and central vision (stars); same color code as in Fig. 6.
Fig. 9
Fig. 9
Outlines (black lines) of retinotopic MPMs superimposed on myelin density (blue to red color) maps for 196 subjects. Color code: myelin content in percentiles of the normalized T1w/T2w distribution.
Fig. 10
Fig. 10
A. Myelin map (top) and sulc map (bottom) for HCP subject 118730, displayed on the group average inflated surface (postero-lateral view) after MSM-All registration (see Methods), with superimposed MSM-retino area outlines. B. Myelin map and sulc map for HCP subject 119833, with MSM-retino area outlines superimposed.
Fig. 11
Fig. 11
Myelin density, averaged across the 196 subjects, in percentiles, for the 18 areas of the left (dark bars) and right (light bars) hemispheres. Vertical lines: standard error of the mean.
Fig. 12
Fig. 12
Outlines (white) of retinotopic MPM superimposed on the cytoarchitectonic MPM of left (L) and right (R) hemispheres. Black lines: 50% contours of PAs of hOc1, hOc2, hOc5 from Fischl et al. (2008). Inset color code of cytoarchitectonic areas. In evaluating the overlap (see Table S1) one needs in addition to take into account that the MT cluster as a whole can differ in overall orientation by as much as 60 degrees in different individuals (Kolster et al., 2010, p.201).

Similar articles

Cited by

References

    1. Amano K., Wandell B.A., Dumoulin S.O. Visual field maps, population receptive field sizes, and visual field coverage in the human MT+ complex. J. Neurophysiol. 2009;102:2704–2718. - PMC - PubMed
    1. Amunts K., Malikovic A., Mohlberg H., Schormann T., Zilles K. Brodmann's areas 17 and 18 brought into stereotaxic space – where and How variable? NeuroImage. 2000;11:66–84. - PubMed
    1. Anticevic A., Dierker D.L., Gillespie S.K., Repovs G., Csernansky J.G., Van Essen D.C., Barch D.M. Comparing surface-based and volume-based analyses of functional neuroimaging data in patients with schizophrenia. NeuroImage. 2008;41:835–848. - PMC - PubMed
    1. Anticevic A., Repovs G., Dierker D.L., Harwell J.W., Coalson T.S., Barch D.M., Van Essen D.C. Automated landmark identification for human cortical surface-based registration. NeuroImage. 2012;59:2539–2547. - PMC - PubMed
    1. Arcaro M.J., Pinsk M.A., Li X., Kastner S. Visuotopic organization of macaque posterior parietal cortex: a functional magnetic resonance imaging study. J. Neurosci. 2011;31:2064–2078. - PMC - PubMed

Publication types