. 2014 Jun 27;9(6):e99367.
doi: 10.1371/journal.pone.0099367. eCollection 2014.

Sequence and expression analyses of ethylene response factors highly expressed in latex cells from Hevea brasiliensis

Affiliations

Sequence and expression analyses of ethylene response factors highly expressed in latex cells from Hevea brasiliensis

Piyanuch Piyatrakul et al. PLoS One. .

Abstract

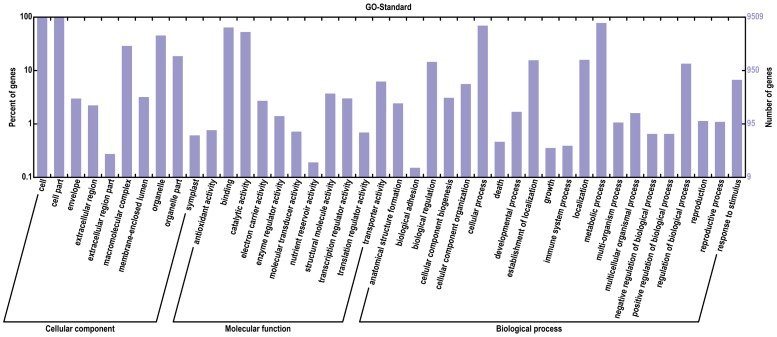
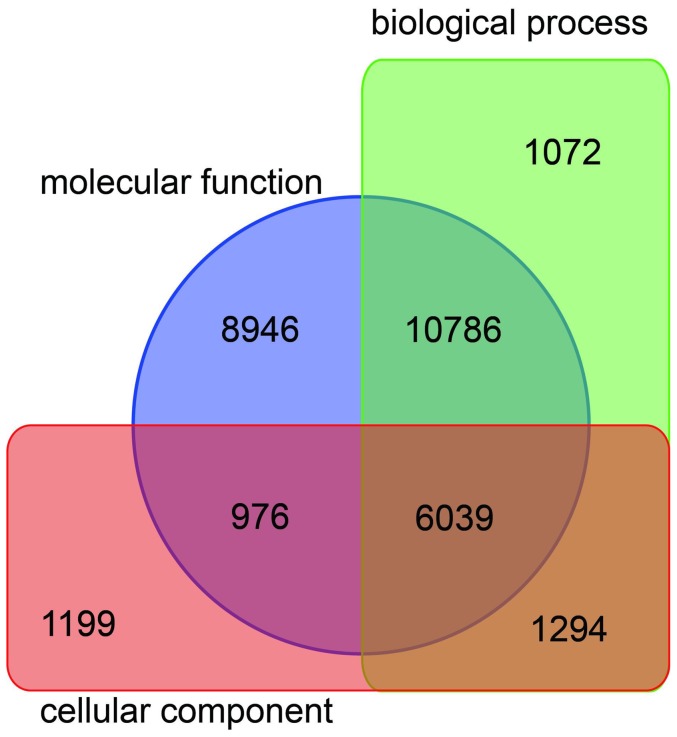
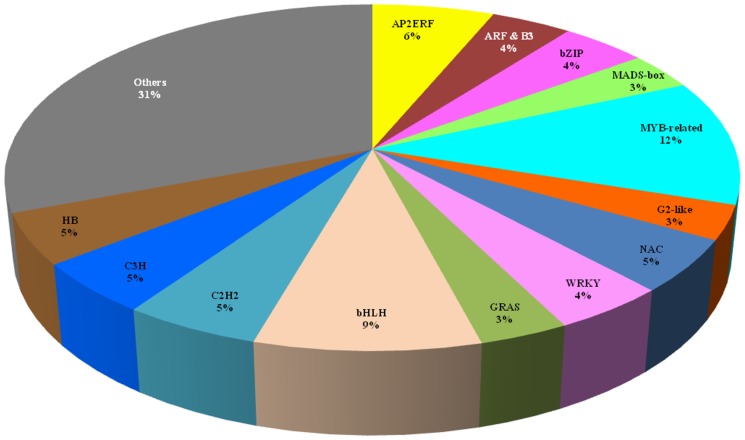
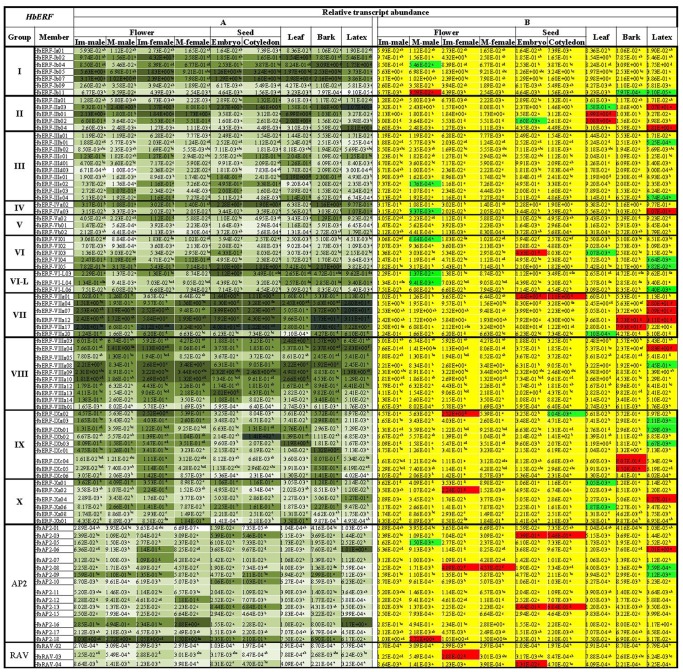
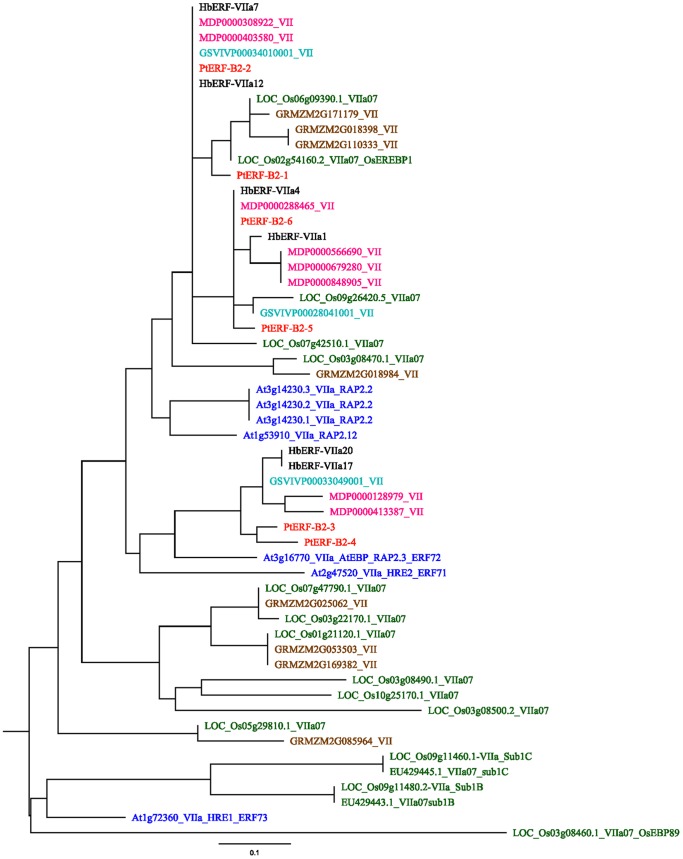
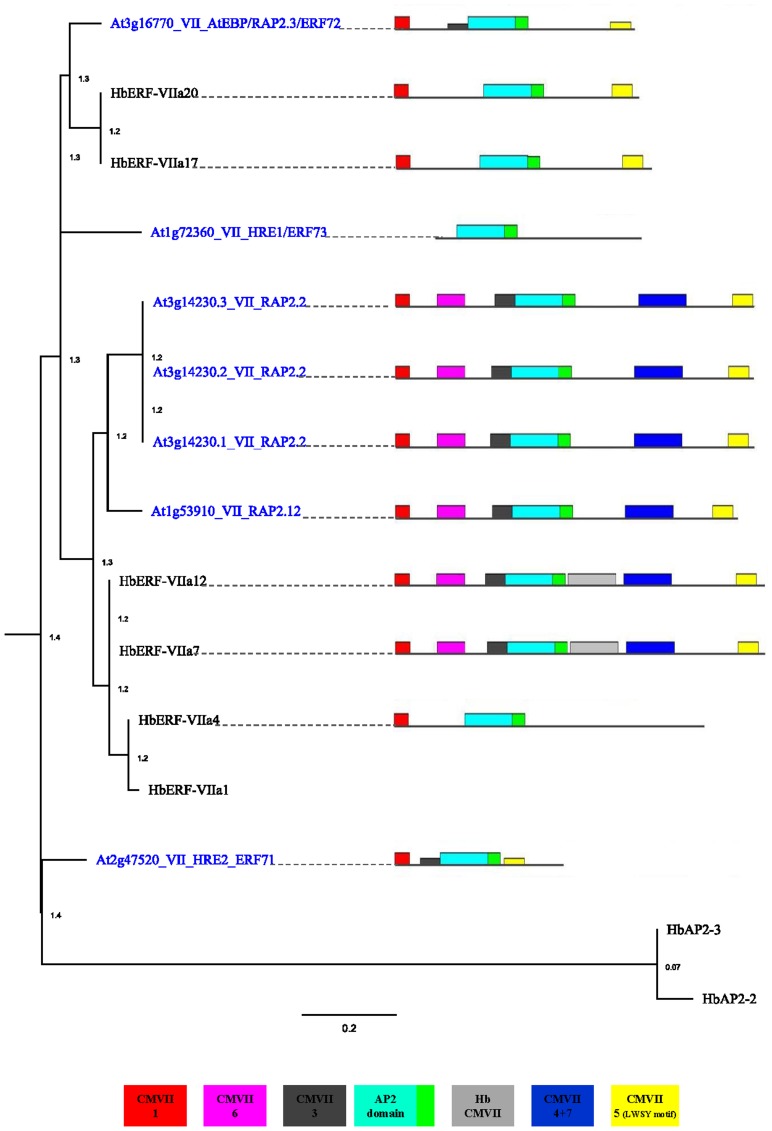
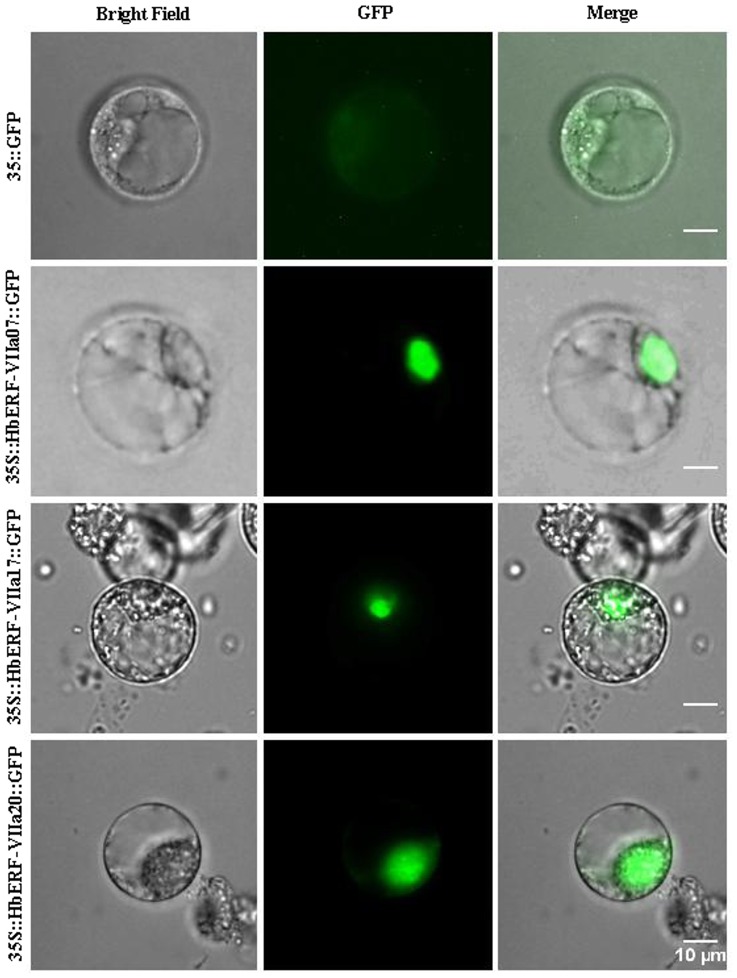
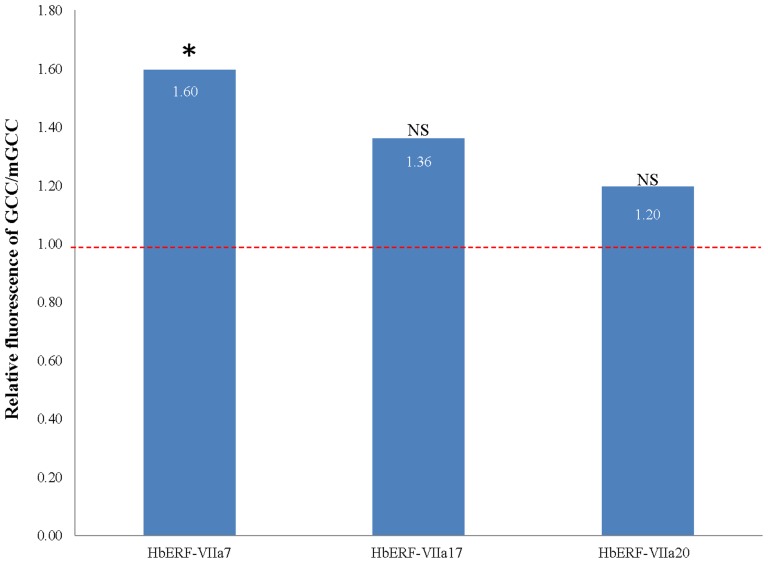
The AP2/ERF superfamily encodes transcription factors that play a key role in plant development and responses to abiotic and biotic stress. In Hevea brasiliensis, ERF genes have been identified by RNA sequencing. This study set out to validate the number of HbERF genes, and identify ERF genes involved in the regulation of latex cell metabolism. A comprehensive Hevea transcriptome was improved using additional RNA reads from reproductive tissues. Newly assembled contigs were annotated in the Gene Ontology database and were assigned to 3 main categories. The AP2/ERF superfamily is the third most represented compared with other transcription factor families. A comparison with genomic scaffolds led to an estimation of 114 AP2/ERF genes and 1 soloist in Hevea brasiliensis. Based on a phylogenetic analysis, functions were predicted for 26 HbERF genes. A relative transcript abundance analysis was performed by real-time RT-PCR in various tissues. Transcripts of ERFs from group I and VIII were very abundant in all tissues while those of group VII were highly accumulated in latex cells. Seven of the thirty-five ERF expression marker genes were highly expressed in latex. Subcellular localization and transactivation analyses suggested that HbERF-VII candidate genes encoded functional transcription factors.


Conflict of interest statement

Competing Interests: Funding for this study was provided by Michelin, Socfinco and SIPH. There are no patents, products in development or marketed products to declare. This does not alter the authors' adherence to all the PLOS ONE policies on sharing data and materials.

Figures

Figure 1
Figure 1. General scheme of ethylene-induced biochemical pathways in latex cells.
Factors in red and green are activated and inhibited by ethephon or ethylene, respectively. Factors are: Chi (Chitinase), Glu (Glucanase), GS (Glutamine synthetase), HEV (Hevein), HMG (3-hydroxy-3-methylglutaryl-coenzyme A reductase), HXT (Hexose transporter), PIP (Plasma membrane intrinsic protein), RBOH (NADPH oxidase), REF (Rubber elongating factor), SUS (Sucrose synthase), SUT (Sucrose transporter).
Figure 2
Figure 2. Gene Ontology classification of Hevea brasiliensis in various tissue types.
Figure 3
Figure 3. Venn diagram of the elements of the three GO terminologies.
Figure 4
Figure 4. Transcription factor family distribution and percentage in Hevea brasiliensis.
Figure 5
Figure 5. Relative transcript abundance profile of 107 HbERF genes for various tissue types (both immature and mature male and female flowers, zygotic embryos, leaf, bark and latex).
The relative transcript abundances were measured by real-time RT-PCR. Values are the means of the relative transcript abundances of three biological replicates. (Figure 4A) heat map representation of the expression profile was used for values ranging as from dark (≥10) to light green (≤10−5). (Figure 4B) Values of relative transcript abundances in various tissue types were analysed with XLSTAT software after log transformation. The statistical analysis was performed with an ANOVA followed by the Student Newman-Keuls test. Values with significantly high relative transcript abundances shown in red and significantly low relative transcript abundances shown in green. The non-significant genes are shown in yellow.
Figure 6
Figure 6. Phylogenetic tree illustrating the relatedness of group VII ERFs among plant species.
The amino acid sequences of the AP2 domain were aligned using Muscle, and the phylogenetic tree was constructed using PhyML. The 7 plant species were: Arabidopsis thaliana (At2g47520,At3g16770, At1g72360, At1g53910, At3g14230.1,At3g14230.2, At3g14230.3); Populus trichocarpa (PtERF-B2-1, PtERF-B2-2, PtERF-B2-3, PtERF-B2-4, PtERF-B2-5, PtERF-B2-6) as named by Zhuang et al. (2008); Vitis vinifera (GSVIVP00034010001, GSVIVP00033049001, GSVIVP00028041001); Oryza sativa (Os02g54160.2, Os06g09390.1, Os03g08500.2, Os01g21120.1, Os03g22170.1, Os07g42510.1, Os07g47790.1, Os10g25170.1, Os03g08460.1, Os03g08490.1, Os09g26420.5, Os03g08470.1, Os05g29810.1, Os09g11460.1 and Os09g11480.2) as named by Nakano et al.(2006); Orysa nivara (EU429443.1submergence-1B,EU429445.1submergence-1C) as named by Fukao et al. (2009); M.× domestica (MDP0000848905, MDP0000679280, MDP0000566690, MDP0000413387, MDP0000403580, MDP0000308922, MDP0000288465 and MDP0000128979); Zea mays (GRMZM2G171179, GRMZM2G169382, GRMZM2G110333, GRMZM2G085964, GRMZM2G053503, GRMZM2G025062, GRMZM2G018984 and GRMZM2G018398) and Hevea brasiliensis (HbERF-VIIa1 to HbERF-VIIa23) as named by Duan et al.(2013).
Figure 7
Figure 7. Gene structure of the 6 HbERF-VII genes.
Figure 8
Figure 8. Phylogenetic tree and a schematic diagram of the conserved motif of group VII ERFs among Arabidopsis thaliana and Hevea brasiliensis.
Figure 9
Figure 9. Subcellular localization of HbERF-VIIs.
Tree HbERF-VII GFP fusion proteins (HbERF-VIIa7, HbERF-VIIa17 and HbERF-VIIa20) were transiently expressed in protoplasts from BY-2 tobacco cells under the control of the 35S promoter. Subcellular localization was analysed by confocal laser scanning microscopy. The merged pictures of the green fluorescence channel (middle panels) and the corresponding bright field (left panels) are shown (right panels). Control cells expressing fluorescence absence are shown in the top panel. The scale bar indicates 10 µm.
Figure 10
Figure 10. Transactivation of the synthetic GCC-box and mGCC containing promoters by HbERF-VIIa7, HbERF-VIIa17 and HbERF-VIIa20 proteins.
Transient expression in BY-2 tobacco protoplasts co-transformed by pMDC32 harbouring the effector construct (ERF candidate genes under the control of the CaMV 35S promoter) and the reporter constructs, 4× GCC::GFP or 4× mGCC::GFP, respectively. Fluorescence activity was measured by flow cytometry for three independent biological replicates. The ratio of fluorescence between the constructs with functional GCC and mutated mGCC boxes revealed that ERF candidates are activators (ratio >1) or repressors (ratio <1). (*) indicates significant difference for the Student test (p<0.01).

Similar articles

Cited by

References

    1. Latchman DS (1997) Transcription factors: An overview. The International Journal of Biochemistry & Cell Biology 29: 1305–1312. - PubMed
    1. Bleecker AB, Kende H (2000) Ethylene: a gaseous signal molecule in plants. Annu Rev Cell Dev Biol 16: 1–18. - PubMed
    1. Johnson PR, Ecker JR (1998) The ethylene gas signal transduction pathway: a molecular perspective. Annu Rev Genet 32: 227–254. - PubMed
    1. Pirrello J, Jaimes-Miranda F, Sanchez-Ballesta MT, Tournier B, Khalil-Ahmad Q, et al. (2006) Sl-ERF2, a tomato ethylene response factor involved in ethylene response and seed germination. Plant Cell Physiol 47: 1195–1205. - PubMed
    1. Dietz K-J, Vogel M, Viehhauser A (2010) AP2/EREBP transcription factors are part of gene regulatory networks and integrate metabolic, hormonal and environmental signals in stress acclimation and retrograde signalling. Protoplasma 245: 3–14. - PubMed

Publication types