. 2014 Jun 27;9(6):e101001.
doi: 10.1371/journal.pone.0101001. eCollection 2014.

Cep192 controls the balance of centrosome and non-centrosomal microtubules during interphase

Affiliations

Cep192 controls the balance of centrosome and non-centrosomal microtubules during interphase

Brian P O'Rourke et al. PLoS One. .

Abstract

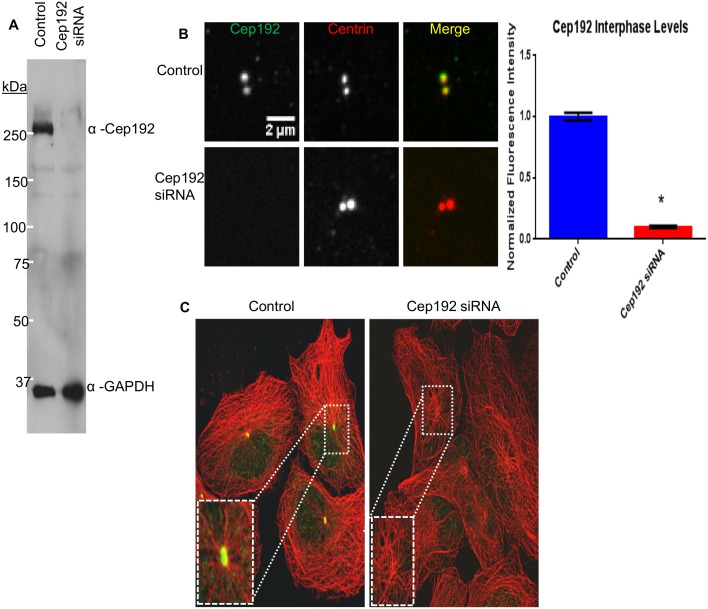
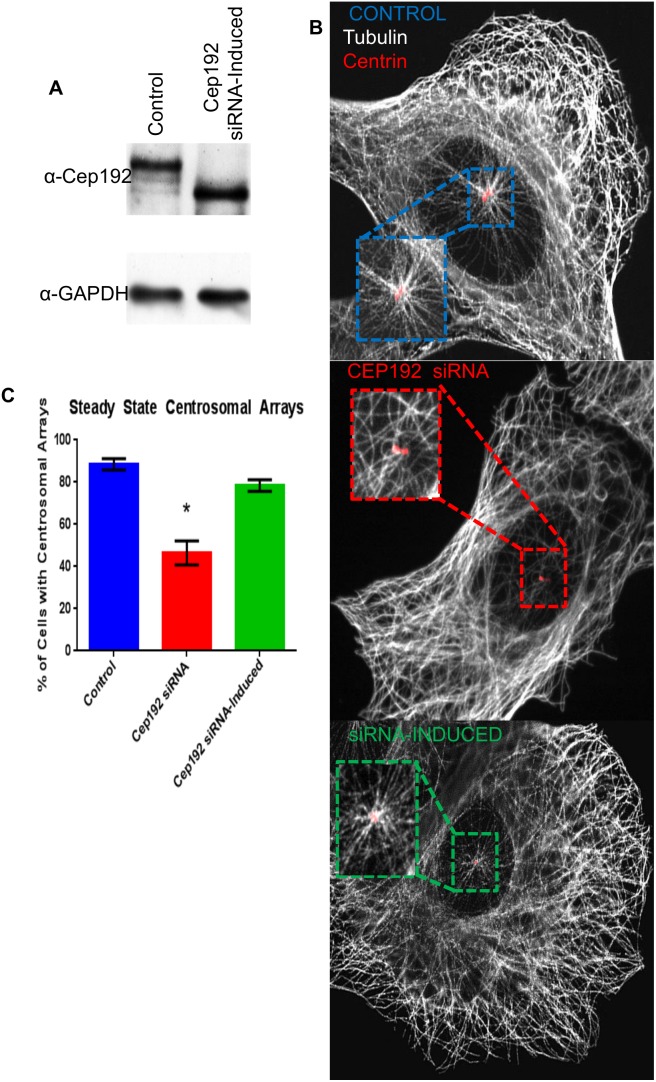
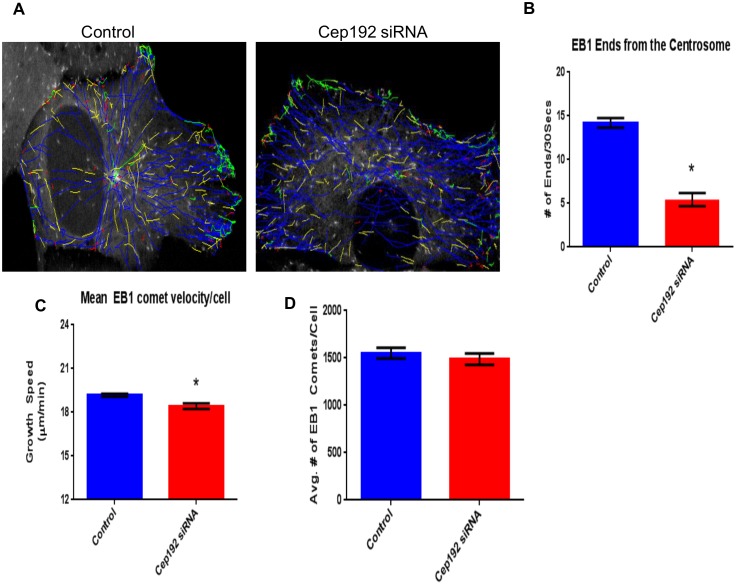
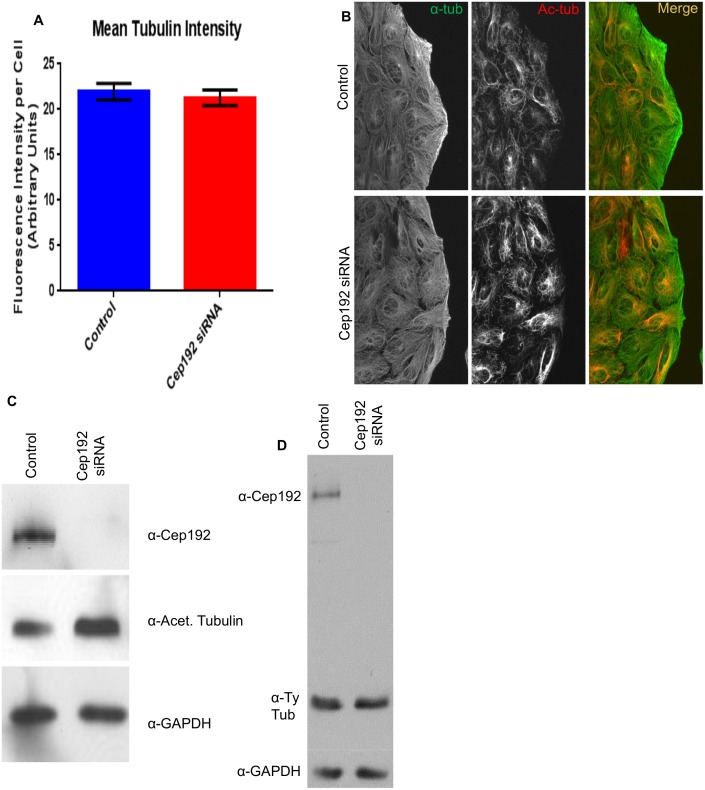
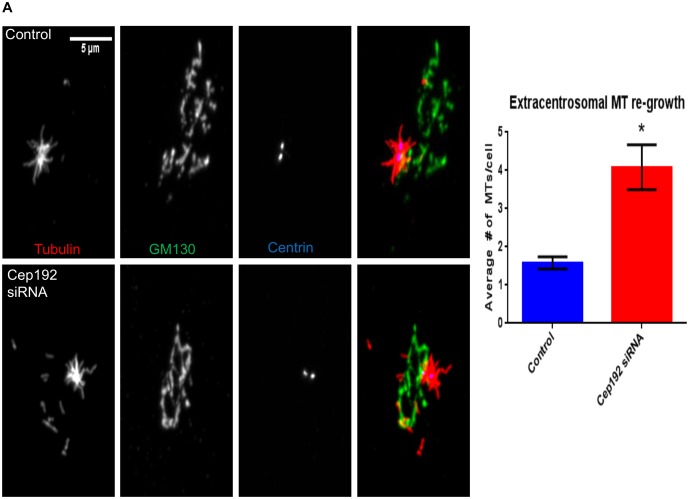
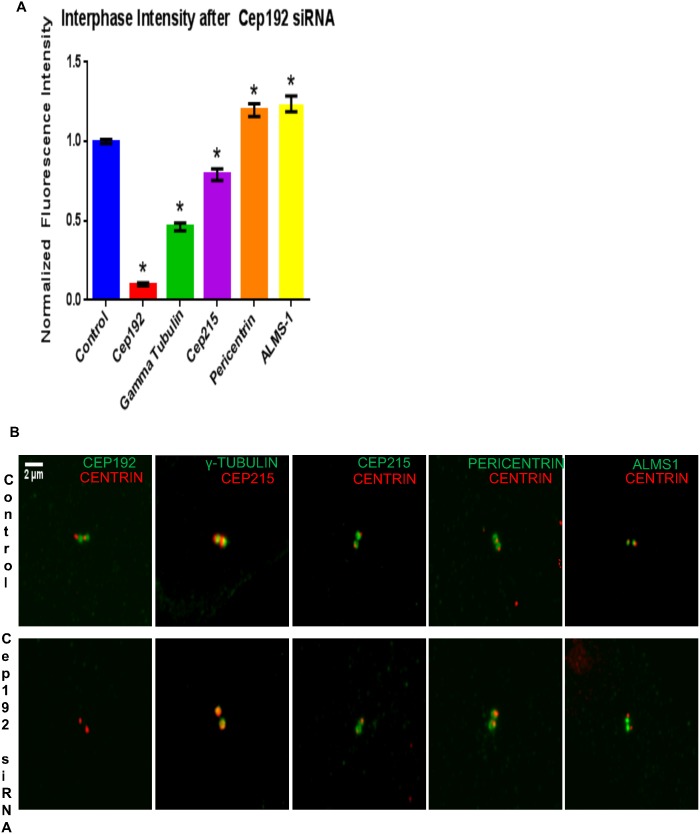
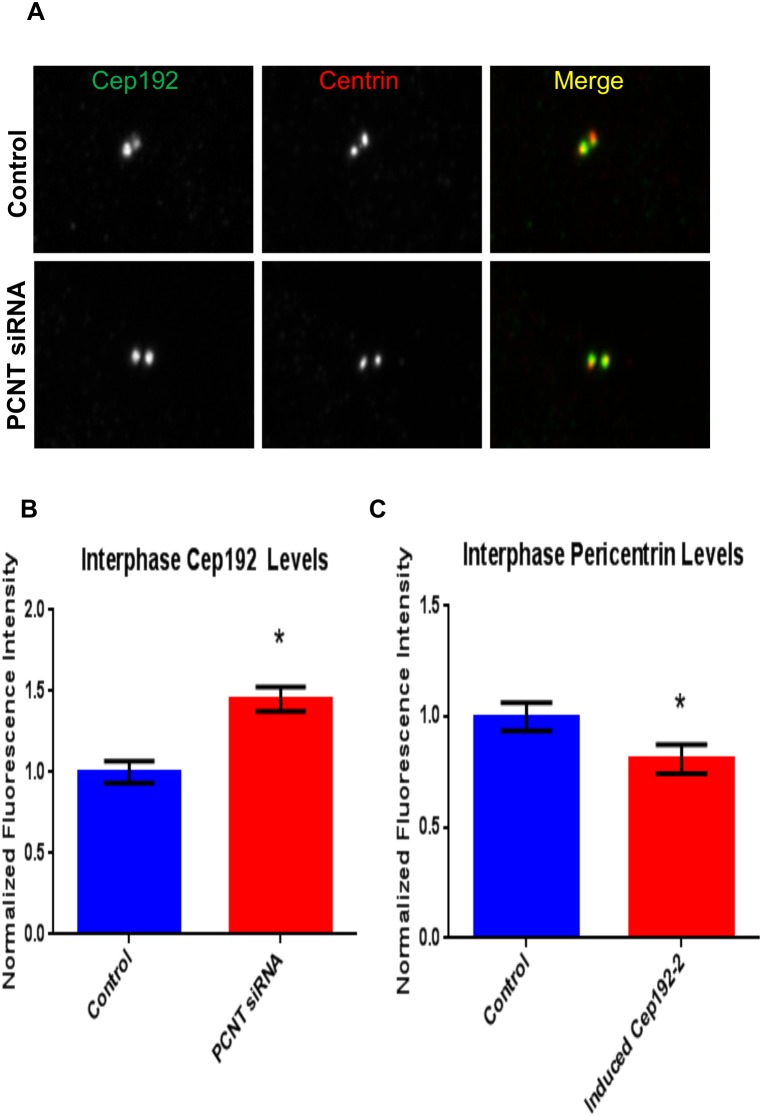
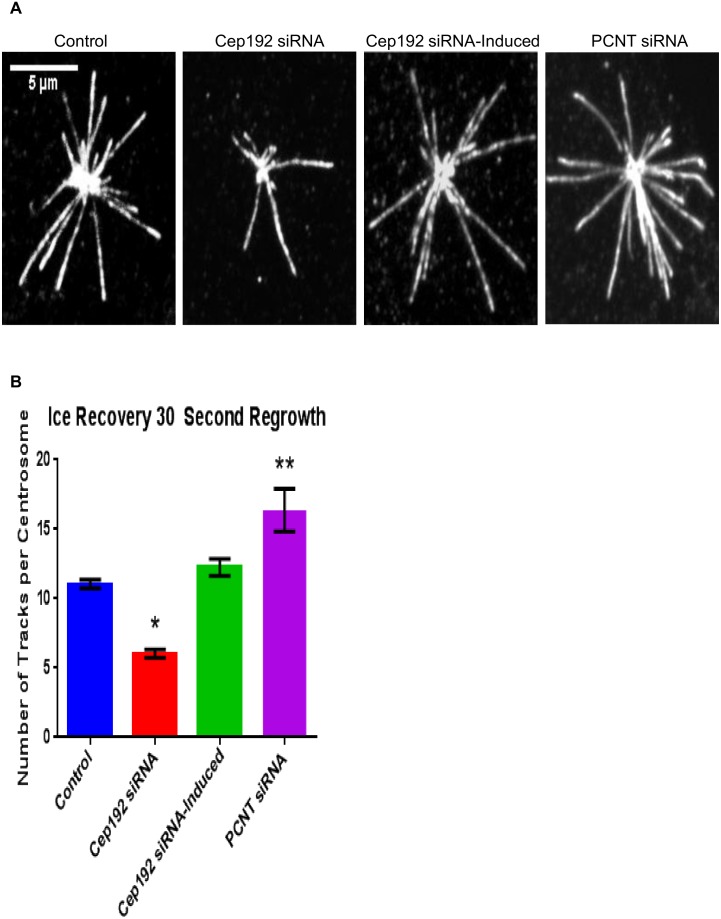
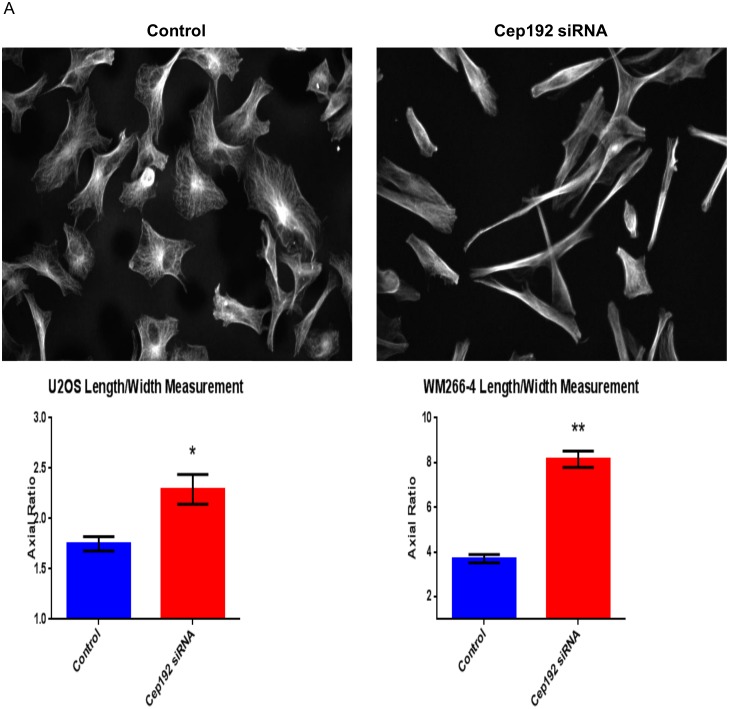
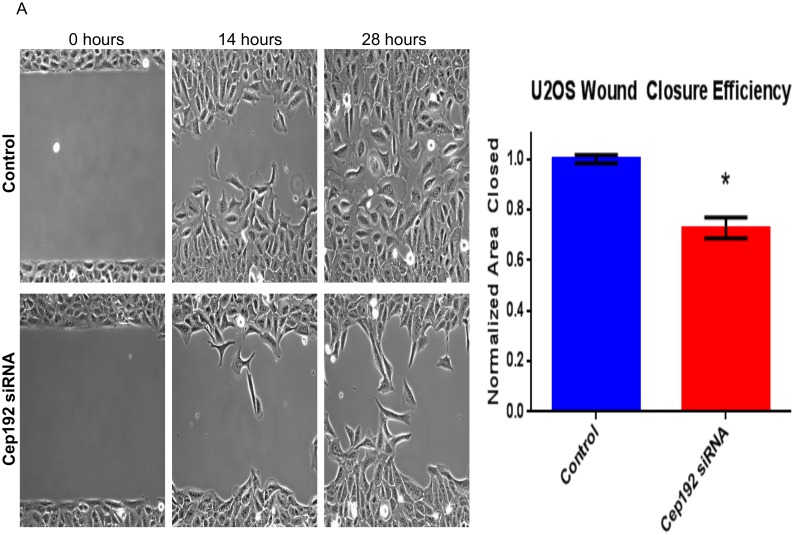
Cep192 is a centrosomal protein that contributes to the formation and function of the mitotic spindle in mammalian cells. Cep192's mitotic activities stem largely from its role in the recruitment to the centrosome of numerous additional proteins such as gamma-tubulin and Pericentrin. Here, we examine Cep192's function in interphase cells. Our data indicate that, as in mitosis, Cep192 stimulates the nucleation of centrosomal microtubules thereby regulating the morphology of interphase microtubule arrays. Interestingly, however, cells lacking Cep192 remain capable of generating normal levels of MTs as the loss of centrosomal microtubules is augmented by MT nucleation from other sites, most notably the Golgi apparatus. The depletion of Cep192 results in a significant decrease in the level of centrosome-associated gamma-tubulin, likely explaining its impact on centrosome microtubule nucleation. However, in stark contrast to mitosis, Cep192 appears to maintain an antagonistic relationship with Pericentrin at interphase centrosomes. Interphase cells depleted of Cep192 display significantly higher levels of centrosome-associated Pericentrin while overexpression of Cep192 reduces the levels of centrosomal Pericentrin. Conversely, depletion of Pericentrin results in elevated levels of centrosomal Cep192 and enhances microtubule nucleation at centrosomes, at least during interphase. Finally, we show that depletion of Cep192 negatively impacts cell motility and alters normal cell polarization. Our current working hypothesis is that the microtubule nucleating capacity of the interphase centrosome is determined by an antagonistic balance of Cep192, which promotes nucleation, and Pericentrin, which inhibits nucleation. This in turn determines the relative abundance of centrosomal and non-centrosomal microtubules that tune cell movement and shape.


Conflict of interest statement

Competing Interests: The authors have declared that no competing interests exist.

Figures

Figure 1
Figure 1. Optimized siRNA-mediated knockdown of Cep192.
A) Western blot of control and Cep192 siRNA-treated U2OS cell lysates probed with anti-Cep192 and GAPDH (loading control) antibodies. Densitometry measurements using ImageJ indicated a significant (98%) decrease in Cep192 after siRNA treatment; P<0.0001. Values quantified from 3 separate blots. B) Quantitative immunofluorescence analysis revealed a >90% decrease in centrosome-associated Cep192 staining after siRNA treatment. Vertical bars represent S.E.M. P value <0.0001. N≥37 centrosomes per experiment from 3 independent experiments. C) Immunofluorescence micrographs of control and Cep192 siRNA-treated U2OS cells (72 hours after siRNA treatment) double-labeled for Cep192 (green) and MTs (red). Controls showed robust radial arrays of centrosome-associated MTs arrays while siRNA-treated cells were devoid of Cep192 staining and displayed predominantly non-radial MT arrangements.
Figure 2
Figure 2. Inducible Cep192 expression rescues centrosomal arrays in FLAG-Cep192-2 Flp-In T-Rex U2OS cells.
A) Cep192 was successfully depleted using siRNA targeted specifically to the Cep192-1 isoform. Using an inducible U2OS tetracylcine inducible FLAG-Cep192-2 cell line, the shorter exogenous protein, resistant to the siRNA, is expressed at wild type levels. Following normalization to GAPDH, Cep192-2 levels were within 6.6% of controls. B) Representative immunofluorescence micrographs of MT arrangement in each experimental condition. Boxed and magnified regions focus on centrin labeled sites. C) Graph showing the percentage of cells displaying obvious centrosome MT arrays in each condition (24 hours after Cep192-2 induction; 88.5% for control, 46.5% for Cep192 KD, and 78.4% for knockdown induced cells). Vertical bars represent S.D. P<0.0001. N≥10 cells per condition from 3 independent experiments.
Figure 3
Figure 3. Cep192 is required for normal MT dynamics.
A) Representative images of tracked EB1-GFP comet trajectories during a 30s time interval in control and KD conditions in U2OS cells. Note the lack of a major MT nucleating site in the Cep192 KD cell. B) MT tracks emanate from the centrosome significantly less frequently in Cep192 KD cells relative to control (5.4 comets/centrosome vs. 14.2 (comets/centrosome)). C) Using the automated tracking program, plusTipTracker to track EB1 comets, we found comets in Cep192 depleted cells traveled at a significantly slower rate relative to control (18.4±0.193 µm/min vs. 19.2±0.112µm/min, respectively). D) Despite changes in MT organization, there was no change in the number of comets per cell. Vertical bars represent S.E.M. P values are <0.0001, P = 0.0007, and P = 0.4377, respectively. N≥16 cells per experiment from 3 independent experiments per condition.
Figure 4
Figure 4. Cep192 knockdown causes a positive shift in acetylated tubulin density in U2OS cells.
A) Quantitative immunofluorescence of cells immunostained for alpha-tubulin showed no significant shift in total interphase MT polymer mass between control and Cep192 depleted cells. Vertical bars represent S.E.M. P value is 0.5951 N≥20 cells per experiment from 3 independent experiments. B) Immunofluorescence micrographs showing control and Cep192 siRNA-treated U2OS cells double labeled for acetylated tubulin and α-tubulin. C) Western blot control and Cep192 siRNA-treated U2OS cell lysates stained for acetylated tubulin. Densitometry measurements indicated that acetylated tubulin increases ∼64% following Cep192 knockdown. GAPDH is shown as a loading control. D) Levels of tyrosinated tubulin decrease 9% following Cep192 KD.
Figure 5
Figure 5. Cep192 depletion increases extra-centrosomal MT growth in RPE1 Centrin-GFP cells.
A) MT regrowth after ice depolymerization was used to quantify the relative proportion of MTs nucleated from centrosomal and extra-centrosomal sites. The images in this panel are immunofluorescence micrographs of control and Cep192 siRNA treated RPE1 triple-labeled for MTs, the Golgi marker GM130, and Centrin (Centrin is GFP-tagged). After 25 seconds of MT regrowth, control cells contained an average of 1.57 MTs/cell non-centrosomal MTs (neither end attached to the centrosome), while Cep192 depleted cells contained an average of 4.05 non-centrosomal MTs. Vertical bars represent S.E.M. P = 0.0002. N≥28 cells per experiment from 3 independent experiments.
Figure 6
Figure 6. Cep192 is required for the assembly of the interphase centrosome.
A) Graph quantifying the effects of Cep192 siRNA on the levels of centrosome-associated PCM proteins as determined by quantitative immunofluorescence. P values for all experiments are ≤0.0003. S.E.M. is depicted as vertical bars. N≥23 cells per experiment from 3 independent experiments. B) Representative immunofluorescence micrographs showing the alterations in PCM protein staining levels quantified in A.
Figure 7
Figure 7. Altering Pericentrin levels impacts Cep192 localization to the centrosome and vice versa.
A, B) Following 48 hours of siRNA depletion, interphase centrosomes showed an increase of 1.45X of Cep192. Vertical bars represent S.E.M. P value is <0.0001. N≥13 cells per experiment from 3 independent experiments. C) Overexpression of FLAG-Cep192-2 in U2OS cells resulted in a 20% decrease in Pericentrin localization to centrosomes relative to control. Vertical bars represent S.E.M. P = 0.0389. N≥16 cells per experiment from 3 independent experiments.
Figure 8
Figure 8. MT nucleation following Ice Depolymerization in Cep192-2 Flp-In T-Rex U2OS cells.
A) Following 40 minutes of ice depolymerization, cells were incubated in 37°C media for 30 seconds to allow regrowth. Cells were fixed and stained with EB1 and Cep192. B) Following Cep192 depletion fewer MTs regrew(6.0±0.297 MTs/centrosome) than in controls (11.0±0.319 MTs/centrosome). Induction of Cep192-2 rescued the MT nucleating capacity (12.3±0.611 MTs/centrosome) of the centrosome to control levels. Depletion of Pericentrin lead to a significant increase in the number of MTs attached to the centrosome (16.4±1.54) relative to controls. Vertical bars represent S.E.M. P values are <0.001, P = 0.0691, and P = 0.0096, respectively. N≥14 cells per experiment from 3 independent experiments per condition.
Figure 9
Figure 9. Cep192 impacts cell polarization.
A) Top panels show immunofluorescence micrographs of control and Cep192 siRNA-treated WM266-4 cells stained for alpha-tubulin 72 hours after siRNA treatment. Cep192 siRNA-treated WM266-4 cells are clearly elongated relative to controls. Bottom panels show the measured average axial ratios (length/width) of control and Cep192 siRNA-treated U2OS cells and WM266-4 melanoma cells. Vertical bars represent S.E.M. P = 0.0007 (U2OS cells) and <0.0001 (WM266-4 cells). N≥20 cells from each condition per experiment from 3 independent experiments.
Figure 10
Figure 10. Cep192 is required for efficient polarization and cell migration.
A) Phase-contrast images from a 2-D scratch assay performed on control Cep192 siRNA treated U2OS cells. U2OS cells were plated into Ibidi Culture-Insert dishes following siRNA treatment and the cell-free zone was generated by removing the insert. B) Quantification of the efficiency at which control and Cep192 siRNA-treated cells moved into the cell-free zone (determined by measuring the cell free area at the indicated timepoint). Vertical bars represent S.E.M. P<0.0001. N = 3 experiments per condition.

Similar articles

Cited by

References

    1. Bugnard E, Zaal KJ, Ralston E (2005) Reorganization of microtubule nucleation during muscle differentiation. Cell Motil Cytoskeleton 60: 1–13. - PubMed
    1. Bartolini F, Gundersen GG (2006) Generation of noncentrosomal microtubule arrays. J Cell Sci 119: 4155–4163. - PubMed
    1. Chabin-Brion K, Marceiller J, Perez F, Settegrana C, Drechou A, et al. (2001) The Golgi Complex Is a Microtubule-organizing Organelle. Mol Biol Cell 12: 2047–2060. - PMC - PubMed
    1. Miller PM, Folkmann AW, Maia AR, Efimova N, Efimov A, et al. (2009) Golgi-derived CLASP-dependent microtubules control Golgi organization and polarized trafficking in motile cells. Nat Cell Biol 11: 1069–1080. - PMC - PubMed
    1. Efimov A, Kharitonov A, Efimova N, Loncarek J, Miller PM, et al. (2007) Asymmetric CLASP-Dependent Nucleation of Noncentrosomal Microtubules at the trans-Golgi Network. Developmental Cell 12: 917–930. - PMC - PubMed

Publication types

LinkOut - more resources