. 2014 Jun 27;9(6):e100963.
doi: 10.1371/journal.pone.0100963. eCollection 2014.

A computational approach to estimate interorgan metabolic transport in a mammal

Affiliations

A computational approach to estimate interorgan metabolic transport in a mammal

Xiao Cui et al. PLoS One. .

Abstract

In multicellular organisms metabolism is distributed across different organs, each of which has specific requirements to perform its own specialized task. But different organs also have to support the metabolic homeostasis of the organism as a whole by interorgan metabolite transport. Recent studies have successfully reconstructed global metabolic networks in tissues and cell types and attempts have been made to connect organs with interorgan metabolite transport. Instead of these complicated approaches to reconstruct global metabolic networks, we proposed in this study a novel approach to study interorgan metabolite transport focusing on transport processes mediated by solute carrier (Slc) transporters and their couplings to cognate enzymatic reactions. We developed a computational approach to identify and score potential interorgan metabolite transports based on the integration of metabolism and transports in different organs in the adult mouse from quantitative gene expression data. This allowed us to computationally estimate the connectivity between 17 mouse organs via metabolite transport. Finally, by applying our method to circadian metabolism, we showed that our approach can shed new light on the current understanding of interorgan metabolite transport at a whole-body level in mammals.


Conflict of interest statement

Competing Interests: The authors have declared that no competing interests exist.

Figures

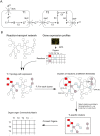
Figure 1
Figure 1. A model of a metabolism/transport network between organs and strategy to develop tissue-specific metabolism/transport clusters.
(A) In each organ (T1 and T2) different metabolic processes may occur which are interconnected by interorgan metabolite transport mediated by Slcs. Alphabetic letters (A–F) represent metabolites catalytically converted by enzymes E1–E6. SlcA/C/C’/F are Slc transporters transporting metabolites A, C, F respectively. (B) Illustrates the procedure to derive tissue-specific metabolism/transport clusters. The reference network consists of enzymatic reactions (rectangular nodes), Slc-mediated transport reactions (circular nodes) and metabolites (lines connecting nodes). The score of a node is derived from the gene expression scores taken from microarray data and based on the Gene-Protein-Reaction (GPR) association. For a given organ Ti, node colors reflect high (red) to low (light blue) scores (Figure S1). Nodes connected by shared metabolites can form subclusters (dashed ellipses: G1, G2, G3, G4) based on a threshold for scores and each cluster obtains a score (FG(1) to FG(4)) according to the scoring function (FG). With progressively decreasing thresholds, increasingly larger groups of reactions and transport processes emerge (G1 becomes a part of G3 with lower threshold). After integrating all optimal subclusters (G3 and G2), tissue-specific clusters are obtained (lower right). Based on the derived tissue-specific clusters, organ-organ connectivity matrix is constructed (lower left).
Figure 2
Figure 2. Evaluation of the statistical significance and the size of the largest connected local tissue-specific metabolism/transport clusters.
(A) The yellow diamonds mark the scores of the largest connected clusters. The distribution of simulated scores of the same cluster is illustrated in the pink boxplot. (B) The yellow diamonds mark the sizes of the largest connected clusters. The sizes of the simulated largest connected clusters are illustrated in the form of a blue boxplot. AG, adrenal gland; BM, bone marrow; PG, pituitary gland; SG, salivary gland; SI, small intestine. ** represents p<0.001 in Student’s t-test.
Figure 3
Figure 3. Tissue-specific metabolism/transport clusters in liver and spleen.
Each organ possesses its own unique metabolism/transport clusters. The outer and inner circles line up all small molecule compounds that are transported by a Slc. Node color indicates compound types (see legend). The dots representing compounds are connected by a red line, if an appropriate Slc is expressed in the organ in question. The circular area in the center contains the reactions realized in each organ investigated. In these clusters, reactions that occur are marked with a red line. The above diagrams can be interactively viewed using Cytoscape (Data S1).
Figure 4
Figure 4. Comparing characteristics of tissue-specific clusters.
(A) Shows the number of metabolites in the 17 tissue-specific clusters and the number of metabolites in the largest connected subclusters (blue portion of the bars). (B) The color-coded percentages of different magnitude of reaction scores in the tissue-specific networks for different organs. (C) The histogram indicates the percentage of reactions common to an increasing number of tissue-specific clusters. The x-axis is the numbers of organs that a reaction is included in tissue-specific clusters across 17 organs. Rectangles delineate groups of reactions that are tissue-specific (box marked as Group 3), reactions that are shared by a limited number of organs (box marked as Group 2) and ubiquitously occurring reactions (box marked as Group 1). AG, adrenal gland; BM, bone marrow; PG, pituitary gland; SG, salivary gland; SI, small intestine.
Figure 5
Figure 5. Distribution across 17 organs of the two classes of Slc-mediated transport modalities.
The blue bars represent the number of enzyme-coupled Slc transport processes while the green bars represent the number of Slc-mediated transport processes that are not linked to an enzymatic reaction. AG, adrenal gland; BM, bone marrow; PG, pituitary gland; SG, salivary gland; SI, small intestine.
Figure 6
Figure 6. Organ-Compound interaction matrix and Organ-Organ connectivity.
(A) Rows are 17 organs. Columns are 136 transport processes. Cell colors reflect high (dark green) to low (white) transport capabilities of corresponding metabolites for a given organ. (B) Cell colors reflect high (dark green) to low (white) connectivity via Slc-mediated transports between organs. AG, adrenal gland; BM, bone marrow; PG, pituitary gland; SG, salivary gland; SI, small intestine.

Similar articles

Cited by

References

    1. Schilling CH, Letscher D, Palsson BO (2000) Theory for the systemic definition of metabolic pathways and their use in interpreting metabolic function from a pathway-oriented perspective. J Theor Biol 203: 229–248. - PubMed
    1. Duarte NC, Becker SA, Jamshidi N, Thiele I, Mo ML, et al. (2007) Global reconstruction of the human metabolic network based on genomic and bibliomic data. Proceedings of the National Academy of Sciences 104: 1777–1782. - PMC - PubMed
    1. Thiele I, Swainston N, Fleming RM, Hoppe A, Sahoo S, et al... (2013) A community-driven global reconstruction of human metabolism. Nat Biotechnol. - PMC - PubMed
    1. Sigurdsson MI, Jamshidi N, Steingrimsson E, Thiele I, Palsson BO (2010) A detailed genome-wide reconstruction of mouse metabolism based on human Recon 1. BMC Syst Biol 4: 140. - PMC - PubMed
    1. Capel F, Klimcakova E, Viguerie N, Roussel B, Vitkova M, et al. (2009) Macrophages and adipocytes in human obesity: adipose tissue gene expression and insulin sensitivity during calorie restriction and weight stabilization. Diabetes 58: 1558–1567. - PMC - PubMed

Associated data

LinkOut - more resources