. 2014 Oct:103:63-74.
doi: 10.1016/j.visres.2014.06.005. Epub 2014 Jun 24.

Possible roles of glutamate transporter EAAT5 in mouse cone depolarizing bipolar cell light responses

Affiliations

Possible roles of glutamate transporter EAAT5 in mouse cone depolarizing bipolar cell light responses

Dennis Y Tse et al. Vision Res. 2014 Oct.

Abstract

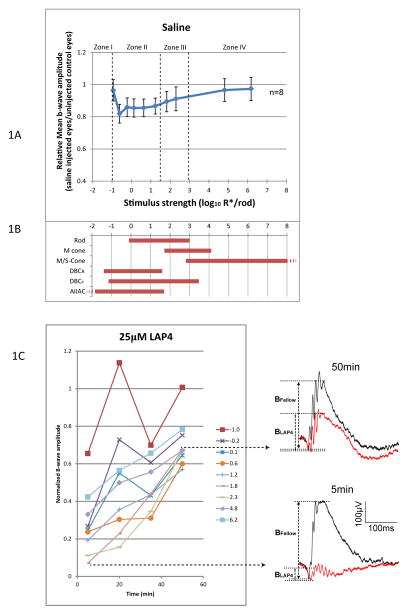
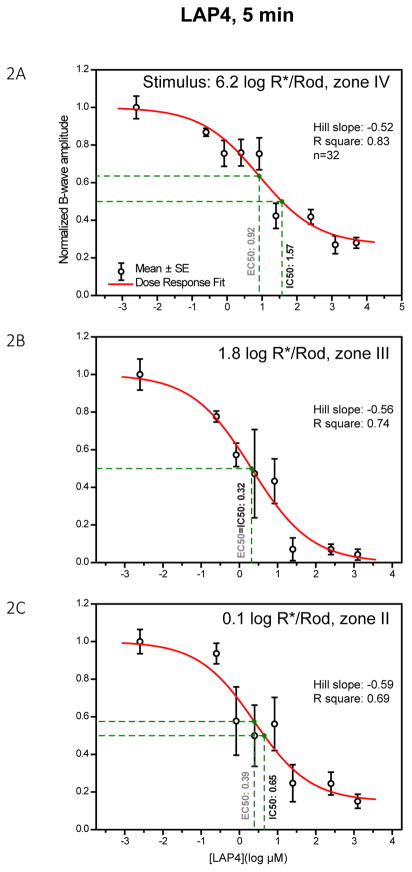
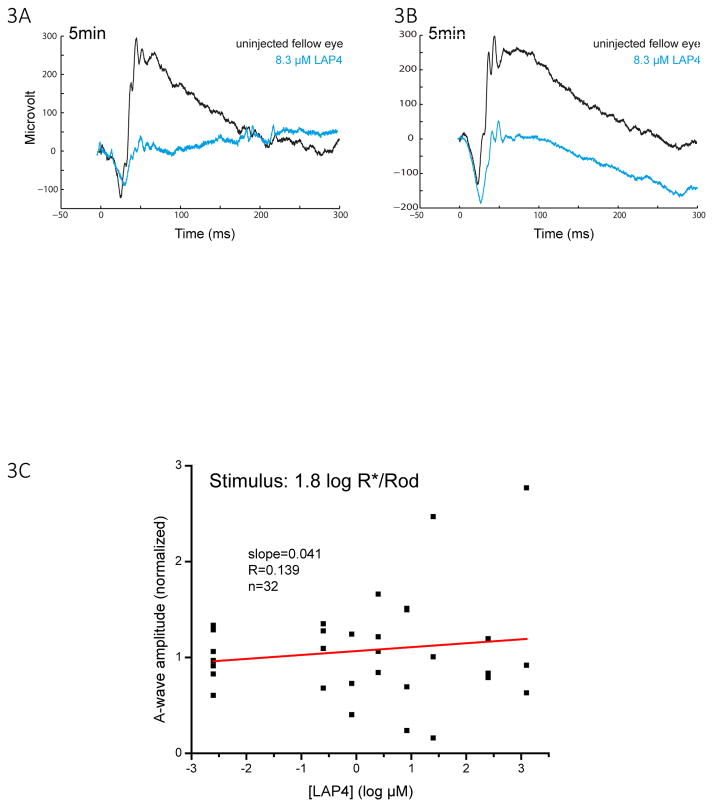
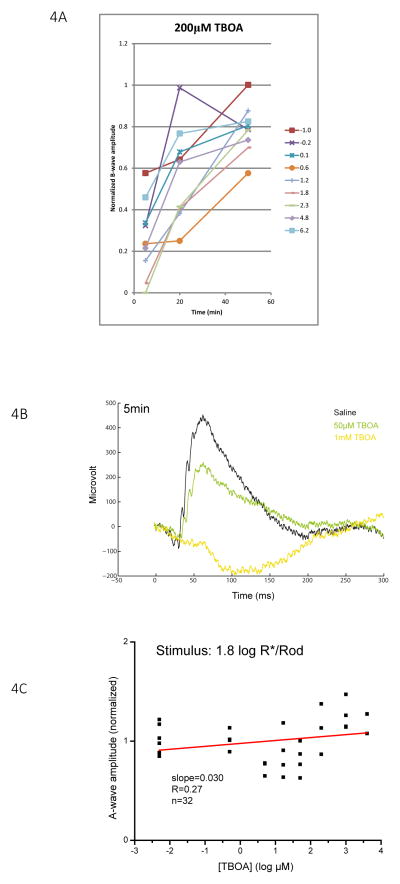
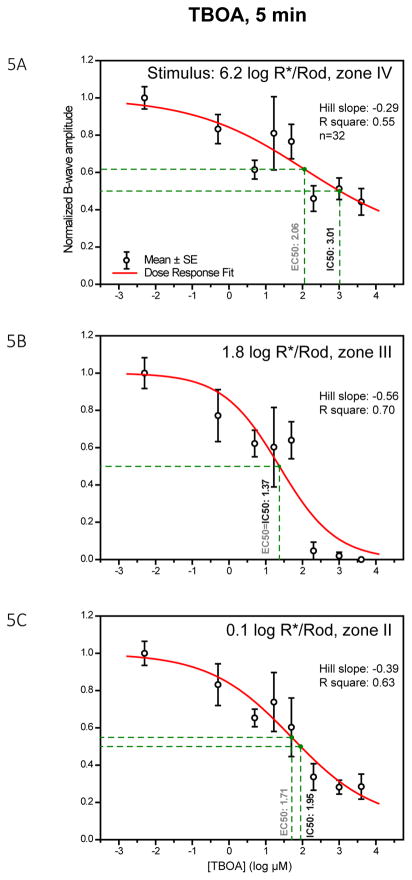
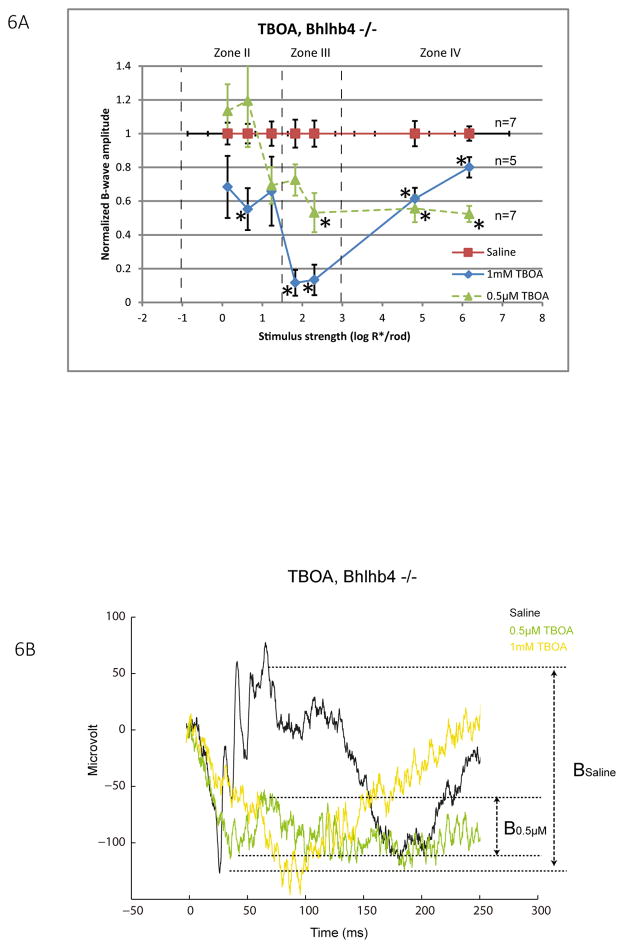
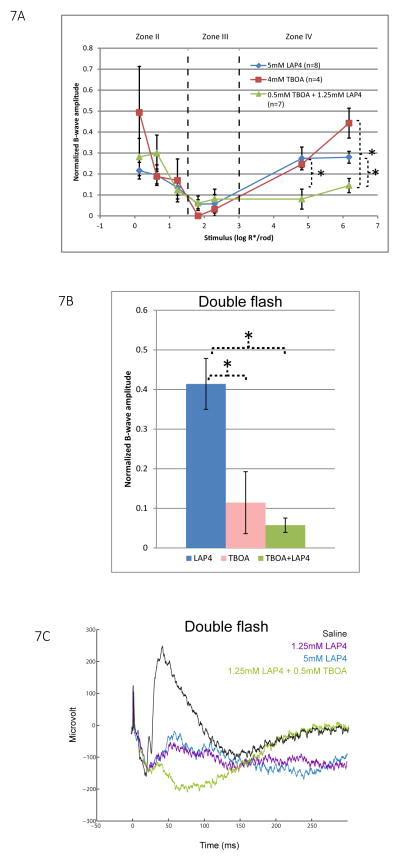
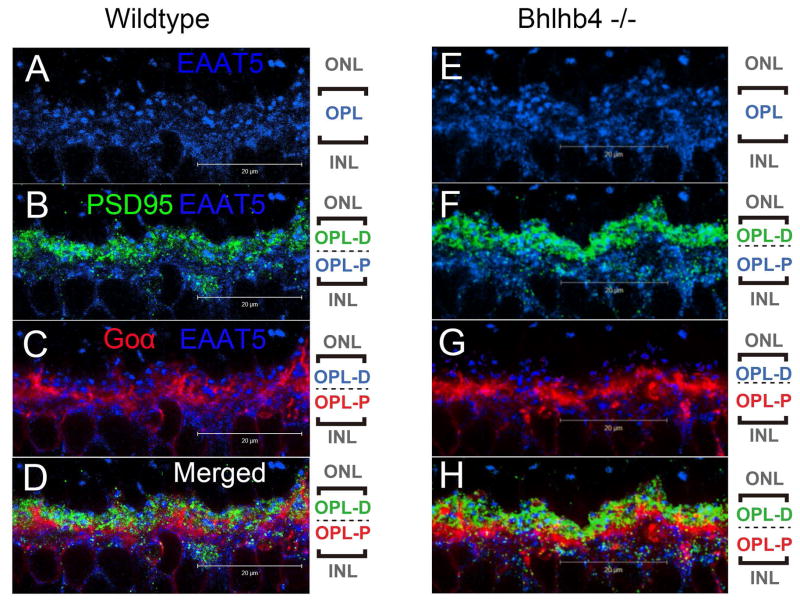
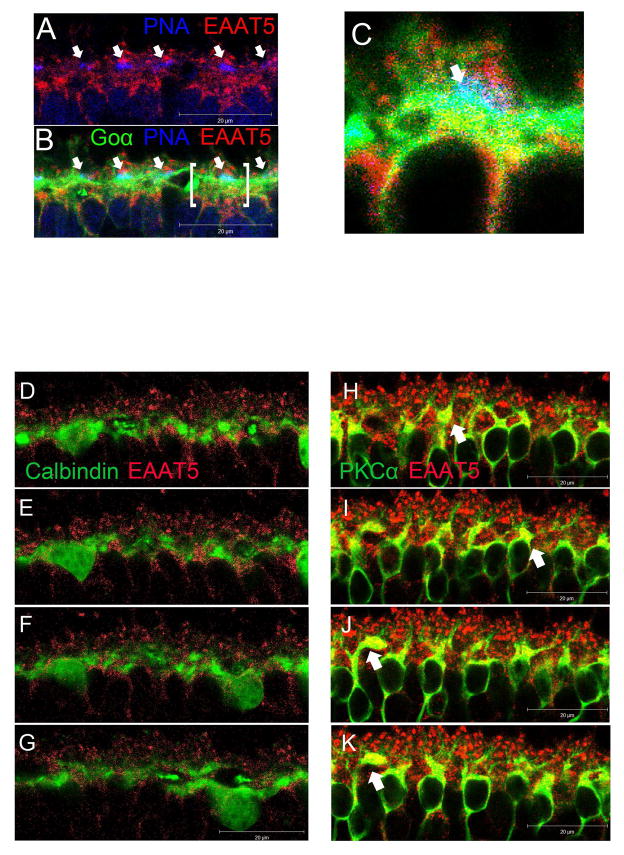
A remarkable feature of neuronal glutamate transporters (EAATs) is their dual functions of classical carriers and ligand-gated chloride (Cl(-)) channels. Cl(-) conductance is rapidly activated by glutamate in subtype EAAT5, which mediates light responses in depolarizing bipolar cells (DBC) in retinae of lower vertebrates. In this study, we examine whether EAAT5 also mediates the DBC light response in mouse. We took advantage of an infrared illuminated micro-injection system, and studied the effects of the EAAT blocker (TBOA) and a glutamate receptor agonist (LAP4) on the mouse electroretinogram (ERG) b-wave responses. Our results showed that TBOA and LAP4 shared similar temporal patterns of inhibition: both inhibited the ERG b-wave shortly after injection and recovered with similar time courses. TBOA inhibited the b-wave completely at mesopic light intensity with an IC50 value about 1 log unit higher than that of LAP4. The inhibitory effects of TBOA and LAP4 were found to be additive in the photopic range. Furthermore, TBOA alone inhibited the b-wave in the cone operative range in knockout mice lacking DBCRs at a low concentration that did not alter synaptic glutamate clearance activity. It also produced a stronger inhibition than that of LAP4 on the cone-driven b-wave measured with a double flash method in wildtype mice. These electrophysiological data suggest a significant role for EAAT5 in mediating cone-driven DBC light responses. Our immunohistochemistry data indicated the presence of postsynaptic EAAT5 on some DBCCs and some DBCRs, providing an anatomical basis for EAAT5's role in DBC light responses.

Keywords: Bipolar cells; EAAT5; Electroretinogram; Glutamate transporter; Immunohistochemistry; Retina.


Conflict of interest statement

DISCLOSURES

No conflicts of interest, financial or otherwise, are declared by the authors.

Figures

Figure 1
Figure 1
(A) Relative b-wave amplitude against stimulus strength, measured 5 min after injection of saline. B-wave was reduced by a maximum of 17% in stimulus zone II, and about 3% in stimulus zone IV. This serves as a basis for normalization for the LAP4 or TBOA data. (B) Dynamic ranges (defined as 5–95% of maximum response) of various retinal neurons measured in wild type mice. Rod, M- and S-cone data are from suction-electrode recording from outer segments (Field and Rieke 2002; Nikonov, Kholodenko et al. 2006). M/S-cone range is extrapolated from the fact that many cones co-express both pigments (Applebury, Antoch et al. 2000). Ranges for DBCR, DBCC, and AIIAC are from light-evoked voltage-clamp results (Pang, Gao et al. 2004). (C) Changes of b-wave amplitude over time after applying 25μM (retinal concentration) LAP4. Lines represent corresponding strength of stimulus in log R*/Rod. Normalized b-wave amplitudes were lowest at the 5 min point and increased with time, implying that LAP4 inhibits the b-wave through a fast acting mechanism. Representative wave traces at 5min and 50min are shown on the right.
Figure 2
Figure 2
Dose-response curves showing the amplitude of the b-wave against log concentration of LAP4 measured at three different stimulus levels. Individual data points and error bars denote value mean and standard error respectively. Values in black and green beside the vertical drop-lines represent IC50 and EC50, respectively. (A) Dose-response curve measured with a strong rod-saturating zone IV stimulus within the operating range of cones. B-wave was inhibited by 72% with highest concentrations of LAP4. (B) Curve measured with a moderate zone III stimulus. The b-wave was nearly fully inhibited (96%) when concentrations were high enough. (C) Curve measured with a weaker zone II stimulus. The b-wave was strongly inhibited by the highest concentrations of the drug, with about 15% remaining.
Figure 3
Figure 3
(A)(B) Representative raw wave traces showing the a- and b-wave of uninjected eye and injected eye in two different mice, each injected with 8.3 μM LAP4 in one eye. A consistent large reduction in the amplitude of the b-wave was observed together with a non-consistent change in the amplitude of the a-wave. (C) A scatterplot showing the normalized amplitude of a-wave versus log concentration of LAP4 measured with a zone III stimulus of 1.8 log R*/Rod. A-wave amplitude became quite variable when LAP4 concentrations were high. The slopes for the linear regression lines were 0.041, indicating that the amplitude of the a-wave barely changed with the concentration.
Figure 4
Figure 4
(A) Changes in b-wave amplitude over a 50 min period following injection of 200 μM (retinal concentration) TBOA. Lines represent corresponding stimulus strengths. Normalized b-wave amplitudes were the lowest at the 5 min point and increased with time, implying that TBOA inhibits the b-wave through a fast acting and temporary mechanism. (B) Representative raw ERG traces measured from eyes 5 minutes after injecting with saline, 50 μM TBOA and 1 mM TBOA with a zone III stimulus of 1.8 log R*/Rod. (C) Scatterplot showing the normalized amplitude of a-wave versus log concentration of TBOA measured with a zone III stimulus of 1.8 log R*/Rod. The slope of the regression lines is 0.03, indicating that the amplitude of the a-wave does not change with the concentration of TBOA.
Figure 5
Figure 5
Dose-response curves showing amplitude of b-wave against log concentration of TBOA measured at three different stimulus levels. Individual data points and error bars denote value mean and standard error, respectively. Values in black and gray beside the vertical drop-lines represent IC50 and EC50, respectively. (A) Dose-response curve, measured with a strong rod-saturating zone IV stimulus within the operating range of cones. The b-wave was inhibited by 50–60% with the highest concentration of TBOA. (B) Curve measured with a moderate zone III stimulus. The b-wave was almost fully inhibited when TBOA concentration was high. (C) Curve measured with a weaker zone II stimulus. With the highest concentration of TBOA, the b-wave was largely reduced by about 75%.
Figure 6
Figure 6
(A) A line chart showing normalized b-wave amplitude for a range of increasing stimulus strength for bhlhb4−/− mice injected with 1mM TBOA (diamond, n=5) or saline (square, n=7). Data points and error bars represent mean and standard error. Dashed lines represent boundaries between the I, II, III and IV zones of stimulus strength. Mean values that are significantly different from that of the saline group were marked with asterisks. TBOA significantly inhibited the b-wave in all three zones to different extents depending on the injected concentration. Strongest inhibition was observed particularly in zone III. (B) Representative raw ERG traces measured from eyes 5 minutes after injecting with saline, 0.5 μM TBOA and 1 mM TBOA with a zone III stimulus of 2.3 log R*/Rod.
Figure 7
Figure 7
(A) A line chart showing normalized b-wave amplitude for a range of increasing stimulus strength for wild type mice injected with saturating concentrations of LAP4 (n=7), TBOA (n=4), or a mixture of them (n=6). Data points and error bars represent mean and standard error, respectively. In stimulus zone II and III, all three groups showed inhibition of the b-wave and there is no significant difference between them. In zone IV, eyes co-injected with LAP4 and TBOA showed the smallest amplitude of b-wave, which is significantly smaller than that in eyes injected with either drug alone. (B) Isolated cone b-wave response measured using a double flash method for the same three groups of mice. Data again normalized to saline control. Saturated dose of LAP4 inhibited cone b-wave by 58% compared to that of saline control. TBOA, when injected alone, or when co-injected with LAP4 produced significantly stronger inhibition, resulting in residual mean b-wave amplitudes of 12% and 6% respectively. (C) Representative wave traces elicited by the second (probe) flash in the double flash ERG. Traces shown were eyes injected with saline, 1.25mM LAP4, 5 mM LAP4 or a mixture of LAP4 and TBOA. The two concentrations of LAP4 produced similar wave traces in which b-waves were partially inhibited. In eyes injected with the mixture of drugs, the b-wave was greatly diminished to become a small positive potential that failed to fully truncate the PIII, which manifested as a negative potential after the small b-wave.
Figure 8
Figure 8
A plot of normalized b-wave amplitude for a range of increasing stimulus strength for mice injected with a cocktail of GABA/glycine antagonists (n=5), and mice co-injected with 1mM TBOA and the same cocktail (n=5). Data points and error bars represent mean and standard error, respectively. Dashed lines represent boundaries between the II, III and IV zones of stimulus strength. Mice injected with GABA antagonist cocktail alone have the b-wave inhibited by 50–65%. Mice co-injected with the cocktail and TBOA have significantly lower b-wave than the other group in zone III and IV.
Figure 9
Figure 9
(A–D) Confocal microscopic images of retina from wild-type mice processed for EAAT5 (blue), PSD95 (green), and Goα (red) immunofluorescence. The pictorial legends on the right denote the sub-stratification of the OPL into the distal (OPL-D) and the proximal (OPL-P) layers. (A) EAAT5 staining was found throughout the whole thickness of the OPL. (B) PSD95 staining was confined mostly to the distal half of the OPL where it co-localized with about half of the EAAT5 staining. This indicates the presence of EAAT5 on the rod spherules, and also on some postsynaptic structures. (C) Goα staining was observed intensely in the proximal half of the OPL where it overlapped nicely with the EAAT5 staining pattern not occupied by PSD95 staining. This indicates that EAAT5 is present on the dendritic processes and somas of some bipolar cells. (D) A three channel merged view of the above. (E–H) Confocal microscopic images of retina from bhlhb4 −/− mice processed for EAAT5 (blue), PSD95 (green), Goα (red) immuno-fluorescence showing a segment of the OPL. (E) EAAT5 immuno-labeling was observed throughout the whole thickness of the OPL. (F) PSD95 staining co-localized with EAAT5 staining in the distal half while (G) Goα co-localized with EAAT5 in the proximal half region. Since bhlhb4 −/− mice lack DBCR, the Goα staining here is attributed to DBCC. (H) A merged image showing all three channels.
Figure 10
Figure 10
(A–C) Confocal microscopic images of retina from wild-type mice processed for EAAT5 (red), PNA (blue), and Goα (green) immunofluorescence. (A) EAAT5 staining did not overlap with PNA staining but was present on the structure above it, suggesting that EAAT5 is not present on the active zones (arrows) of cone pedicles but is present extrajunctionally on the terminal. (B) Introducing the Goα green channel helped identify cone-bipolar synapses (arrows), one of which (bracketed) is further magnified in panel (C). (C) A bipolar cell (green) making a synapse with a cone pedicle labeled in blue. Red EAAT5 co-localized with the green Goα on the bipolar cell dendrites results in the yellowish patches immediately below the cone pedicle, suggesting that EAAT5 is present on the DBCC active zone postsynaptically. (D–G) A z-axis image series showing consecutive optical sections (1μm apart) of wild type retina processed for Calbindin (green) and EAAT5 (Red) immunofluorescence. Calbindin staining showed minimal overlapping with that of EAAT5, implying that EAAT5 does not express on horizontal cells. (H–K) Similar image series from wild type retina processed for PKCα (green) and EAAT5 (Red) immunofluorescence. EAAT5 labeling co-localized with that of PKCα, resulting in yellow color on the dendritic processes of some DBCRs. Such EAAT5 immuno-labeling is stronger on some DBCRs (arrows) than others. It is difficult to determine whether the EAAT5 is present junctionally on the dendrites, which extended to the distant half of the OPL and invaginated the rod spherules.

Similar articles

Cited by

References

    1. Abd-El-Barr MM, Pennesi ME, et al. Genetic dissection of rod and cone pathways in the dark-adapted mouse retina. Journal of neurophysiology. 2009;102(3):1945–1955. - PMC - PubMed
    1. Applebury ML, Antoch MP, et al. The murine cone photoreceptor: a single cone type expresses both S and M opsins with retinal spatial patterning. Neuron. 2000;27(3):513–523. - PubMed
    1. Arriza JL, Eliasof S, et al. Excitatory amino acid transporter 5, a retinal glutamate transporter coupled to a chloride conductance. Proceedings of the National Academy of Sciences of the United States of America. 1997;94(8):4155–4160. - PMC - PubMed
    1. Attwell D. The photoreceptor output synapse. In: Osborne N, Chader G, editors. Progress in Retinal Research. Oxford: Pergamon Press; 1990. p. 9.
    1. Awatramani G, Wang J, et al. Amacrine and ganglion cell contributions to the electroretinogram in amphibian retina. Visual neuroscience. 2001;18(1):147–156. - PubMed

Publication types

MeSH terms