. 2014 Aug:47:81-8.
doi: 10.1016/j.reprotox.2014.06.005. Epub 2014 Jun 24.

Multigenerational exposure to dietary zearalenone (ZEA), an estrogenic mycotoxin, affects puberty and reproduction in female mice

Affiliations

Multigenerational exposure to dietary zearalenone (ZEA), an estrogenic mycotoxin, affects puberty and reproduction in female mice

Fei Zhao et al. Reprod Toxicol. 2014 Aug.

Abstract

This study investigated potential cumulative effects of multiple pregnancy and multigenerational exposure to dietary ZEA (0, 0.8, 4, or 20ppm) on female puberty and reproduction in C57BL/6J mice. Multiple pregnancies did not significantly affect litter size or offspring puberty. Significant effects were observed in 20ppm ZEA-treated females: advanced puberty onset in F0, F1, and F2 generations; decreased implantation rate, pregnancy rate, and litter size, and increased pregnancy gap and gestation period in F1 and F2 generations; and reduced fertility index in F2 generation. F3 females from 0 and 20ppm groups were split into 0 or 20ppm ZEA diets at weaning, with advanced puberty onset seen in 0-20 and 20-20 groups and decreased implantation rate observed in 20-20 group. In summary, 20ppm dietary ZEA advanced puberty onset without obvious cumulative effect and impaired fertility with multigenerational cumulative effect, which could be partially alleviated upon exposure cessation.

Keywords: Embryo implantation; Female reproduction; Litter size; Multigeneration; Multipregnancy; Vaginal opening; Zearalenone.


Figures

Figure 1
Figure 1
Treatment and breeding regimens. A. Treatment protocols. F0 generation was treated with 0, 0.8, 4, or 20 ppm ZEA diets during the postweaning period, pregnancy, and lactation; F1 and F2 generations were exposed to 0, 0.8, 4, or 20 ppm ZEA diets during gestation and nursing via maternal exposure and treated with the same ZEA diets during the postweaning period, pregnancy, and lactation via direct dietary exposure. Females in the 0.8 and 4 ppm ZEA-treated F2 generation were dissected on D4.5 without producing F3 generation. In the F3 generation, 0 ppm and 20 ppm ZEA-treated groups were split into two groups each at weaning, and then treated with 0 ppm or 20 ppm ZEA during the postweaning period and pregnancy. B. Breeding regimen. F0 dams produced three litters: F1a, F1b, and F1c; F1a dams produced three litters: F2a, F2b, and F2c; F2a and F2b dams produced two litters: F3a and F3b.
Figure 2
Figure 2
Effect of ZEA on the ages at vaginal opening in F0, F1, and F2 female mice. ANOVA on ranks followed by Dunnett’s test was used for analyzing the differences among groups. The numbers above bars, the total numbers of females in the indicated groups; * P<0.05, compared with the 0 ppm group in the same generation; error bar, standard deviation; N=13–34.
Figure 3
Figure 3
Effect of ZEA on fertility in F0, F1, and F2 female mice. A. Pregnancy rate following the first mating (number of females producing litters/number of females with 1st vaginal plugs × 100%). N=15–29 first vaginal plugs from 6–13 dams. B. Fertility index (number of females ever producing litters/number of females ever mated × 100%) from all matings. N=16–29 from 6–13 dams. C. Litter size. N=10–26 litters from 6–13 dams. D. Gestation period. N=7–24 from 6–13 dams. E. Pregnancy gap from cohabitation to delivery. The numbers above bars, the total numbers of dams in the indicated groups; N=3–13. A & B, Fisher’s exact test; C & D, Two-way repeated measures ANOVA followed by Dunnett’s test; E, One-way ANOVA followed by Dunnett’s test. A–E: * P<0.05, compared with respective 0 ppm ZEA control group; # P<0.05, compared with the F2 0 ppm ZEA group (A); ## P<0.05, compared with F0 20 ppm ZEA group (A & C); error bar (C~E), standard deviation. A–D: X-axis, dams’ generation.
Figure 4
Figure 4
Effect of ZEA on embryo implantation detected on gestation day 4.5 (D4.5) in F0, F1, and F2 generations. A. Implantation rate. Fisher’s exact test. * P<0.05, compared with the control group in the same generation; # P<0.05, compared with the F0 20 ppm ZEA-treated group; N=10–22. B. Average number of implantation sites per mouse with implantation sites. ANOVA on ranks. Error bar, standard deviation; the numbers above bars, the numbers of females with implantation sites; N=3–14. C. A representative D4.5 uterine image from a control mouse (0 ppm ZEA). Red arrow, on-time implantation site. D. A D4.5 uterine image from the F1 20 ppm ZEA-treated group showing faint blue bands. Red arrowhead, delayed implantation site.
Figure 5
Figure 5
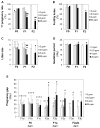
Effects of switched ZEA exposure on age at vaginal opening and embryo implantation at gestation day 4.5 in the F3 generation. A. Ages at vaginal opening. ANOVA on ranks followed by Dunnett’s test. Black diamond, individual data point; red line, average age in each group; * P<0.05, compared with the 0-0 group; N=7–24. B. Implantation rate. Fisher’s exact test. The ratio above each bar, the number of females with implantation sites over the total number of plugged females; N=7–13; * P<0.05, compared with the 0-0 group. C. Number of implantation sites. ANOVA on ranks. Black diamond, individual data point; red line, average number of implantation sites in each group; only mice with implantation sites were included. D. Progressively decreasing implantation rates in the F0, F1, F2, and F3 20 ppm ZEA-treated groups. Fisher’s exact test. * P<0.05, compared with F0.

Similar articles

Cited by

References

    1. Zinedine A, Soriano JM, Molto JC, Manes J. Review on the toxicity, occurrence, metabolism, detoxification, regulations and intake of zearalenone: an oestrogenic mycotoxin. Food Chem Toxicol. 2007;45:1–18. - PubMed
    1. EFSA. Scientific Opinion on the risks for public health related to the presence of zearalenone in food. EFSA Journal. 2011;9:2197.
    1. Bandera EV, Chandran U, Buckley B, Lin Y, Isukapalli S, Marshall I, et al. Urinary mycoestrogens, body size and breast development in New Jersey girls. Sci Total Environ. 2011;409:5221–7. - PMC - PubMed
    1. Massart F, Saggese G. Oestrogenic mycotoxin exposures and precocious pubertal development. Int J Androl. 2010;33:369–76. - PubMed
    1. Deng F, Tao FB, Liu DY, Xu YY, Hao JH, Sun Y, et al. Effects of growth environments and two environmental endocrine disruptors on children with idiopathic precocious puberty. Eur J Endocrinol. 2012;166:803–9. - PubMed

Publication types

LinkOut - more resources