

Characterization of ryanodine receptor type 1 single channel activity using "on-nucleus" patch clamp
- PMID: 24972488
- PMCID: PMC4120733
- DOI: 10.1016/j.ceca.2014.05.004
Characterization of ryanodine receptor type 1 single channel activity using "on-nucleus" patch clamp
Abstract
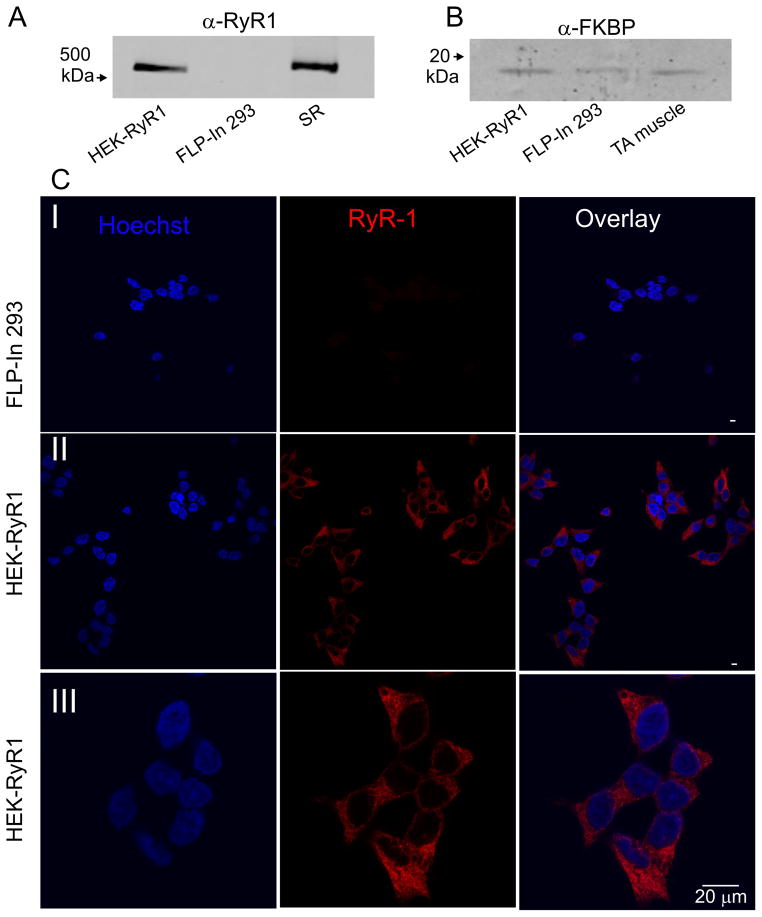
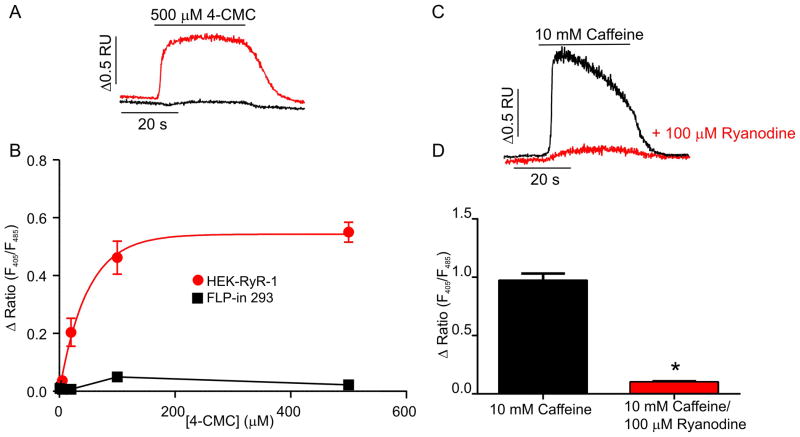
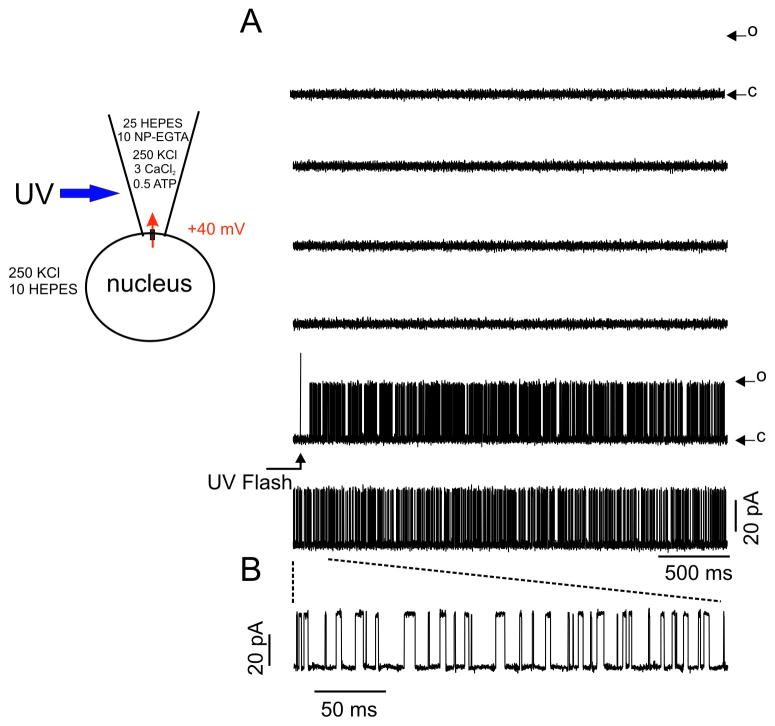
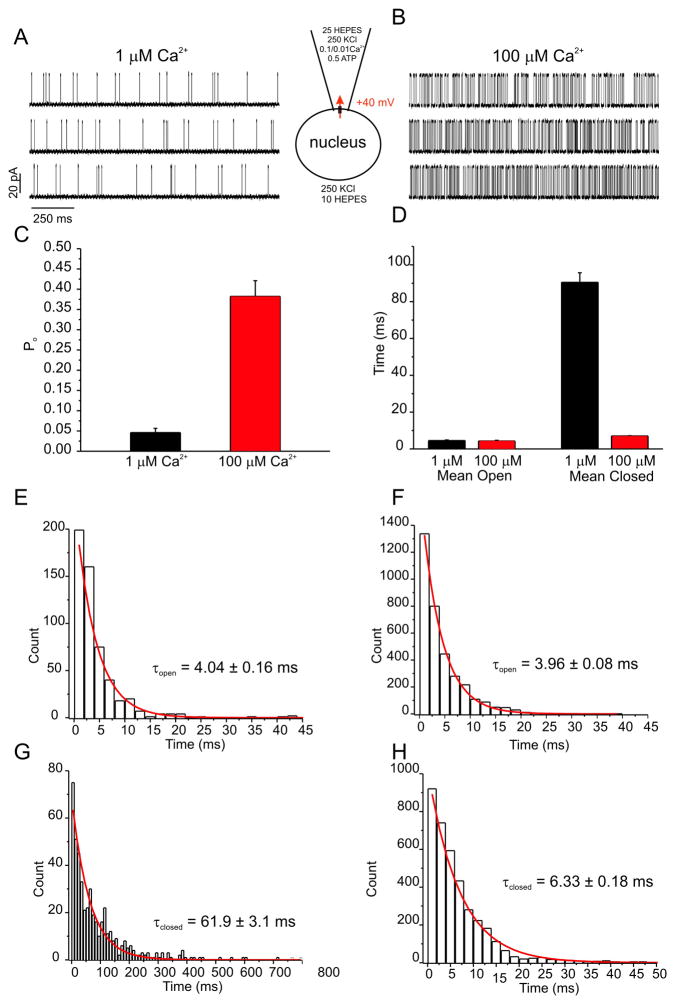
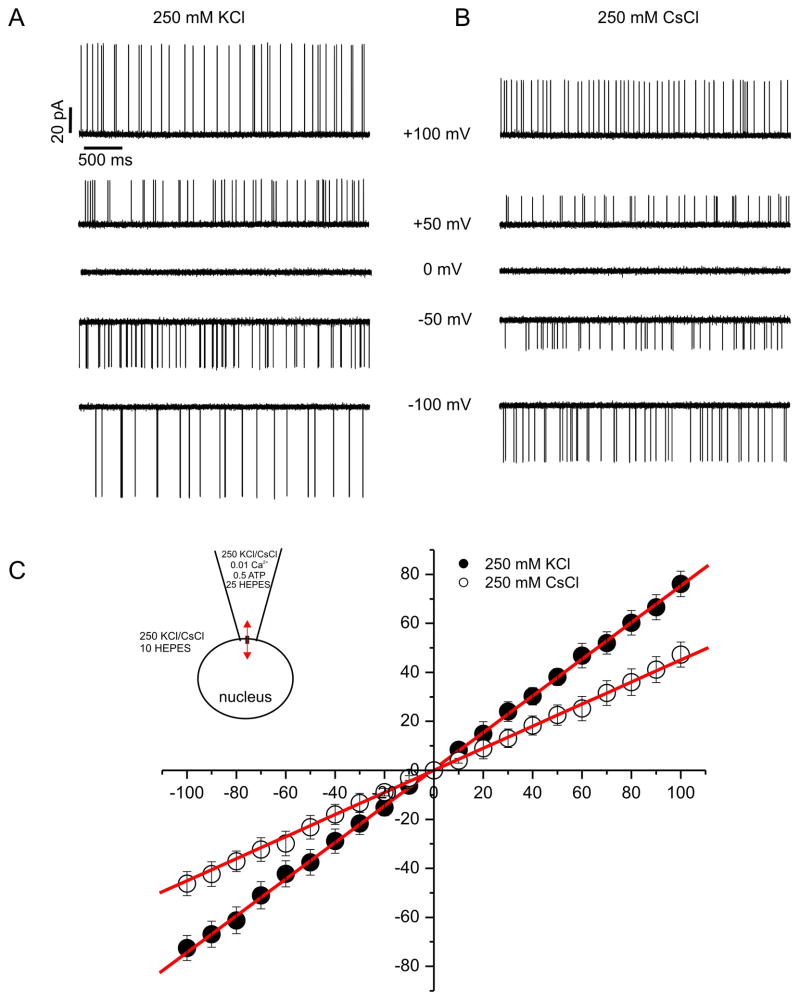
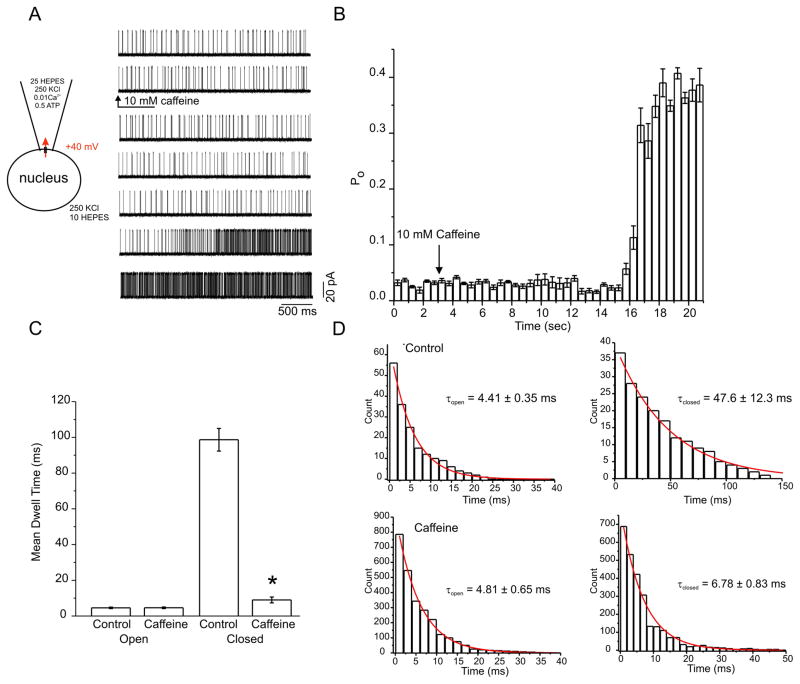
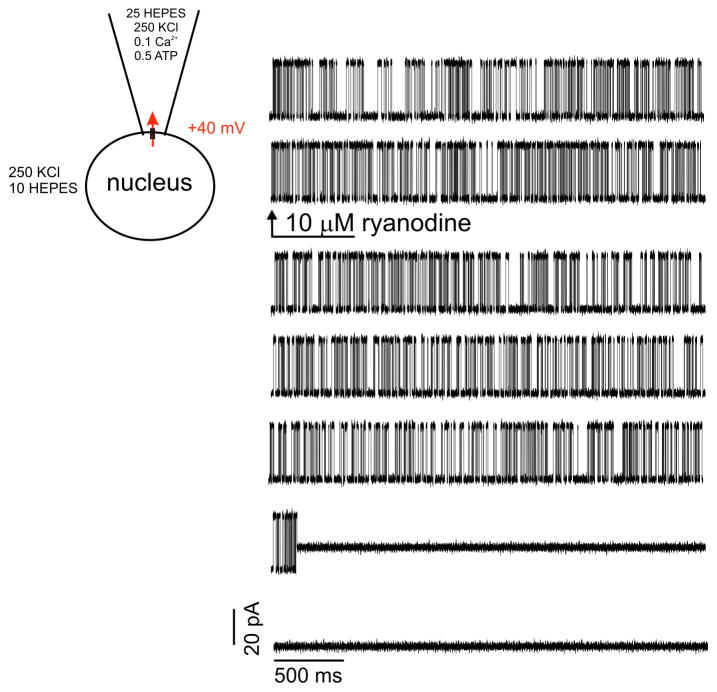
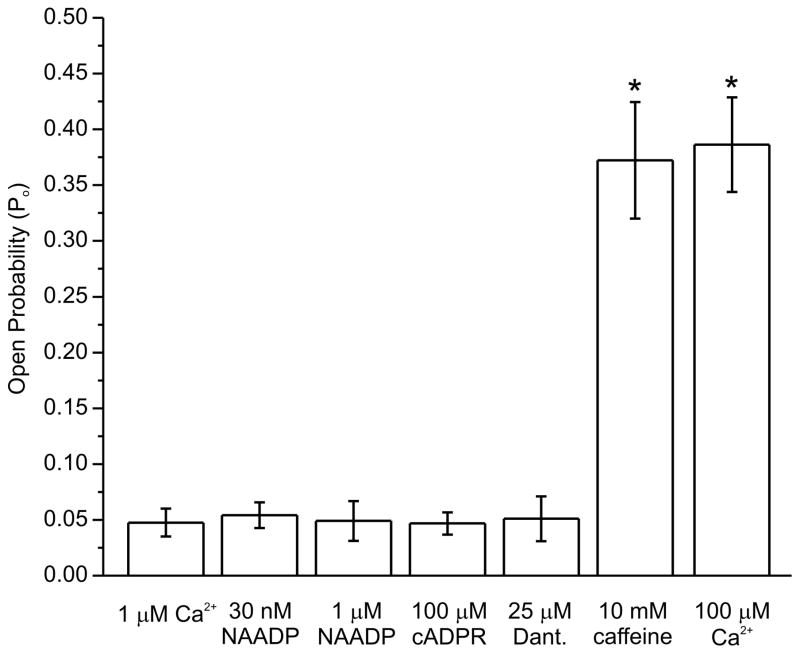
In this study, we provide the first description of the biophysical and pharmacological properties of ryanodine receptor type 1 (RyR1) expressed in a native membrane using the on-nucleus configuration of the patch clamp technique. A stable cell line expressing rabbit RyR1 was established (HEK-RyR1) using the FLP-in 293 cell system. In contrast to untransfected cells, RyR1 expression was readily demonstrated by immunoblotting and immunocytochemistry in HEK-RyR1 cells. In addition, the RyR1 agonists 4-CMC and caffeine activated Ca(2+) release that was inhibited by high concentrations of ryanodine. On nucleus patch clamp was performed in nuclei prepared from HEK-RyR1 cells. Raising the [Ca(2+)] in the patch pipette resulted in the appearance of a large conductance cation channel with well resolved kinetics and the absence of prominent subconductance states. Current versus voltage relationships were ohmic and revealed a chord conductance of ∼750pS or 450pS in symmetrical 250mM KCl or CsCl, respectively. The channel activity was markedly enhanced by caffeine and exposure to ryanodine resulted in the appearance of a subconductance state with a conductance ∼40% of the full channel opening with a Po near unity. In total, these properties are entirely consistent with RyR1 channel activity. Exposure of RyR1 channels to cyclic ADP ribose (cADPr), nicotinic acid adenine dinucleotide phosphate (NAADP) or dantrolene did not alter the single channel activity stimulated by Ca(2+), and thus, it is unlikely these molecules directly modulate RyR1 channel activity. In summary, we describe an experimental platform to monitor the single channel properties of RyR channels. We envision that this system will be influential in characterizing disease-associated RyR mutations and the molecular determinants of RyR channel modulation.
Keywords: Inositol 1,4,5-trisphosphate receptor; Ryanodine receptor; Single channel measurement.
Copyright © 2014 Elsevier Ltd. All rights reserved.
Figures
Similar articles
-
A central core disease mutation in the Ca2+-binding site of skeletal muscle ryanodine receptor impairs single-channel regulation.Am J Physiol Cell Physiol. 2019 Aug 1;317(2):C358-C365. doi: 10.1152/ajpcell.00052.2019. Epub 2019 Jun 5. Am J Physiol Cell Physiol. 2019. PMID: 31166712 Free PMC article.
-
Conformation of ryanodine receptor-2 gates store-operated calcium entry in rat pulmonary arterial myocytes.Cardiovasc Res. 2016 Jul 1;111(1):94-104. doi: 10.1093/cvr/cvw067. Epub 2016 Mar 24. Cardiovasc Res. 2016. PMID: 27013634 Free PMC article.
-
Mutational analysis of putative calcium binding motifs within the skeletal ryanodine receptor isoform, RyR1.J Biol Chem. 2004 Dec 17;279(51):53028-35. doi: 10.1074/jbc.M411136200. Epub 2004 Oct 6. J Biol Chem. 2004. PMID: 15469935
-
Subcellular localization and transcriptional regulation of brain ryanodine receptors. Functional implications.Cell Calcium. 2023 Dec;116:102821. doi: 10.1016/j.ceca.2023.102821. Epub 2023 Nov 4. Cell Calcium. 2023. PMID: 37949035 Review.
-
Ryanodine receptor structure: progress and challenges.J Biol Chem. 2009 Feb 13;284(7):4047-51. doi: 10.1074/jbc.R800054200. Epub 2008 Oct 16. J Biol Chem. 2009. PMID: 18927076 Free PMC article. Review. No abstract available.
Cited by
-
Single-channel recordings of RyR1 at microsecond resolution in CMOS-suspended membranes.Proc Natl Acad Sci U S A. 2018 Feb 20;115(8):E1789-E1798. doi: 10.1073/pnas.1712313115. Epub 2018 Feb 5. Proc Natl Acad Sci U S A. 2018. PMID: 29432144 Free PMC article.
-
Mind the magnesium, in dantrolene suppression of malignant hyperthermia.Proc Natl Acad Sci U S A. 2017 May 2;114(18):4576-4578. doi: 10.1073/pnas.1704103114. Epub 2017 Apr 25. Proc Natl Acad Sci U S A. 2017. PMID: 28442565 Free PMC article. No abstract available.
-
Essential Role of Calmodulin in RyR Inhibition by Dantrolene.Mol Pharmacol. 2015 Jul;88(1):57-63. doi: 10.1124/mol.115.097691. Epub 2015 Apr 28. Mol Pharmacol. 2015. PMID: 25920678 Free PMC article.
-
NAADP Receptors.Cold Spring Harb Perspect Biol. 2019 Nov 1;11(11):a035071. doi: 10.1101/cshperspect.a035071. Cold Spring Harb Perspect Biol. 2019. PMID: 31182546 Free PMC article. Review.
-
Integration of nicotinic acid adenine dinucleotide phosphate (NAADP)-dependent calcium signalling.J Physiol. 2018 Jul;596(14):2735-2743. doi: 10.1113/JP275974. Epub 2018 Apr 26. J Physiol. 2018. PMID: 29635794 Free PMC article. Review.
References
-
- Berridge MJ, Lipp P, Bootman MD. The versatility and universality of calcium signalling. Nat Rev Mol Cell Biol. 2000;1:11–21. - PubMed
-
- I Serysheva. Structure and Function of Calcium Release Channels. Academic Press; 2010.
-
- Fill M, Copello JA. Ryanodine receptor calcium release channels. Physiol Rev. 2002;82:893–922. - PubMed
Publication types
MeSH terms
Substances
Grants and funding
LinkOut - more resources
Full Text Sources
Other Literature Sources
Research Materials
Miscellaneous
