

Meta-analysis based on weighted ordered P-values for genomic data with heterogeneity
- PMID: 24972803
- PMCID: PMC4089554
- DOI: 10.1186/1471-2105-15-226
Meta-analysis based on weighted ordered P-values for genomic data with heterogeneity
Abstract
Background: Meta-analysis has become increasingly popular in recent years, especially in genomic data analysis, due to the fast growth of available data and studies that target the same questions. Many methods have been developed, including classical ones such as Fisher's combined probability test and Stouffer's Z-test. However, not all meta-analyses have the same goal in mind. Some aim at combining information to find signals in at least one of the studies, while others hope to find more consistent signals across the studies. While many classical meta-analysis methods are developed with the former goal in mind, the latter goal has much more practicality for genomic data analysis.
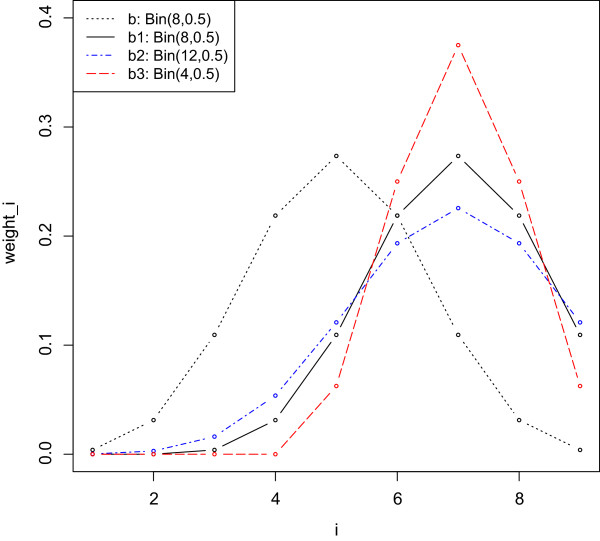
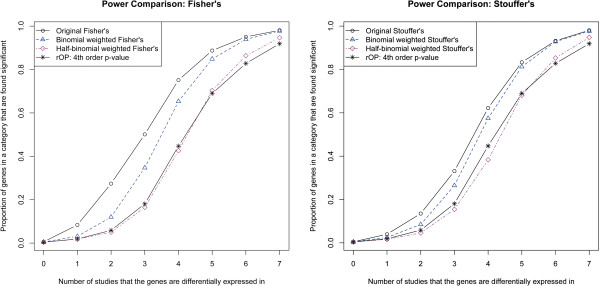
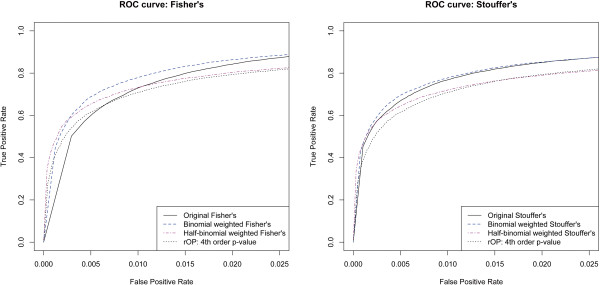
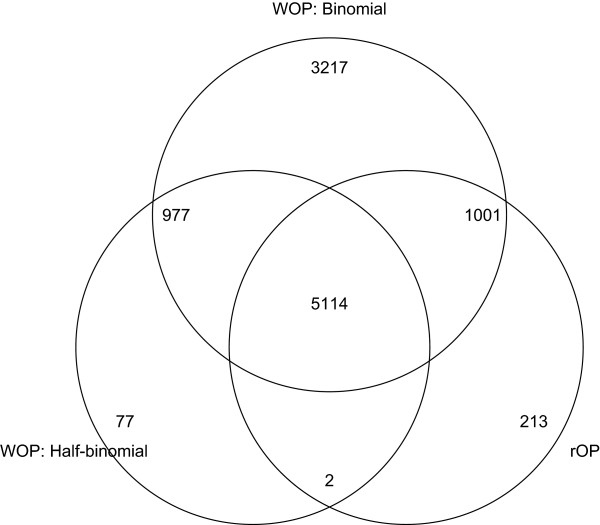
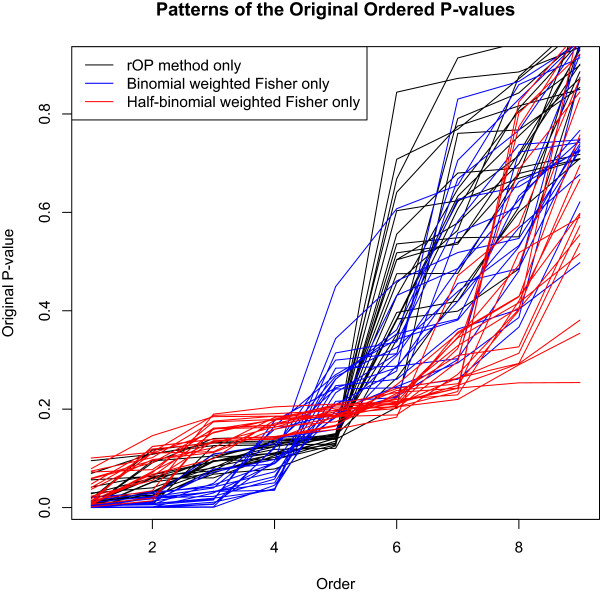
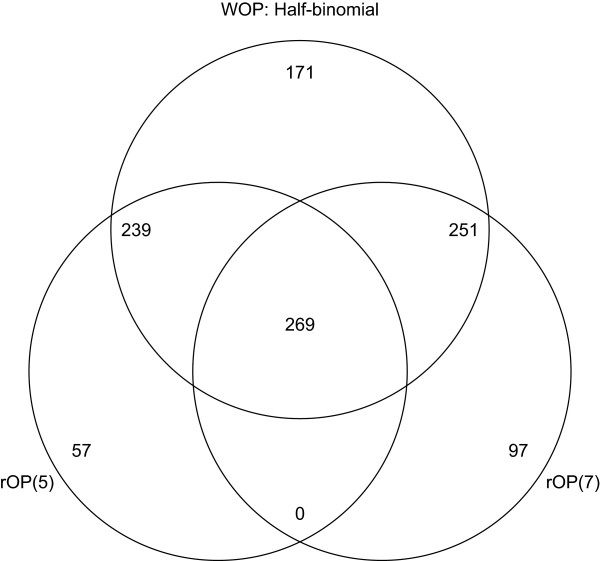
Results: In this paper, we propose a class of meta-analysis methods based on summaries of weighted ordered p-values (WOP) that aim at detecting significance in a majority of studies. We consider weighted versions of classical procedures such as Fisher's method and Stouffer's method where the weight for each p-value is based on its order among the studies. In particular, we consider weights based on the binomial distribution, where the median of the p-values are weighted highest and the outlying p-values are down-weighted. We investigate the properties of our methods and demonstrate their strengths through simulations studies, comparing to existing procedures. In addition, we illustrate application of the proposed methodology by several meta-analysis of gene expression data.
Conclusions: Our proposed weighted ordered p-value (WOP) methods displayed better performance compared to existing methods for testing the hypothesis that there is signal in the majority of studies. They also appeared to be much more robust in applications compared to the rth ordered p-value (rOP) method (Song and Tseng, Ann. Appl. Stat. 2014, 8(2):777-800). With the flexibility of incorporating different p-value combination methods and different weighting schemes, the weighted ordered p-values (WOP) methods have great potential in detecting consistent signal in meta-analysis with heterogeneity.
Figures
References
-
- Fisher RA. Statistical methods for research workers. Oliver and Boyd: Edinburgh; 1925.
-
- Stouffer SA, Suchman EA, Devinney LC, Star SA, Williams RM. The American soldier: adjustment during army life. Princeton, NJ: Princeton University Press; 1949.
-
- Choi JK, Yu U, Kim S, Yoo OJ. Combining multiple microarray studies and modeling interstudy variation. Bioinformatics. 2003;19:84–90. - PubMed
-
- Wilkinson B. A statistical consideration in psychological research. Psychol Bull. 1951;48:156–158. - PubMed
Publication types
MeSH terms
LinkOut - more resources
Full Text Sources
Other Literature Sources
